Dependence of epoch-wise two-way nested ANOVA estimates of variances of unmodeled effects present in relative GPS positioning on satellite elevation cutoff angle and PDOP mask
2022-09-05DarkoAnRadovanurovi
Darko Anđi′c , Radovan Ðurovi′c
a Cadastre and State Property Administration, Department of State Survey and Mapping, Podgorica, Montenegro
b University of Montenegro, Faculty of Civil Engineering, Podgorica, Montenegro
Keywords:Unmodeled effects in relative GPS positioning 2-way nested ANOVA Epoch-wise variance components Satellite elevation cutoff angle change PDOP mask change
ABSTRACT Impact of satellite elevation cutoff angle and position dilution of precision (PDOP) mask change on epoch-wise variance components of unmodeled effects that accompany relative Global Positioning System (GPS) positioning is presented herein. Data used for this study refer to the winter and summer periods of the years with minimal (2008) and maximal (2013) solar activity. These data were collected every 30 s in static mode,at two permanent GPS stations located in Montenegro,establishing a mediumdistance(116-km-long)baseline with a height difference of approximately 760 m between its endpoints.The study showed that changing satellite elevation cutoff angle, with a fixed PDOP mask, affects epochwise two-way nested ANOVA estimates of variances related to the‘far-field’multipath(considered as the nested factor herein) and the combined unmodeled effect of tropospheric and ionospheric refraction(considered as the nesting factor herein). However, changing of PDOP mask, with a fixed satellite elevation cutoff angle, doesn't affect epoch-wise two-way nested ANOVA estimate of variance of the combined unmodeled effect of tropospheric and ionospheric refraction, but, generally, affects the estimate of variance of the ‘far-field’ multipath (possibly mixed with a part of a ‘shorter-term’ ionospheric refraction),which is especially pronounced for the summer period.It should also be noted that there is a significant influence of satellite elevation cutoff angle change on both epoch-wise horizontal and vertical position accuracy,only for the summer period,especially in the presence of maximal solar activity,while there is no significant impact of PDOP mask change on epoch-wise positional accuracy.
1. Introduction
It is well known that,there are always some unmodeled effects remaining in double-differenced phase observations, even if the ionosphere-free (IF) linear combinations of Global Positioning System (GPS) phase observations are used in data processing. The logical consequence is the affection of ambiguity-fixed baseline solutions, represented by the corresponding ordered triples of the relative coordinates e, n and u. Those effects, when it is about medium-range baselines, are dominantly related to station multipath, receiver antenna phase center offsets and variations, as well as tropospheric and ionospheric refraction.
So far, only a few studies have dealt with two-way nested ANOVA in GPS positioning.All those studies treated residual effects that limit the accuracy of relative GPS positioning as the (quasi)random ones figuring in the same linear model, thus enabling an integral approach analysis [1-5].
Based on one-year 0.033-Hz rate GPS data, collected at two Montenegrin permanent GPS network (MontePos) stations, D.Anđi′c [1] first proved the possibility of residual effect variance components estimation in relative GPS positioning, showing variance component ANOVA estimates reach their maximal and minimal values in the summer and winter periods,respectively.As a further research, D. Anđi′c [2] showed the presence of seasonal pattern in time series of variances of GPS residual error ANOVA estimates.
A comprehensive research was presented in Ref.[3],where,for the purpose of the study, four-year 0.033-Hz rate GPS data,collected at ten European GNSS permanent stations, establishing baselines of 5.6,13.6,40,129.5 and 281.9 km in length,were used.Two of these stations are located in Montenegro (MontePos permanent stations PODG and BAR), four in Italy (EUREF permanent stations TORI, IENG, IGMI and PRAT), two in Poland (EUREF permanent stations BOR1 and WROC), and two in Romania (EUREF permanent stations BACA and BAIA).Based on a total of 53 699 979 ambiguity-fixed solutions for the three relative coordinates (e, n and u), the study showed some similarities and differences between results obtained for the daytime and nighttime period for all four seasons (spring, summer, autumn, and winter), as well as the existence of the impact of the residual effects on positional accuracy etc.
D. Anđi′c [4] considered variances of quasi-random effects in relative GPS positioning during daytime and nighttime periods by using a novel two-stage approach,whereby the iterative method of moments was used for calculation of the final variance components related to the effects of short-term (‘far-field’) multipath, joint action of long-term (‘near-field’) multipath and receiver antenna phase center offset and variations, as well as joint action of tropospheric and ionospheric refraction.D.Anđi′c[5]dealt with the impact of sampling interval on variance component ANOVA estimates.
2. Data sets
0.033-Hz rate GPS data,collected in static mode during January and August 2008, as well as January and August 2013, at the two elected MontePos permanent stations, located in Tivat (Fig.1) and Pljevlja (Fig. 2), were used. A medium-distance 116-km-long baseline with a height difference of approximately 760 m between its endpoints was thus provided. This baseline was elected for the study because the related distance and height difference provide the unmodeled effects to be properly considered. In that way, a possibility of consideration of unmodeled effects’ variances in the winter and summer season subperiods of the year with minimal(2008)and maximal(2013)solar activity was provided.These two stations are equipped with Leica GRX1200 receivers and Leica AT504 Choke-Ring/Radome antennas with the same orientation.
As shown in Figs.1 and 2,there are many potential reflectors in the vicinity of both antennas.However,it is only about reflectors in the ‘far-field’ region [6] and it can be spotted that both antennas were set in the same way, so that a presence of ‘near-field’ multipath effects in double-differenced phase observation, and thus in ambiguity-fixed baseline solutions, is neglected.
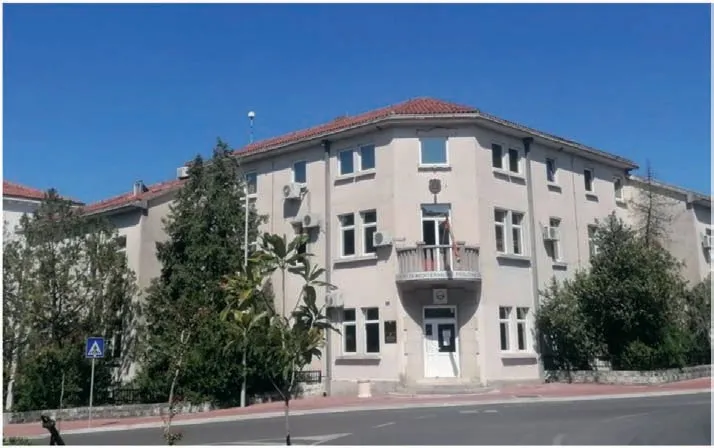
Fig.1. MontePos permanent GPS station in Tivat, Montenegro.
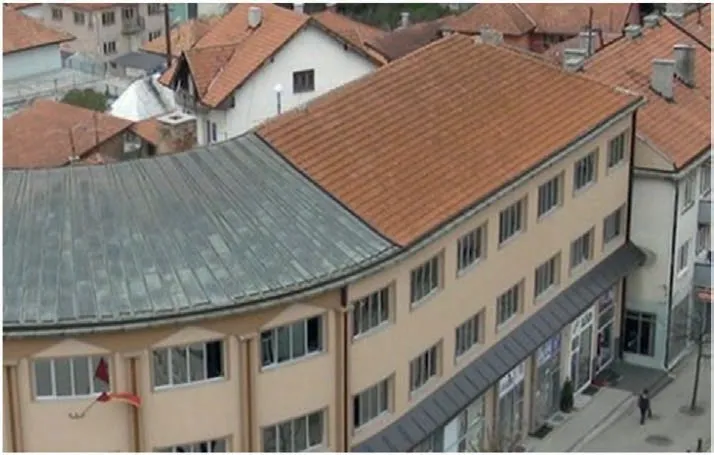
Fig. 2. MontePos permanent GPS station in Pljevlja, Montenegro.
The effects of antenna phase center offsets and variations in double-difference phase observation are neglected [7,8]. All remaining effects, except those related to the combined effect of tropospheric and ionospheric refraction, are also canceled or neglected [9].
Ambiguity-fixed baseline solutions, represented by ordered triples of the relative coordinates (e, n and u), were calculated for each available epoch using Trimble Total Control v2.7 software. In data processing, the On-the-Fly (OTF) processing mode (as an auxiliary one for resolving epoch-level ambiguities),the processing interval of 30 s, the precise orbit type (IGS Final Product), the IF linear combination (given by Eq. (5)), the Saastamoinen tropospheric model, the Mass Spectrometer and Incoherent Scatter(MSIS) meteorological model, as well as satellite elevation cutoff angles of 5°, 10°, 15°and 20°, were used. After each particular processing (using one of the previously mentioned satellite elevation cutoff angles),two reduced datasets were established from the output one.Namely,for each of the sixteen output datasets(for all four months and four values of satellite elevation cutoff angle considered), the first reduced dataset was created by omitting the solutions obtained with PDOP value greater than 8,and the second reduced one by omitting the solutions calculated with PDOP value greater than 4. Only thirty-two datasets reduced as previously described were used in the study.
The fixed solutions obtained after processing the raw GPS data,consequently, included all the errors arose due to the unmodeled effects that are the subject of the research herein(see Eq. (4)).
2.1. Characteristics of ambiguity-fixed baseline solutions obtained after processing the data regarding the year 2008 with minimal solar activity
In this subsection, some relevant characteristics of data regarding the year with minimal solar activity,used in the study as the input ones, are presented.
The reduced number of ambiguity-fixed solutions (considering PDOP value) after processing GPS raw data regarding January and August 2008 as well as the corresponding number of the remaining ones after applying ‘three-sigma’ criterion is shown in Tables 1 and 2. The percentage of the rejected solutions is also there in those tables
Rejecting deviating ambiguity-fixed solutions was performed for each of the three relative coordinates (e, n and u) according to the following steps:
Step 1. Calculation of standard deviation estimate:


that are used as the input data in this study (see subsection 3.1).
In Figs. 3 and 4, the remaining true errors of epoch-wise ambiguity-fixed baseline solutions after applying ‘three-sigma’ criterion, obtained with satellite elevation cutoff angle set to 15°and PDOP value not greater than 4, are presented for January and August 2008, respectively.
Frequency histograms for the remaining true errors of epochwise ambiguity-fixed baseline solutions, obtained with satellite elevation cutoff angle set to 15°and PDOP value not greater than 4,are presented in Fig. 5 for January and August 2008.
The validity of the introduction of the assumptions given by Eq.(7a-e),which the method applied in this study is based on,is well authenticated by the histograms shown in Fig. 5.
Graphical interpretation in frequency domain of the remaining relative coordinate true errors after applying ‘three-sigma’criterion is given by Figs. 6 and 7 (for January 2008), and also by Figs. 8 and 9 (for August 2008). Taking an insight into what is shown in these figures, the dominant frequency responses(magnitudes) can be spotted. It helps to verify the periodicity of unmodeled effects that are the subject of the study.
Analyzing the plots in Figs.6-9,using MATLAB computing and plotting environment,it turned out that spectrum peaks(of interest for this study), each with a dominant magnitude in a narrow frequency range,were represented at the frequencies that correspond to the following signal periods:
January 2008:
· Fig.6:11.3 min,32.6 min,1.1 h,4.0 h,6.0 h,7.9 h,12.3 h,24.0 h(for the relative coordinate e); 15.4 min, 38.8 min,1.5 h, 4.0 h,6.0 h, 7.7 h,12.3 h, 24.0 h (for the relative coordinate n);
· Fig. 7: 13.4 min, 23.9 min, 38.8 min,1.2 h, 5.5 h, 7.9 h, 12.3 h,17.8 h, 23.2 h (for the relative coordinate u);
August 2008:
· Fig.8:14.8 min,53.2 min,3.0 h,4.5 h,5.5 h,8.9 h,11.9 h,16.1 h,24.5 h (for the relative coordinate e); 10.3 min, 47.9 min, 3.0 h,4.0 h, 6.0 h, 8.8 h,12.5 h,19.2 h, 23.7 h (for the relative coordinate n);

Table 1 The number of ambiguity-fixed solutions obtained after processing with PDOP not greater than 8(N0),the number of the remaining ambiguity-fixed solutions after applying‘three-sigma’criterion(Nrem(e),Nrem(n),Nrem(u)),the percentage of the rejected ambiguity-fixed solutions(prej(e),prej(n),prej(u)),the means of true errors(Δemean,Δnmean,Δumean), for the year 2008.

Table 2 The number of ambiguity-fixed solutions obtained after processing with PDOP not greater than 4(N0),the number of the remaining ambiguity-fixed solutions after applying‘three-sigma’criterion(Nrem(e),Nrem(n),Nrem(u)),the percentage of the rejected ambiguity-fixed solutions(prej(e),prej(n),prej(u)),the means of true errors(Δemean,Δnmean,Δumean), for the year 2008.
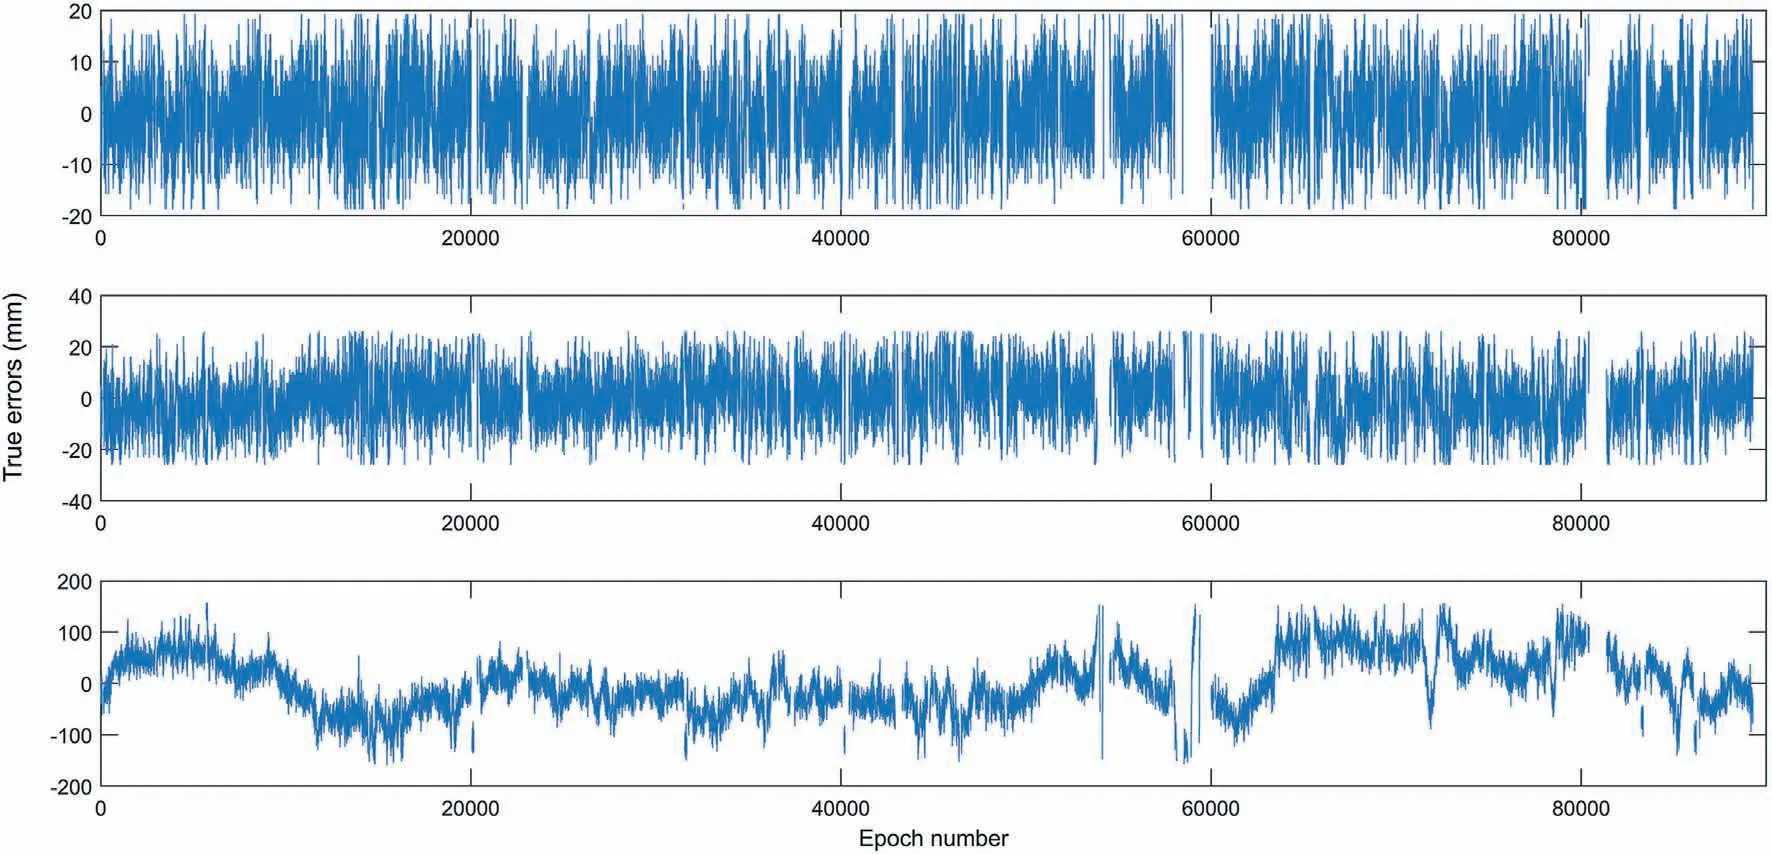
Fig.3. Remaining true errors by the relative coordinates e,n and u(from top to bottom,respectively)after applying‘three-sigma’criterion,for satellite elevation cutoff angle set to 15°, PDOP not greater than 4 (January 2008).
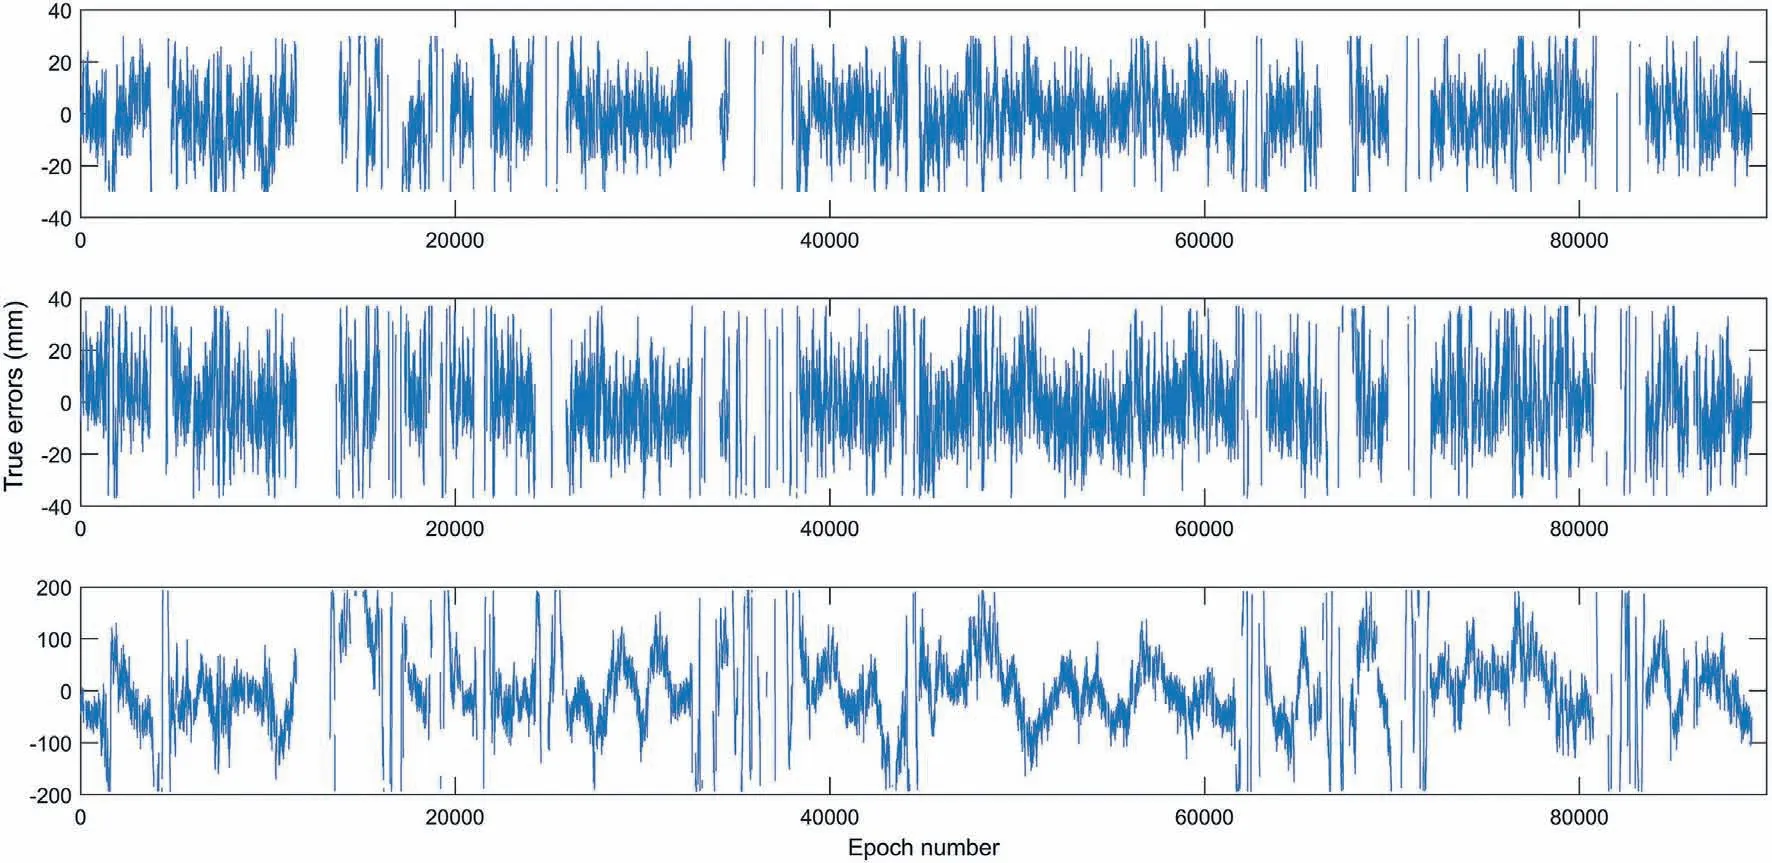
Fig.4. Remaining true errors by the relative coordinates e,n and u(from top to bottom,respectively)after applying‘three-sigma’criterion,for satellite elevation cutoff angle set to 15°, PDOP not greater than 4 (August 2008).
· Fig. 9: 15.0 min,17.9 min,21.8 min, 39.9 min,1.8 h, 5.1 h, 8.0 h,10.6 h,15.8 h, 24.0 h (for the relative coordinate u).
It is about a very wide range in terms of signal periodicity for all three relative coordinates(e,n and u)and both months considered(January and August 2008).Periods of about 2-4 h and longer are,in general, related to the combined effects of tropospheric and ionospheric refraction, since shorter periods correspond to the effect of‘far-field’multipath[10].There is a large distance and a large height difference between the endpoints of the baseline elected for this study.In addition,one should mention that the permanent GPS station in Tivat is located only several meters above the Adriatic Sea level. The permanent station in Pljevlja is located in a mountain region, where a harsher climate is present, in both winter and summer, with atmospheric parameters which are much different from those in the coastal region.
2.2. Characteristics of ambiguity-fixed baseline solutions obtained after processing the data regarding the year 2013 with maximal solar activity
Here the authors present characteristics of data related to the year with maximal solar activity. The presentation manner is identical to that in subsection 2.1(see Tables 3 and 4 as well as Figs.10 and 11).
In the continuation, frequency histograms for the remaining true errors of epoch-wise ambiguity-fixed baseline solutions, obtained with satellite elevation cutoff angle set to 15°and PDOP value less than or equal to 4, are shown in Fig.12 for January and August 2013.
The histograms shown in Fig.12 also authenticate the validity of the assumptions given by Eqs. (7a-e) in subsection 3.1.

Fig.5. Frequency histograms for the remaining true errors by the relative coordinates e,n and u after applying‘three-sigma’criterion,for satellite elevation cutoff angle set to 15°,PDOP not greater than 4 (January and August 2008).
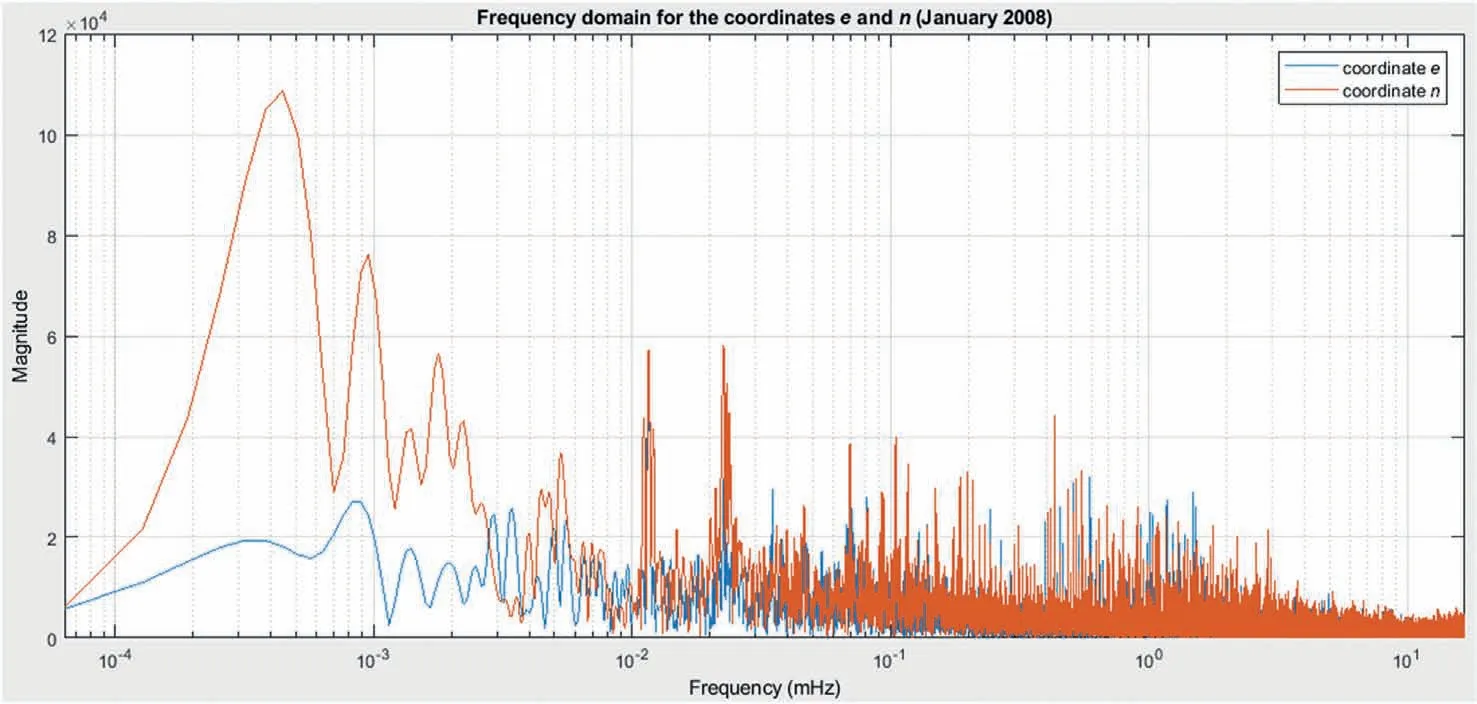
Fig.6. Frequency spectrum for the remaining true errors of the relative coordinates e and n after applying‘three-sigma’criterion,for satellite elevation cutoff angle set to 15°,PDOP not greater than 4 (January 2008).
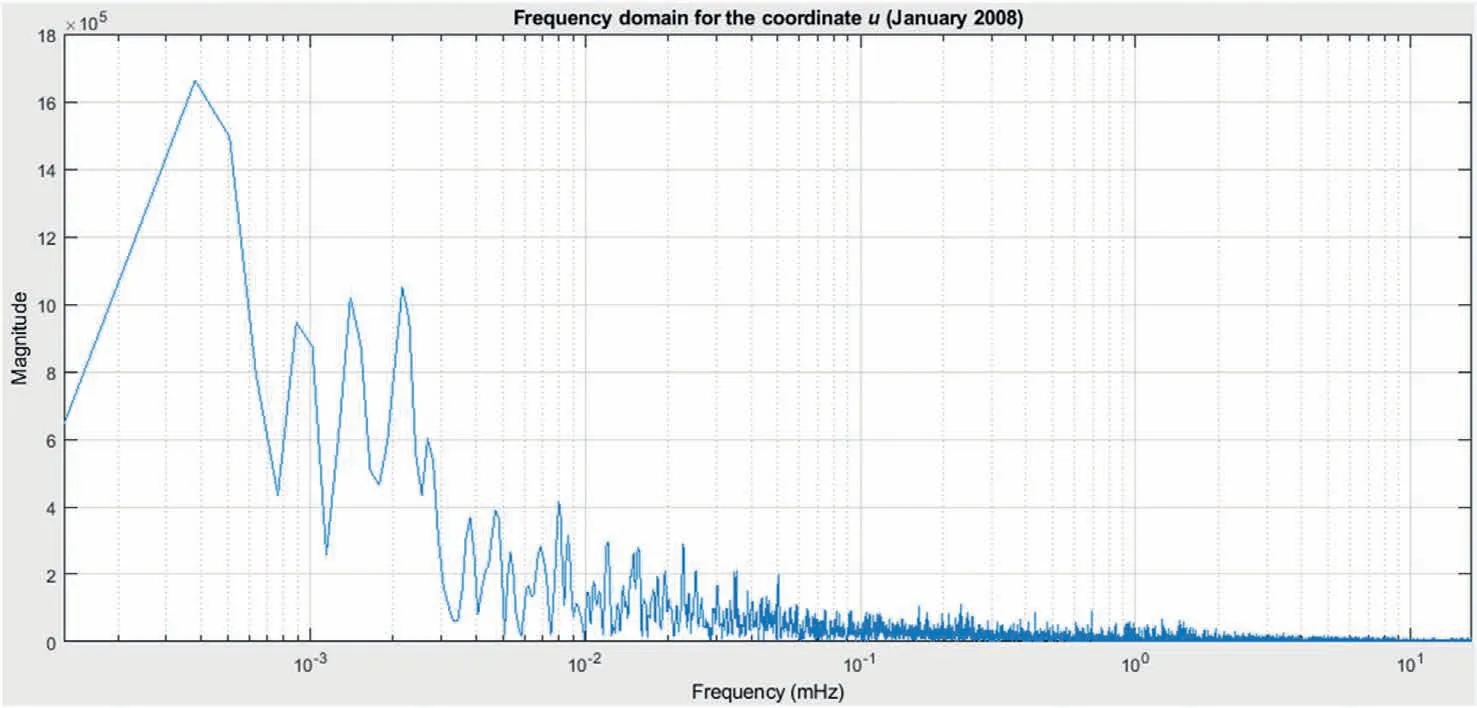
Fig. 7. Frequency spectrum for the remaining true errors of the relative coordinate u after applying‘three-sigma’ criterion, for satellite elevation cutoff angle set to 15°, PDOP not greater than 4 (January 2008).
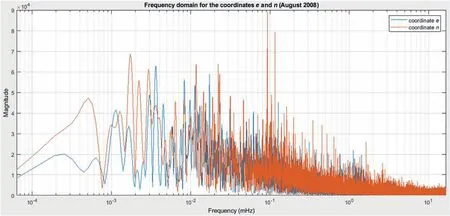
Fig.8. Frequency spectrum for the remaining true errors of the relative coordinates e and n after applying‘three-sigma’criterion,for satellite elevation cutoff angle set to 15°,PDOP not greater than 4 (August 2008).

Fig. 9. Frequency spectrum for the remaining true errors of the relative coordinate u after applying‘three-sigma’criterion, for satellite elevation cutoff angle set to 15°,PDOP not greater than 4 (August 2008).

Table 3 The number of ambiguity-fixed solutions obtained after processing with PDOP not greater than 8(N0),the number of the remaining ambiguity-fixed solutions after applying‘three-sigma’criterion(Nrem(e),Nrem(n),Nrem(u)),the percentage of the rejected ambiguity-fixed solutions(prej(e),prej(n),prej(u)),the means of true errors(Δemean,Δnmean,Δumean), for the year 2013.
Frequency spectrum for the remaining relative coordinate true errors is shown in Figs.13 and 14(for January 2013),Figs.15 and 16(for August 2013).
After consideration of the plots in Figs.13-16,in the same way as in the case of those presented in Figs. 6-9, the following signal periods turned out:January 2013:
· Fig. 13: 11.2 min, 15.3 min, 55.2 min, 1.7 h, 2.7 h, 4.1 h, 6.0 h,10.7 h,24.3 h(for the relative coordinate e);17.1 min,27.6 min,51.3 min,1.7 h,2.5 h,4.4 h,6.6 h,12.4 h,24.0 h(for the relative coordinate n);

Table 4 The number of ambiguity-fixed solutions obtained after processing with PDOP not greater than 4(N0),the number of the remaining ambiguity-fixed solutions after applying‘three-sigma’criterion(Nrem(e),Nrem(n),Nrem(u)),the percentage of the rejected ambiguity-fixed solutions(prej(e),prej(n),prej(u)),the means of true errors(Δemean,Δnmean,Δumean), for the year 2013.

Fig.10. Remaining true errors by the relative coordinates e,n and u(from top to bottom,respectively)after applying‘three-sigma’criterion,for satellite elevation cutoff angle set to 15°, PDOP not greater than 4 (January 2013).

Fig.11. Remaining true errors by the relative coordinates e,n and u(from top to bottom,respectively)after applying‘three-sigma’criterion,for satellite elevation cutoff angle set to 15°, PDOP not greater than 4 (August 2013).

Fig.12. Frequency histograms for the remaining true errors by the relative coordinates e,n and u after applying‘three-sigma’criterion,for satellite elevation cutoff angle set to 15°,PDOP not greater than 4 (January and August 2013).
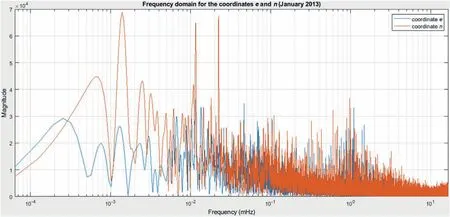
Fig.13. Frequency spectrum for the remaining true errors of the relative coordinates e and n after applying ‘three-sigma’ criterion, for satellite elevation cutoff angle set to 15°,PDOP not greater than 4 (January 2013).
· Fig.14:16.5 min,31.2 min,1.4 h,2.0 h,4.6 h,8.9 h,19.5 h,27.0 h(for the relative coordinate u);
August 2013:
· Fig.15:15.6 min,27.1 min,48.1 min,1.3 h,1.9 h,3.3 h,4.8 h,6.0 h,9.3 h, 12.0 h, 29.9 h (for the relative coordinate e); 15.4 min,26.6 min,42.2 min,1.2 h,2.7 h,3.9 h,5.1 h,6.5 h,10.4 h,11.8 h,23.7 h (for the relative coordinate n);
· Fig.16: 15.0 min, 22.4 min,1.9 h, 4.3 h, 7.8 h,13.7 h, 23.2 h (for the relative coordinate u).
Reasoning similar to that related to Figs. 6-9 is also valid here.
3. Methods
Before the presentation of the theory related to the use of twoway nested ANOVA in relative GPS positioning,let's remember the double-differenced phase observation model, that, for baselines of less than 500 km in length,which are of interest for this study,is as follows [3]:

where the following denotations are introduced: Φ - the phase observation;ρ- the range between the receiver (r1or r2) and the satellite(s1or s2);λ-the nominal wavelength(of the carrier at the frequency f); N - the carrier phase ambiguity; t - the measurement epoch; d - the unmodeled error due to the effect of ionospheric refraction(iono),tropospheric refraction(tropo),multipath(mp), receiver antenna phase center offset (rapco) or receiver antenna phase center variations(rapcv);ε-the purely random error of phase observation.
Taking into account what was previously mentioned in section 2,we canwrite thedouble-differenced phase observationmodelforthe baseline elected herein as follows:
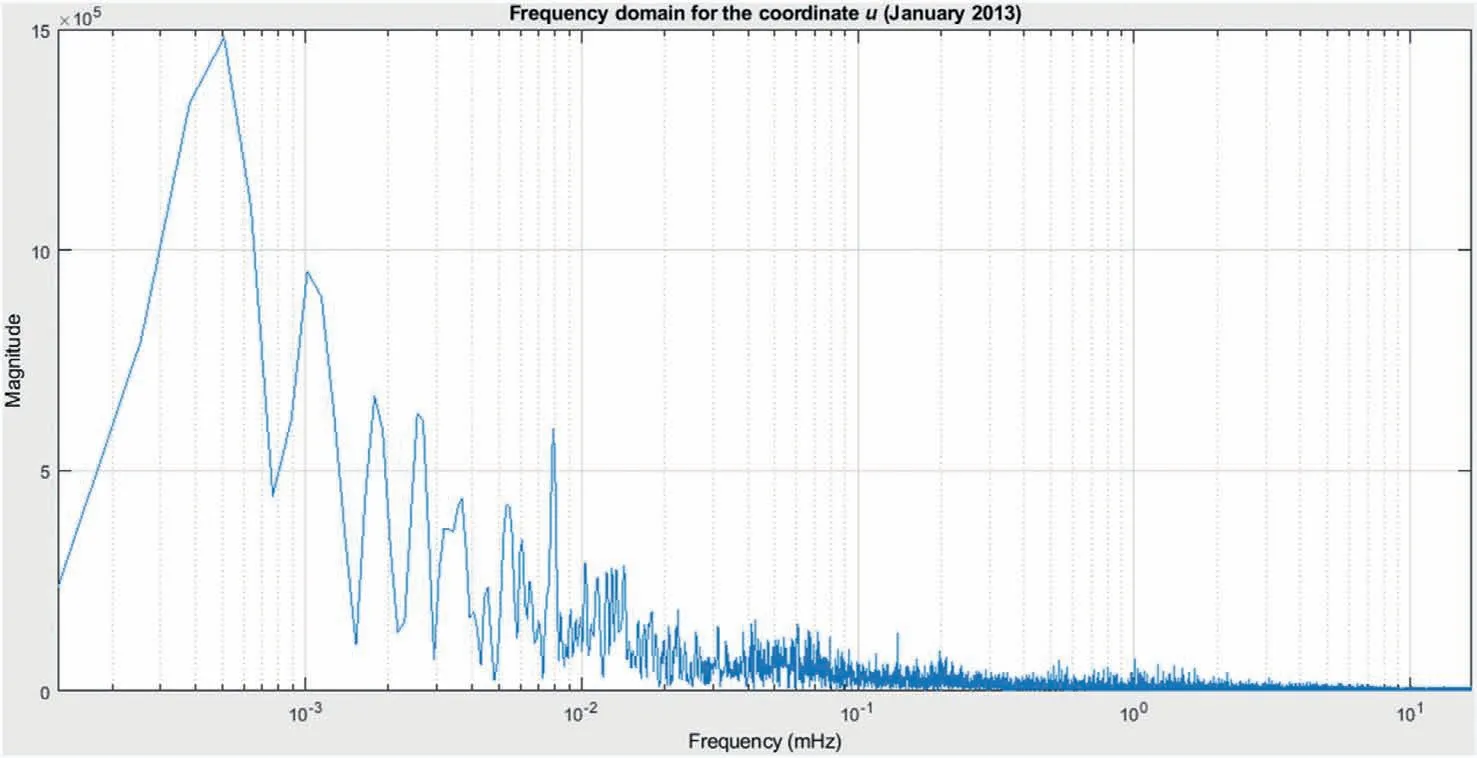
Fig.14. Frequency spectrum for the remaining true errors of the relative coordinate u after applying‘three-sigma’criterion,for satellite elevation cutoff angle set to 15°,PDOP not greater than 4 (January 2013).

Fig.15. Frequency spectrum for the remaining true errors of the relative coordinates e and n after applying ‘three-sigma’ criterion, for satellite elevation cutoff angle set to 15°,PDOP not greater than 4 (August 2013).
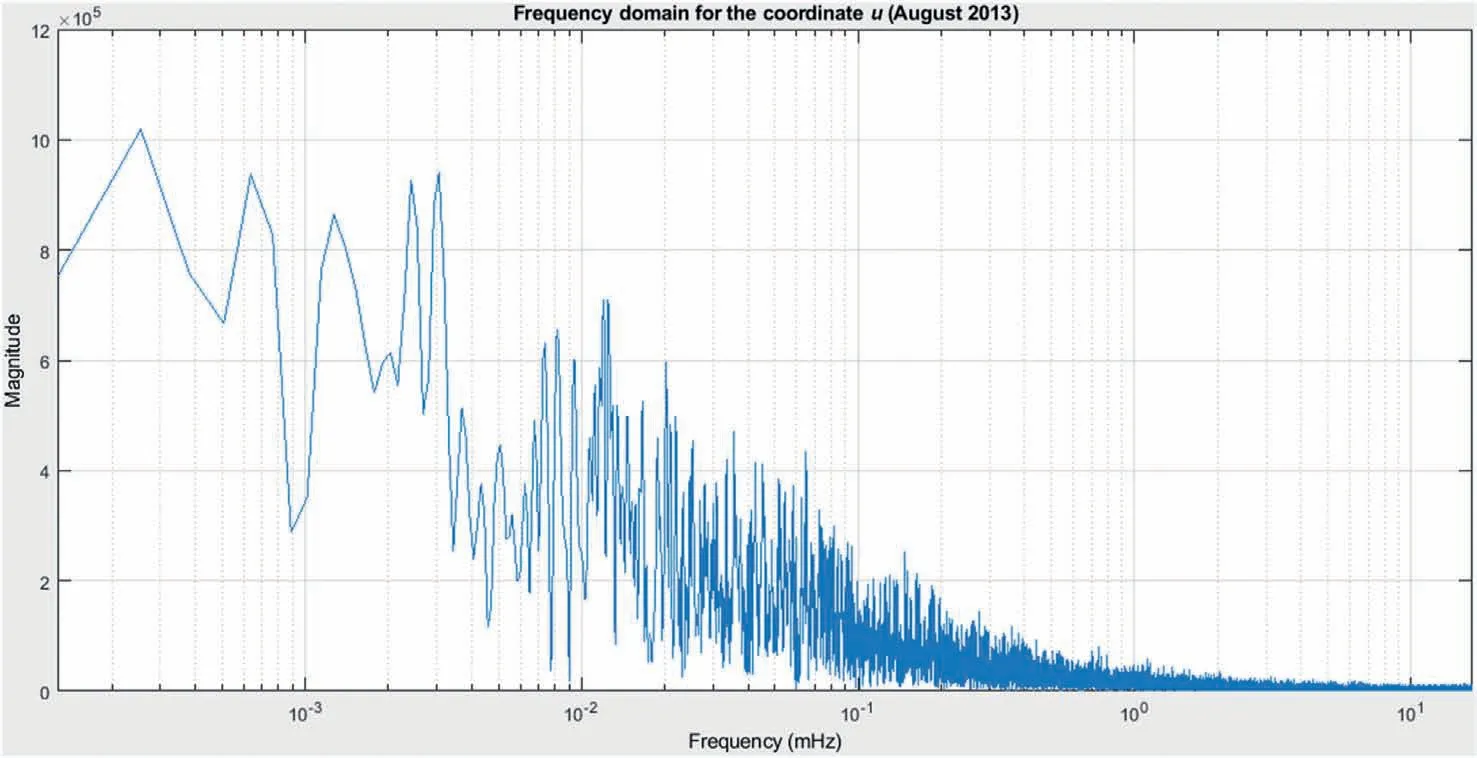
Fig.16. Frequency spectrum for the remaining true errors of the relative coordinate u after applying‘three-sigma’criterion,for satellite elevation cutoff angle set to 15°,PDOP not greater than 4 (August 2013).


where L1=1575.42 MHz and L2 = 1227.60 MHz.
3.1. Estimation of unmodeled effect variance components in relative GPS positioning based on two-way nested ANOVA
The use of the two-way nested ANOVA in relative GPS positioning is well-documented in Refs. [1-5], so, in this article, the authors briefly present the related theory.
The method used in this study is based on the following true error linear model [3]:


Now, provided that statistical significance of the influence of both nested (β) and nesting factor (α) exists (this is verified in the way described in detail in Ref. [5]), we can write the estimates of variance components as follows [1,2]:


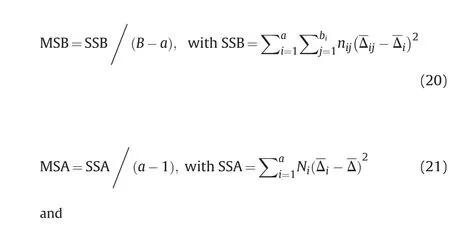
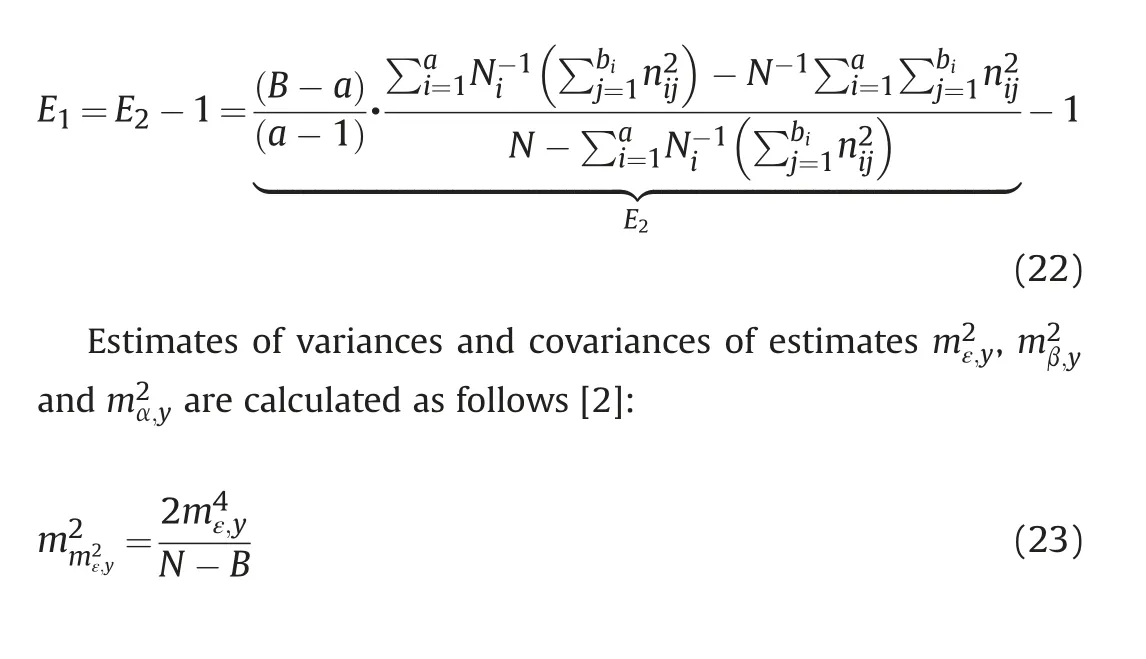


Now, we can calculate estimates of correlation coefficients as follows:

3.2. Statistical comparison of unmodeled effect variances obtained by applying four different satellite elevation cutoff angles and two PDOP masks
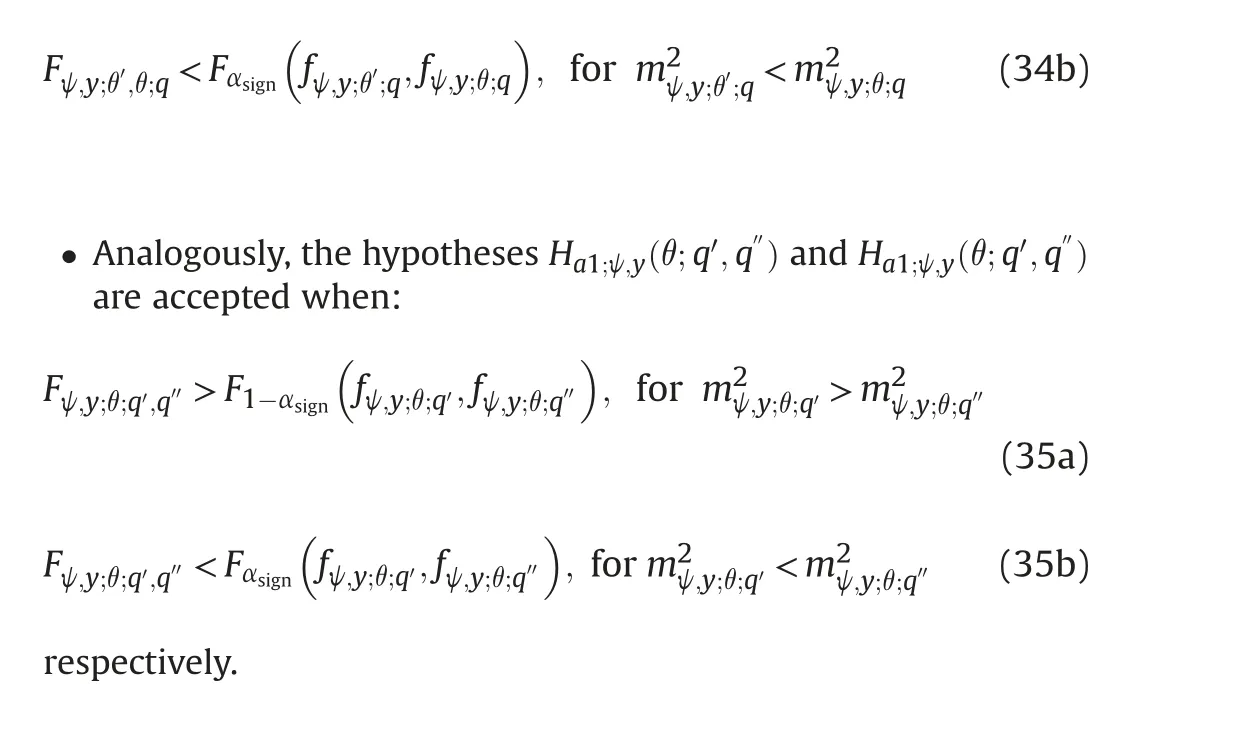
As the aim of this study is to compare epoch-wise two-way nested ANOVA estimates obtained by setting satellite elevation cutoff angle to four different values, along with changing PDOP mask, for that purpose, the authors use the test statistic on which the well-known F-test is based on.
Namely, for comparison of variances obtained for the same PDOP mask and different satellite elevation cutoff angles, the following test statistic is introduced:

3.3. Measures for evaluating the impact of satellite elevation cutoff angle and PDOP mask change on positional accuracy
As different settings of satellite elevation cutoff angle in the stage of data processing lead to different results for two-way nested ANOVA estimates of variances of unmodeled effects, there are,consequently, changes in horizontal (en) and vertical (u) position accuracy. So, to evaluate the related impact, the authors use the following relative differences with the previously introduced parameters θ,θ′, q, q′and q′′:

4. Results
For the calculation purpose,and after considering the frequency spectrum shown in Figs. 6-9 and 13-16, the authors adopted the interval-variant(3 min,120 min)[1].Namely,such a choice implied two-way nested ANOVA estimation using smaller and larger subsets of relative coordinate true errors. These subsets were established by the division of the input dataset that contained all true errors in such a way that each individual subset contained consecutive data within the time interval of 3 min(for the smaller data subsets,whereby the influence of the effect β was assumed to be constant)and 120 min(for the larger data subsets,whereby,this time, the influence of the effect α was assumed to be constant, or,eventually, with a minor, non-constant influence, that is mixed with the dominant influence of the‘far-field’multipath in this 2-h interval).
The smaller data subsets provided an estimation of the variance of the purely random effect ε,by using Eq.(13),and the larger ones were used to estimate the variance of the effect β,by using Eq.(14).Once these two estimates are calculated, the third variance component(for the effect α)can be easily obtained according to Eq.(15).
Finally, the estimates of variances and covariances of m2ε,y, m2β,yand m2α,y,as well as the estimates of the corresponding correlation coefficients, are, then, calculated using Eqs. (23-29).
In Tables 5-10,all square roots of obtained epoch-wise two-way nested ANOVA estimates of unmodeled effect variance components with the corresponding degrees of freedom are presented.
As presented in Tables 5-10, we can conclude that the ratio of the corresponding square roots of epoch-wise two-way nested ANOVA estimates of unmodeled effect variance components obtained for January 2013 and January 2008 is approximately equal to 1, for both effects (β and α), all three relative coordinates (e, n and u), all four satellite elevation cutoff angles considered (5°,10°, 15°and 20°) and both PDOP masks (PDOP ≤4 and PDOP ≤8), i.e.:


Table 5 Square roots of epoch-wise two-way nested ANOVA estimates of unmodeled effect variance components (in millimeters) with their degrees of freedom, obtained for four satellite elevation cutoff angles and two PDOP masks, for the relative coordinate e (January and August 2008).

Table 6 Square roots of epoch-wise two-way nested ANOVA estimates of unmodeled effect variance components (in millimeters) with their degrees of freedom, obtained for four satellite elevation cutoff angles and two PDOP masks, for the relative coordinate e (January and August 2013).

Table 7 Square roots of epoch-wise two-way nested ANOVA estimates of unmodeled effect variance components (in millimeters) with their degrees of freedom, obtained for four satellite elevation cutoff angles and two PDOP masks, for the relative coordinate n (January and August 2008).

Table 8 Square roots of epoch-wise two-way nested ANOVA estimates of unmodeled effect variance components (in millimeters) with their degrees of freedom, obtained for four satellite elevation cutoff angles and two PDOP masks, for the relative coordinate n (January and August 2013).

Table 9 Square roots of epoch-wise two-way nested ANOVA estimates of unmodeled effect variance components (in millimeters) with their degrees of freedom, obtained for four satellite elevation cutoff angles and two PDOP masks, for the relative coordinate u (January and August 2008).


Considering the results given by Eqs. (40)-(42c), we can conclude there is, practically, no difference between the corresponding square roots of variance component estimates, first of which was obtained for the winter period related to the year with minimal solar activity(2008)and the second one was obtained also for the winter period, but related to the year with maximal solar activity (2013), no matter what relative coordinate, satellite elevation cutoff angle and PDOP mask is about.On the other hand,that's not the same case when comparing the results related to the summer period of the two years. A general conclusion is the presence of the impact of solar activity on the results obtained for the lower satellite elevation cutoff angles, 5°and 10°, whereby the greatest impact exists with the relative coordinate e,with the ratio values reaching, even,5 (for the effect β) and 16 (for the effect α).
4.1. Impact of satellite elevation cutoff angle and PDOP mask on epoch-wise two-way nested ANOVA estimates for unmodeled effects
In this subsection,at first,results after statistical comparison of two-way nested ANOVA variance components of unmodeled effects, obtained for all four satellite elevation cutoff angles (5°,10°,15°, 20°) and the same PDOP mask, are shown in Tables 11-13.
After that, results after the homogeneity testing of two-way nested ANOVA variance components of unmodeled effects, obtained for both PDOP masks (PDOP ≤8, PDOP ≤4) and the same satellite elevation cutoff angle, are presented in Tables 14-16.
Thesignificancelevelαsignwasassumedtobe0.01forallthetestings.Remark 1. In Tables 11-13, the following denotements are represented: 0 (if the hypothesis H0;ψ,y(θ′,θ;q) is accepted), a1 (if the hypothesis Ha1;ψ,y(θ′,θ;q) is accepted) and a2 (if the hypothesis Ha2;ψ,y(θ′,θ;q) is accepted).
Remark 2. In Tables 14-16, the following denotements are represented:0(if the hypothesis H0;ψ,y(θ;q′,q′′)is accepted),a1(if thehypothesis Ha1;ψ,y(θ;q′,q′′) is accepted) and a2 (if the hypothesis Ha2;ψ,y(θ;q′,q′′) is accepted).

Table 11 Accepted hypotheses after the homogeneity testing of unmodeled effect variance components obtained for different satellite elevation cutoff angles and a fixed PDOP mask,for the relative coordinate e (January and August 2008; January and August 2013).

Table 12 Accepted hypotheses after the homogeneity testing of unmodeled effect variance components obtained for different satellite elevation cutoff angles and a fixed PDOP mask,for the relative coordinate n (January and August 2008; January and August 2013).
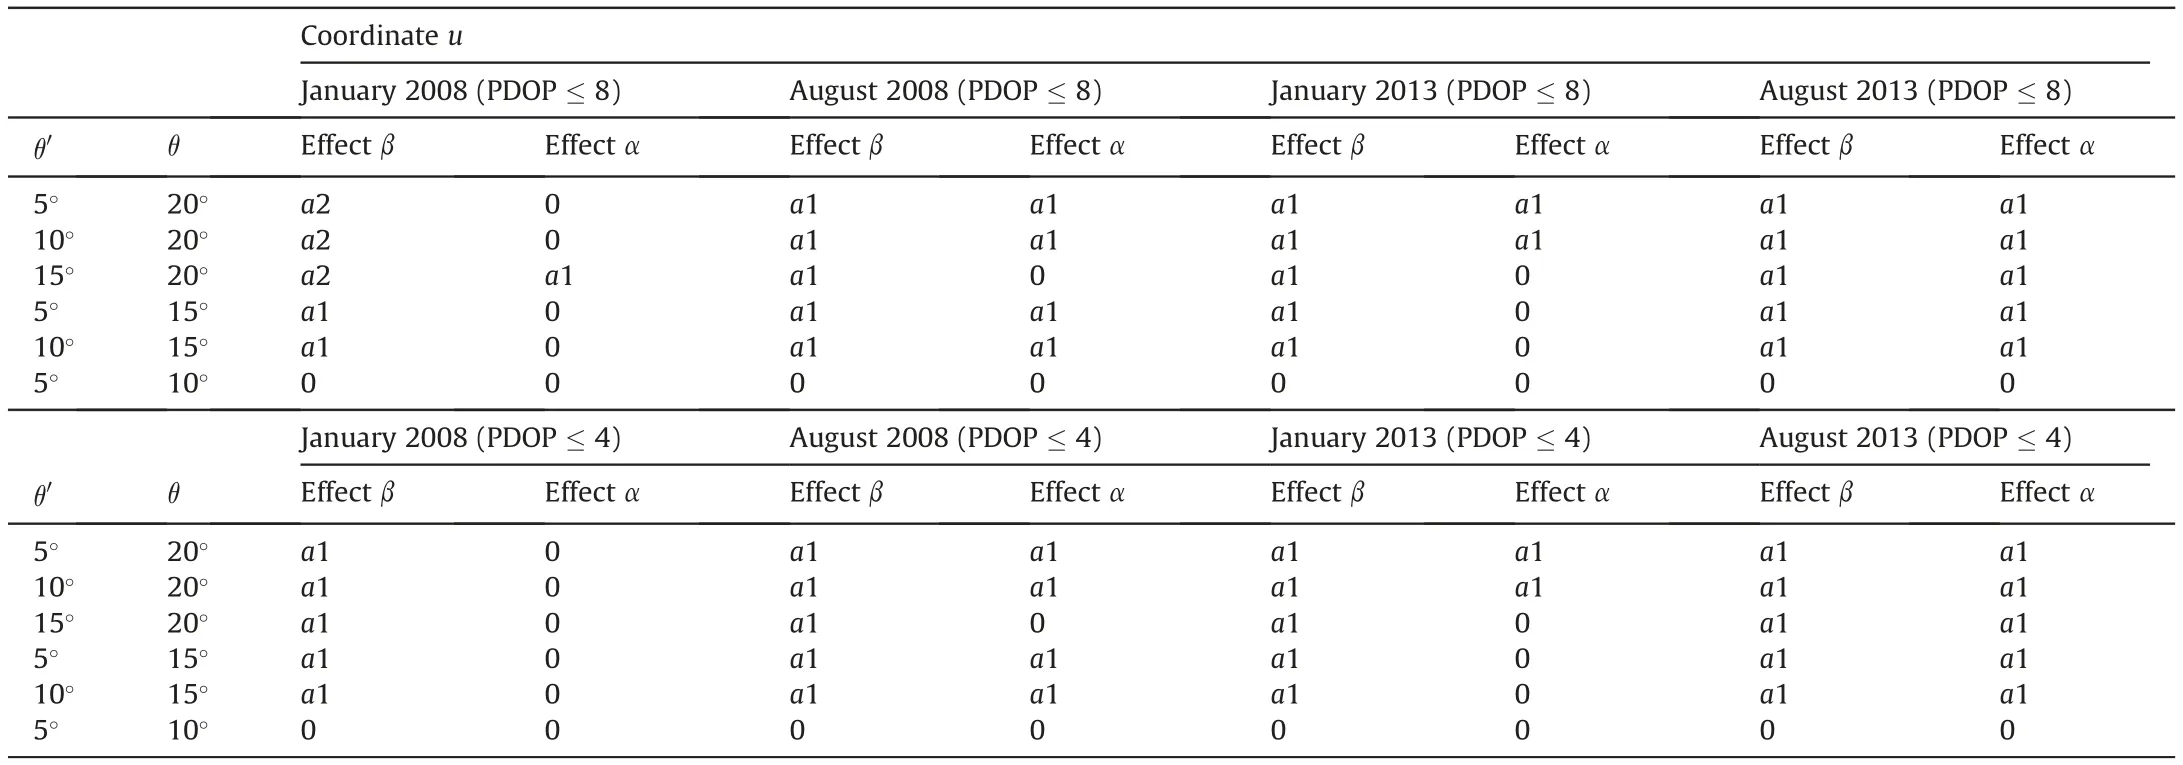
Table 13 Accepted hypotheses after the homogeneity testing of unmodeled effect variance components obtained for different satellite elevation cutoff angles and a fixed PDOP mask,for the relative coordinate u (January and August 2008; January and August 2013).

Table 14 Accepted hypotheses after the homogeneity testing of unmodeled effect variance components obtained for different PDOP masks and a fixed satellite elevation cutoff angle,for the relative coordinate e (January and August 2008; January and August 2013).

Table 15 Accepted hypotheses after the homogeneity testing of unmodeled effect variance components obtained for different PDOP masks and a fixed satellite elevation cutoff angle,for the relative coordinate n (January and August 2008; January and August 2013).

Table 16 Accepted hypotheses after the homogeneity testing of unmodeled effect variance components obtained for different PDOP masks and a fixed satellite elevation cutoff angle,for the relative coordinate u (January and August 2008; January and August 2013).
4.2. Impact of satellite elevation cutoff angle and PDOP mask on epoch-wise horizontal and vertical position accuracy
In this subsection,results for horizontal(en)and vertical(u)position accuracy relative differences obtained for different satellite elevation cutoff angles and the fixed PDOP mask, as well as those calculated for different PDOP masks and the fixed satellite elevation cutoff angle,are presented.The first ones are given in Table 17 and the second ones in Table 18.
5. Discussion
5.1. Discussion about outcomes related to statistical comparison of two variances of the effects β and α obtained using different satellite elevation cutoff angles with a fixed PDOP mask
When it comes to the effect β,for all three relative coordinates(e,n and u), all four months (regarding the years 2008 and 2013) and both PDOP masks considered, it turned out that its variances obtained for a satellite elevation cutoff angle smaller than that used as a reference one are,generally,greater than or equal to those calculated for that reference satellite elevation cutoff angle (Tables 11-13).There are three exceptions,only arising with the relative coordinate u, where it was obtained that variances related to the data from January 2008(PDOP ≤8)and calculated using the satellite elevation cutoff angles of 5°,10°and 15°are all less than reference variance,calculated for the satellite elevation cutoff angle of 20°(Table 13).It should also be noted that, with only exceptions regarding August 2013 (for both PDOP masks) in the case of the coordinate e (see Table 11),as well as August 2013(only for PDOP ≤8)in the case of the coordinate n (Table 12), there is statistical equality between variances calculated using the satellite elevation cutoff angles of 5°and 10°.

Table 17 Horizontal(en)and vertical(u)position accuracy relative differences for different satellite elevation cutoff angles and a fixed PDOP mask(January and August 2008;January and August 2013).

Table 18 Horizontal(en)and vertical(u)position accuracy relative differences for different PDOP masks and a fixed satellite elevation cutoff angle(January and August 2008;January and August 2013).
As for the effect α,the comparison of two variances shows that the variances are, generally, greater than or equal to the reference variance for all three relative coordinates, for all four months and both PDOP masks considered.There are almost the same outcomes for January 2008, no matter which PDOP mask is used, with a few exceptions. Namely, in most cases, there is statistical equality of compared variances, with only three exceptions, two of which are related to the coordinate n and one is related to the coordinate u(Tables 12 and 13).The number of cases with statistical inequality of variances, for January 2013 and for each PDOP mask used, reaches 33.33%for both coordinates e and u.However,when it is about the coordinate n, that number reaches 50%.
On the other hand, when considering the summer period,especially in the year with maximal solar activity, regardless of which PDOP mask is used, we have statistical equality only when comparing variances obtained using the satellite elevation cutoff angles of 5°and 10°.The exception exists only when it is about the coordinate n,for August 2013 and PDOP ≤8,when the variance of the effect α is the greater one compared to the reference one. For August 2008, however, when it comes to the coordinate u, only when comparing variances obtained using the satellite elevation cutoff angles of 15°and 20°(used as the reference one),as well as in the case when the reference angle is 10°, we have statistical equality for both PDOP masks. The same outcomes exist with the coordinate n for PDOP ≤8. But, when PDOP ≤4, there is one difference concerning the corresponding outcome for the coordinate u.Namely,in the case of the coordinate n,for the satellite elevation cutoff angles of 15°and 20°(used as the reference one), there is statistical equality (Table 12). For August 2008 and both PDOP masks used, there is a statistical inequality only when the satellite elevation cutoff angle of 20°is chosen as the reference one.
5.2. Discussion about outcomes related to statistical comparison of two variances of the effects β and α obtained using different PDOP masks with a fixed satellite elevation cutoff angle
The impact of PDOP mask change on epoch-wise two-way nested ANOVA estimates of variances of the effects β and α is presented by Tables 14-16. For all three coordinates, all four satellite elevation cutoff angles and for the four months, there is statistical equality between the corresponding variances of the effect α obtained for the fixed satellite elevation cutoff angle with different PDOP masks. The only exception is present with the coordinate n for August 2013 and for the satellite elevation cutoff angle of 5°(Table 15).
However, when it is about the effect β, on the basis of what is presented in Tables 14-16, one can easily be spotted that PDOP mask change does matter,especially in the summer period(August 2008 and August 2013 herein).
5.3. Discussion about outcomes related to the impact of satellite elevation cutoff angle and PDOP mask changes on horizontal and vertical position accuracy
As shown in Table 17, assuming 20% as a significant relative difference value for both horizontal and vertical positions, a significant impact is present only in the summer period,especially in August 2013,no matter which PDOP mask is used.Namely,relative differences are maximal when comparing standard deviation estimates obtained using satellite elevation cutoff angles of 5°or 10°with those reference ones,calculated using the angles of 15°or 20°.For horizontal (en) and vertical (u) positions, their relative differences reach the following maximal values: 37.0% and 84.1% (for August 2008 and PDOP ≤8);41.1%and 85.3%(for August 2008 and PDOP ≤4); even 712.4% and 166.2% (for August 2013, PDOP ≤8);and 686.6% and 176.9% (for August 2013 and PDOP ≤ 4),respectively.
On the other hand,as shown in Table 18,there is no significant impact of PDOP mask change on horizontal and vertical position accuracy.
6. Conclusions
When it is about a 116-km-long baseline in the mid-latitude region, with a height difference of approximate 760 m between its endpoints, different satellite elevation cutoff angles in data processing, with a fixed PDOP mask, cause statistically significant inequality of epoch-wise two-way nested ANOVA estimates of variances.This is the case for both the‘far-field’multipath(possibly mixed with a part of a ‘shorter-term’ ionospheric refraction) and also the combined unmodeled effect of tropospheric and ionospheric refraction, generally, no matter what relative coordinate is about.
On the other hand, changing of the PDOP mask, with a fixed satellite elevation cutoff angle,doesn't cause statistically significant inequalityof thementioned type for thecombined unmodeled effect of tropospheric and ionospheric refraction at all.However,contrary to that, it, generally, affects epoch-wise two-way nested ANOVA estimates of variances of the ‘far-field’ multipath (possibly mixed with a part of a‘shorter-term’ionospheric refraction),especially for the summer period and in the case of the coordinates n and u.
As for the impact on horizontal and vertical position accuracy,no matter which PDOP is used,there is a significant influence of satellite elevation cutoff angle change on both epoch-wise horizontal and vertical position accuracy, but only for the summer period, especially when maximal solar activity is present (Table 17). However,PDOP mask change doesn't affect epoch-wise horizontal and vertical position accuracy significantly(Table 18).
In order to achieve maximal positional accuracy,which directly depends on unmodeled effect variances,it is recommended to use the satellite elevation cutoff angle of 20°and PDOP of 4 in postprocessing GPS data,especially those related to the summer period.
Possible directions for further applying the method presented in this study could be implying multi-frequency GNSS measurements from both low- and high-latitude regions, with data collected at ending stations of baselines with different lengths and several height differences between those stations.
Conflicts of interest
The authors declare that there is no conflicts of interest.
Acknowledgements
The authors express gratitude to the former Real Estate Administration of Montenegro for providing the GPS data from the archive used in this study.
杂志排行
Geodesy and Geodynamics的其它文章
- Three-dimensional coseismic deformation of the 2016 MW7.8 Kaikuora, New Zealand earthquake obtained by InSAR and offset measurements
- Interseismic deformation rate of the Haiyuan fault system based on the modified SBAS method
- Delineation of sensitive coastal zone of northern Ramanathapuram coast, Tamilnadu, India, using a GIS approach
- Impact assessment of the seasonal hydrological loading on geodetic movement and seismicity in Nepal Himalaya using GRACE and GNSS measurements
- The Doppler effect induced by earthquakes: A case study of the Wenchuan MS8.0 earthquake
- Three-dimensional gravity inversion based on optimization processing from edge detection
