Spectral Behavior and Flaring Activity of II Peg in the Ultraviolet
2022-09-02Sanad
M.R.Sanad
Astronomy Department,National Research Institute of Astronomy and Geophysics,Helwan,Cairo,Egypt; mrsanad1@yahoo.com
Abstract We have studied the spectral behavior of the II Peg binary system in the ultraviolet band by using International Ultraviolet Explorer (IUE) observations over the period 1979–1993.The ultraviolet observations reveal indication of flare activity in both chromosphere and transition region with their enhanced emission lines.Before and after the flare activity the ultraviolet emission lines show low,intermediate and high flux.The spectral behavior is compared with previous studies.We detect prominent flare activity in 1989,1990 and 1992.Before and after this period there is a gradual clear decrease in the level of activity.The reddening of II Peg was determined from a 2200 Å absorption feature to be E(B−V)=0.10±0.02.We ascertained the average mass loss rate to be ≈1×10⁻⁸ M⊙ yr−1,and an average ultraviolet luminosity to be ≈6×1029 erg s−1.We attributed the spectral variations to a cyclic behavior of the underlying magnetic dynamo and the prominent activity can be interpreted by the model of a two-ribbon flare.
Key words: line: profiles–magnetic fields–stars: activity–stars: flare–ultraviolet: stars
1.Introduction
RS Canum Venaticorum (RS CVn) variable stars are active chromospheric binary systems with large starspots,intense chromospheric plages,coronal X-ray emission and microwave emissions,as well as enhanced flares in all wavelengths from optical,radio,ultraviolet (UV) and X-ray regions (Sanad et al.2021;Hall1976;Tautvaisiene &Barisevicius2012).
II Peg is an active rotating single line spectroscopic binary system with an orbital period of 6.7 days (Ajaz et al.2018).II Peg was distinguished as a BY Dra variable system but Rucinski(1977)indicated that it was an RS CVn variable.The binary system consists of II Peg A,a cool subgiant orange K type star that has started to expand and evolve off the main sequence(Berdyugina et al.1998).Starspots cover nearly 40%of the surface of II Peg A and produce strong flares observed at all wavelengths (Schwartz et al.1981;Covino et al.2000)and in 2005 a super flare was observed by the Swift Gamma-Ray Burst mission.It was the biggest observed stellar flare and more than a hundred million times larger than a typical solar flare(Osten et al.2007)and its companion(II Peg B)was very close to being observed directly.It is a red dwarf M type main sequence star (Berdyugina et al.1998).
Rodono et al.(1986,1987) presented both optical and UV spectroscopy taken in 1981.The UV observations revealed a variation with phase.This was explained as the rotation of an active region near the surface of II Peg and correlated with the photospheric spots.Byrne et al.(1987) analyzed UV spectra and showed that the conditions in the active region were attributed to a complex of activated magnetic loops.
Doyle et al.(1989)presented UV spectroscopic observations of II Peg in 1983 and showed evidence for flare activity.They isolated the flare radiation and derived electron pressures from intersystem line flux ratios and estimated the total power of flare output over the whole atmosphere and in addition they derived the flaring volumes and estimated a surface filling factor for flares.
In this paper we discuss the spectral behavior of the II Peg binary system by using UV data obtained from the International Ultraviolet Explorer (IUE).The important observational characteristics in our investigation are that the fluxes of emission lines in UV have approximately similar spectral behavior,indicating a common origination source in the transition region and chromosphere of II Peg system and the activity is confirmed with UV,visible and X-ray data.
We discuss the UV observations in Section2,Section3reveals the results and discussions of the procedure for estimating the reddening,the spectral behavior of line fluxes in the emitting source and the calculations of UV luminosity and the rate of mass loss,and Section4provides the conclusions of the investigation.
2.IUE Observations and Data Reduction
The IUE spectra with low resolution have been obtained from the MAST IUE system through its principal center athttps://archive.stsci.edu/iue/.A detailed description of the UV low-resolution data is found in Rodriguez-Pascual et al.(1999) and Gonzalez-Riestra et al.(2001).The observational data were processed using the standard IUEDAC IDL software for the processing of spectra.We referenced the spectra to theorbital phase of the II Peg system using the ephemeris of Ajaz et al.(2018).

Table1lists the UV observations for II Peg with low resolution.The spectral data were inspected carefully in the 1150–1950 Å region to recognize and reject underexposed or overexposed data.The observations of IUE targeting II Peg cover nearly all orbital phases.It is known that to calculate the phase we need both the starting point of the cycle and the period by applying the known relation
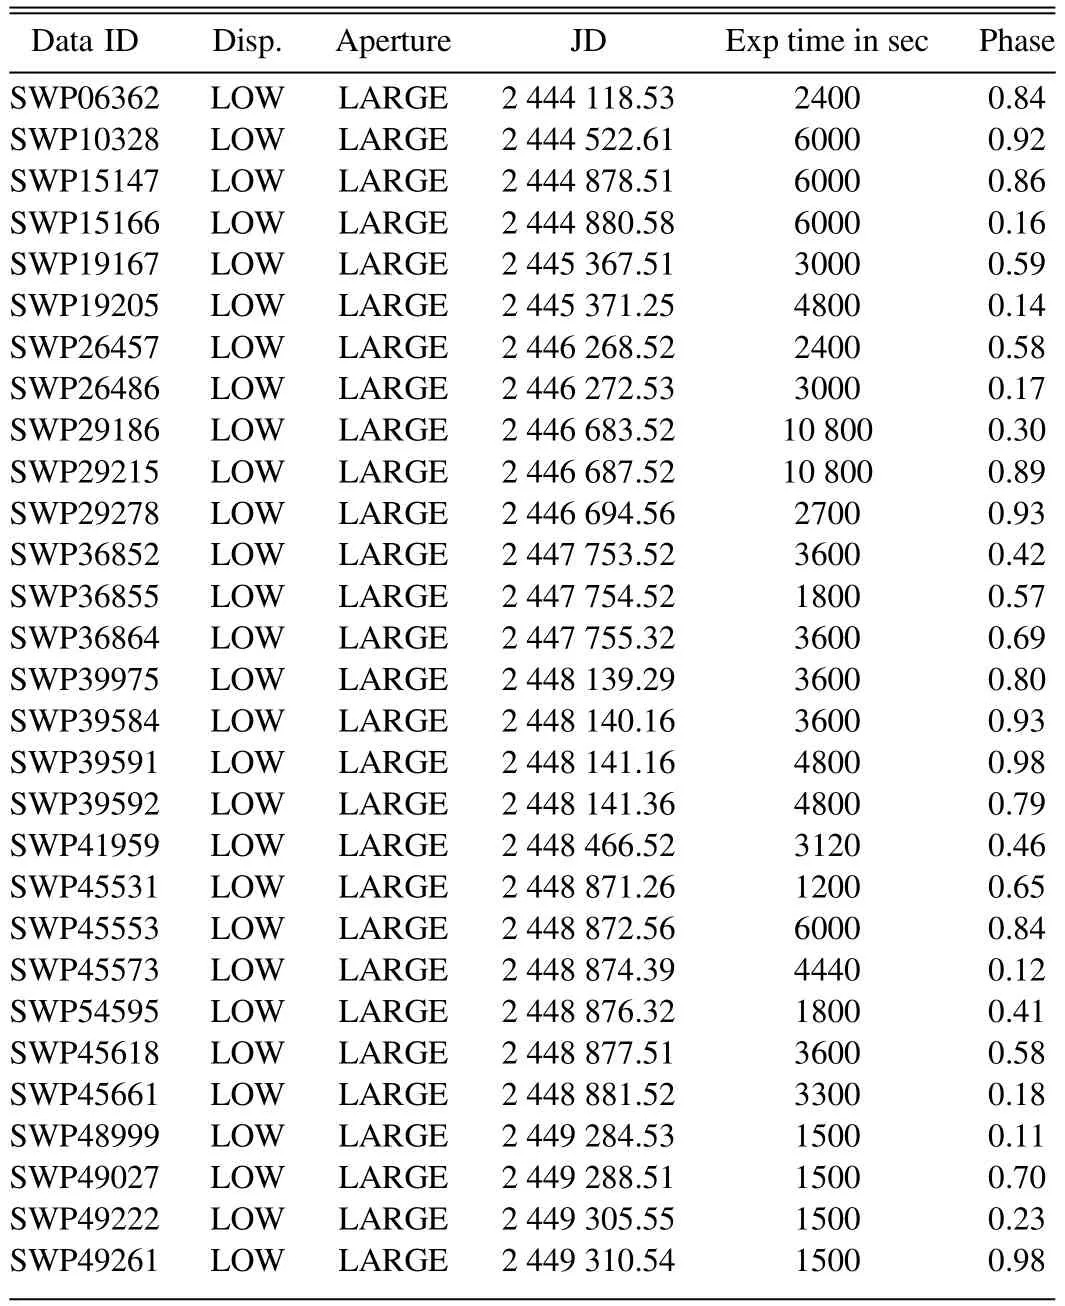
Table 1Journal of IUE Observations of II Peg

In our study the starting point is the first observation of IUE data (SWP06362) representing zero phase and the period as taken from Ajaz (2018).As is well known,any two phases differing by an integer are the same.The positions of the binary components II Peg A and II Peg B at different phases,say 0 or 0.5,will lead to and depend on the values of their fluxes at the beginning of the cycle and half cycle as the orbital motion along the line of sight alternates toward and away,i.e.,at the beginning of the cycle the flux is high and at the half cycle the flux is low and so on with a repeating pattern representing periodic variations for all phases.
Some examples of spectral lines are given in Figure1,revealing the changes of line fluxes at different times and the flaring activity.The emission lines originate in the chromosphere and transition region of the II Peg A star.Spectral lines with different states of ionization up to NV 1240 Å,Si IV 1400 Å and C IV 1550 Å have been found in II Peg,and the emission is suitable at all phases.
3.Results and Discussions
3.1.Reddening Determination of II Peg
The calculation of reddening of II Peg depends on using a suitable data set for Short Wavelength spectra with resolution 6 Å in the wavelengths between 1150 and 1950 Å and Long Wavelength spectra with the same resolution in the wavelengths between 2000 and 3000 Å.The Short Wavelength spectra are binned in 15 Å bins and 25 Å bins for Long Wavelength data.Both data sets give the spectral shape of a reddened star,with its distinguished depression at 2200 Å.The following observations were selected for our determination of the reddening,(SWP06263-LWR05058),(SWP10328-LWR08991)and (SWP15151 -LWR09002),leading to the best spectrum suitable for our estimation of the value of reddening.
The best value is determined by visual inspection of the plots for the best fit to the absorption feature at 2200 Å representing the best agreement between standard theoretical (dashed line)values and observations (Raymond J.,2017,private communication).The most suitable value of the reddening for II Peg isE(B−V)=0.10±0.02 as displayed in Figure2.
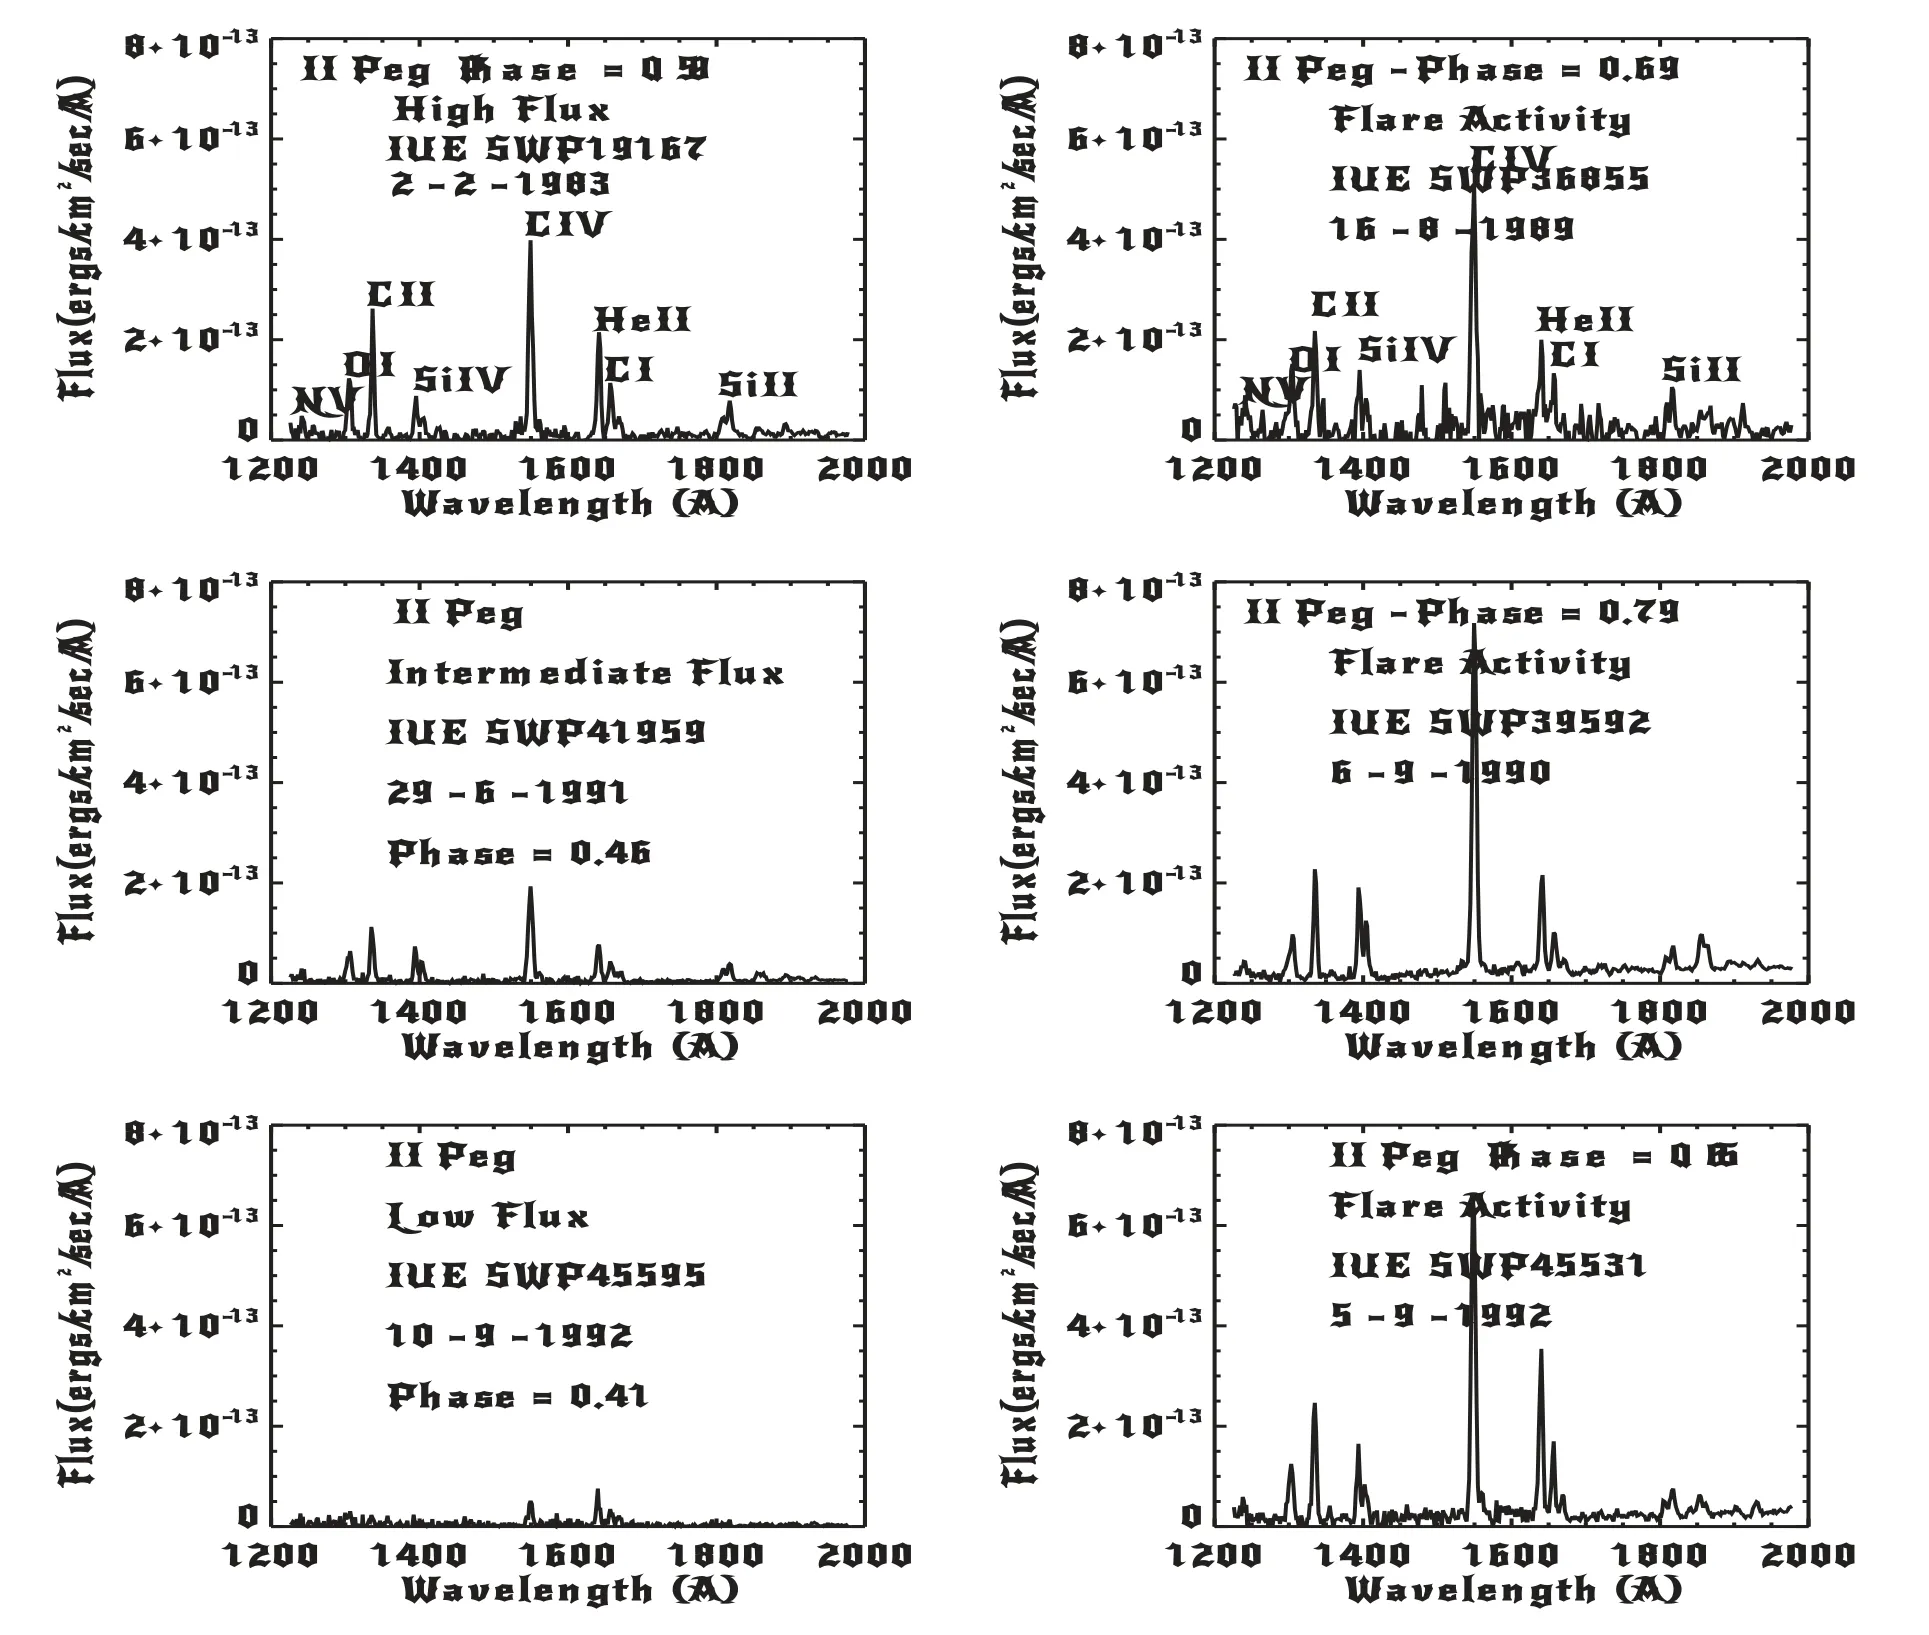
Figure 1.IUE spectrum of II Peg with high,intermediate and low flux at phases 0.59,0.46 and 0.41 in the left-hand panels and flaring activity in the right-hand panels.
3.2.Ultraviolet Behavior of Spectral Lines and Their Source
The II Peg binary system shows some UV emission lines observed with the(IUE)Short Wavelength camera such as NV(1240 Å),O I (1306 Å),C II (1335 Å),S IV (1400 Å) and C IV(1550 Å),He II(1640 Å),C I(1657 Å),S II(1808 Å),and Si III](1892 Å).
The O I,Si IV,C IV and C I are resonance emission lines that are collisionally controlled by the physical conditions of plasma in the active chromosphere.The He II emission line is a recombination line and the Si III emission line is a collisionally excited line.These emission lines originate in the chromosphere and transition region of the primary star,K2 IV,previously discussed by Andrews et al.(1988);Doyle et al.(1989);Sarro &Byrne (2000).
The similar behavior of studied emission lines (O I,C II &C IV &He II,C I) suggests that they have the same source of origination,the active chromosphere of the primary object.The line fluxes are treated as the integrated area included in the emission region above the continuum close to the wings of the spectral line and calculated with the method of Gaussian profile fitting.
Figure3depicts the behavior of line fluxes with orbital phase for the spectral lines O I,C II,C IV,He II and C I.The fluxes of spectral lines correlate and vary with orbital phase with different values on short times of a few hours and long times of months to years for the period 1979–1993.The fluxes of spectral lines vary by nearly a factor between two and three.The fluxes increase at phases around 0.2,0.45,0.6,0.7 and 0.9 and decrease at phases around 0.3,0.4,0.55 and 0.85.
Tables2,3,4,5,6show the line fluxes and flaring values of O I,C II,C IV,He II and C I emission lines for II Peg respectively.We notice that the occurrence of flaring activity of II Peg is not periodic as with UX Ari (Sanad et al.2021).The flux increases of studied emission lines reached about six and nine times the quiescent values and the activity of all mentioned emission lines is around phases 0.59 and 0.92 above the normal spectral behavior as shown in Figure3.

Table 2Line Fluxes and UV Luminosities at Different states of O I
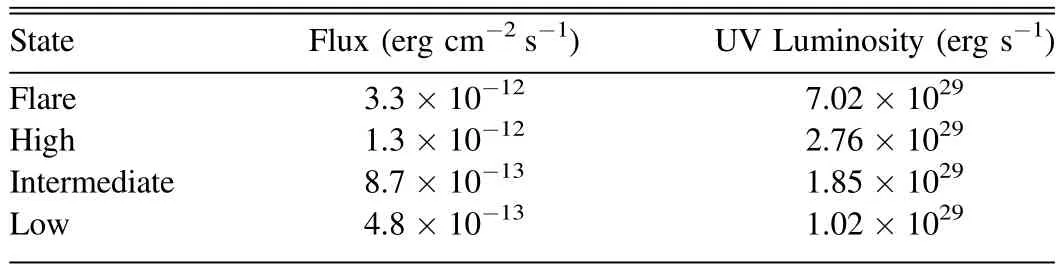
Table 3Values of Line Flux and UV Luminosities at Different States of C II
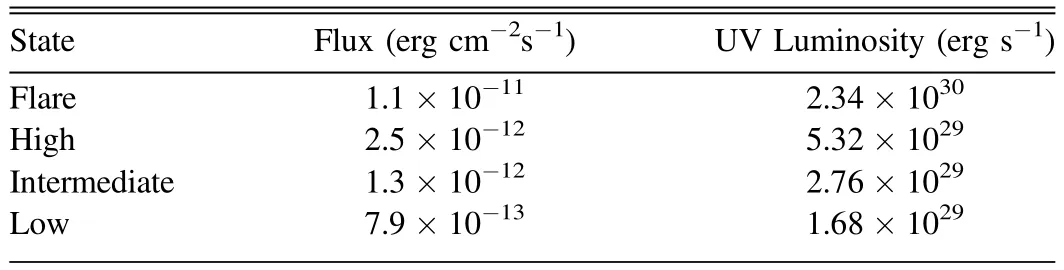
Table 4Values of Line Flux and UV Luminosities at Different States of C IV
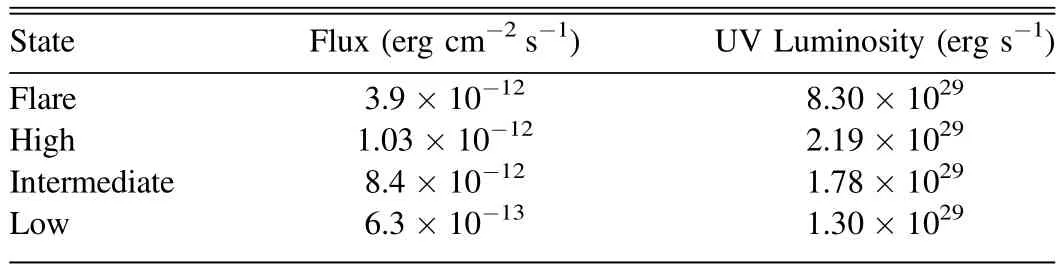
Table 5Values of Line Flux and UV Luminosities at Different States of He II

Table 6Values of Line Flux and UV Luminosities at Different States of C I
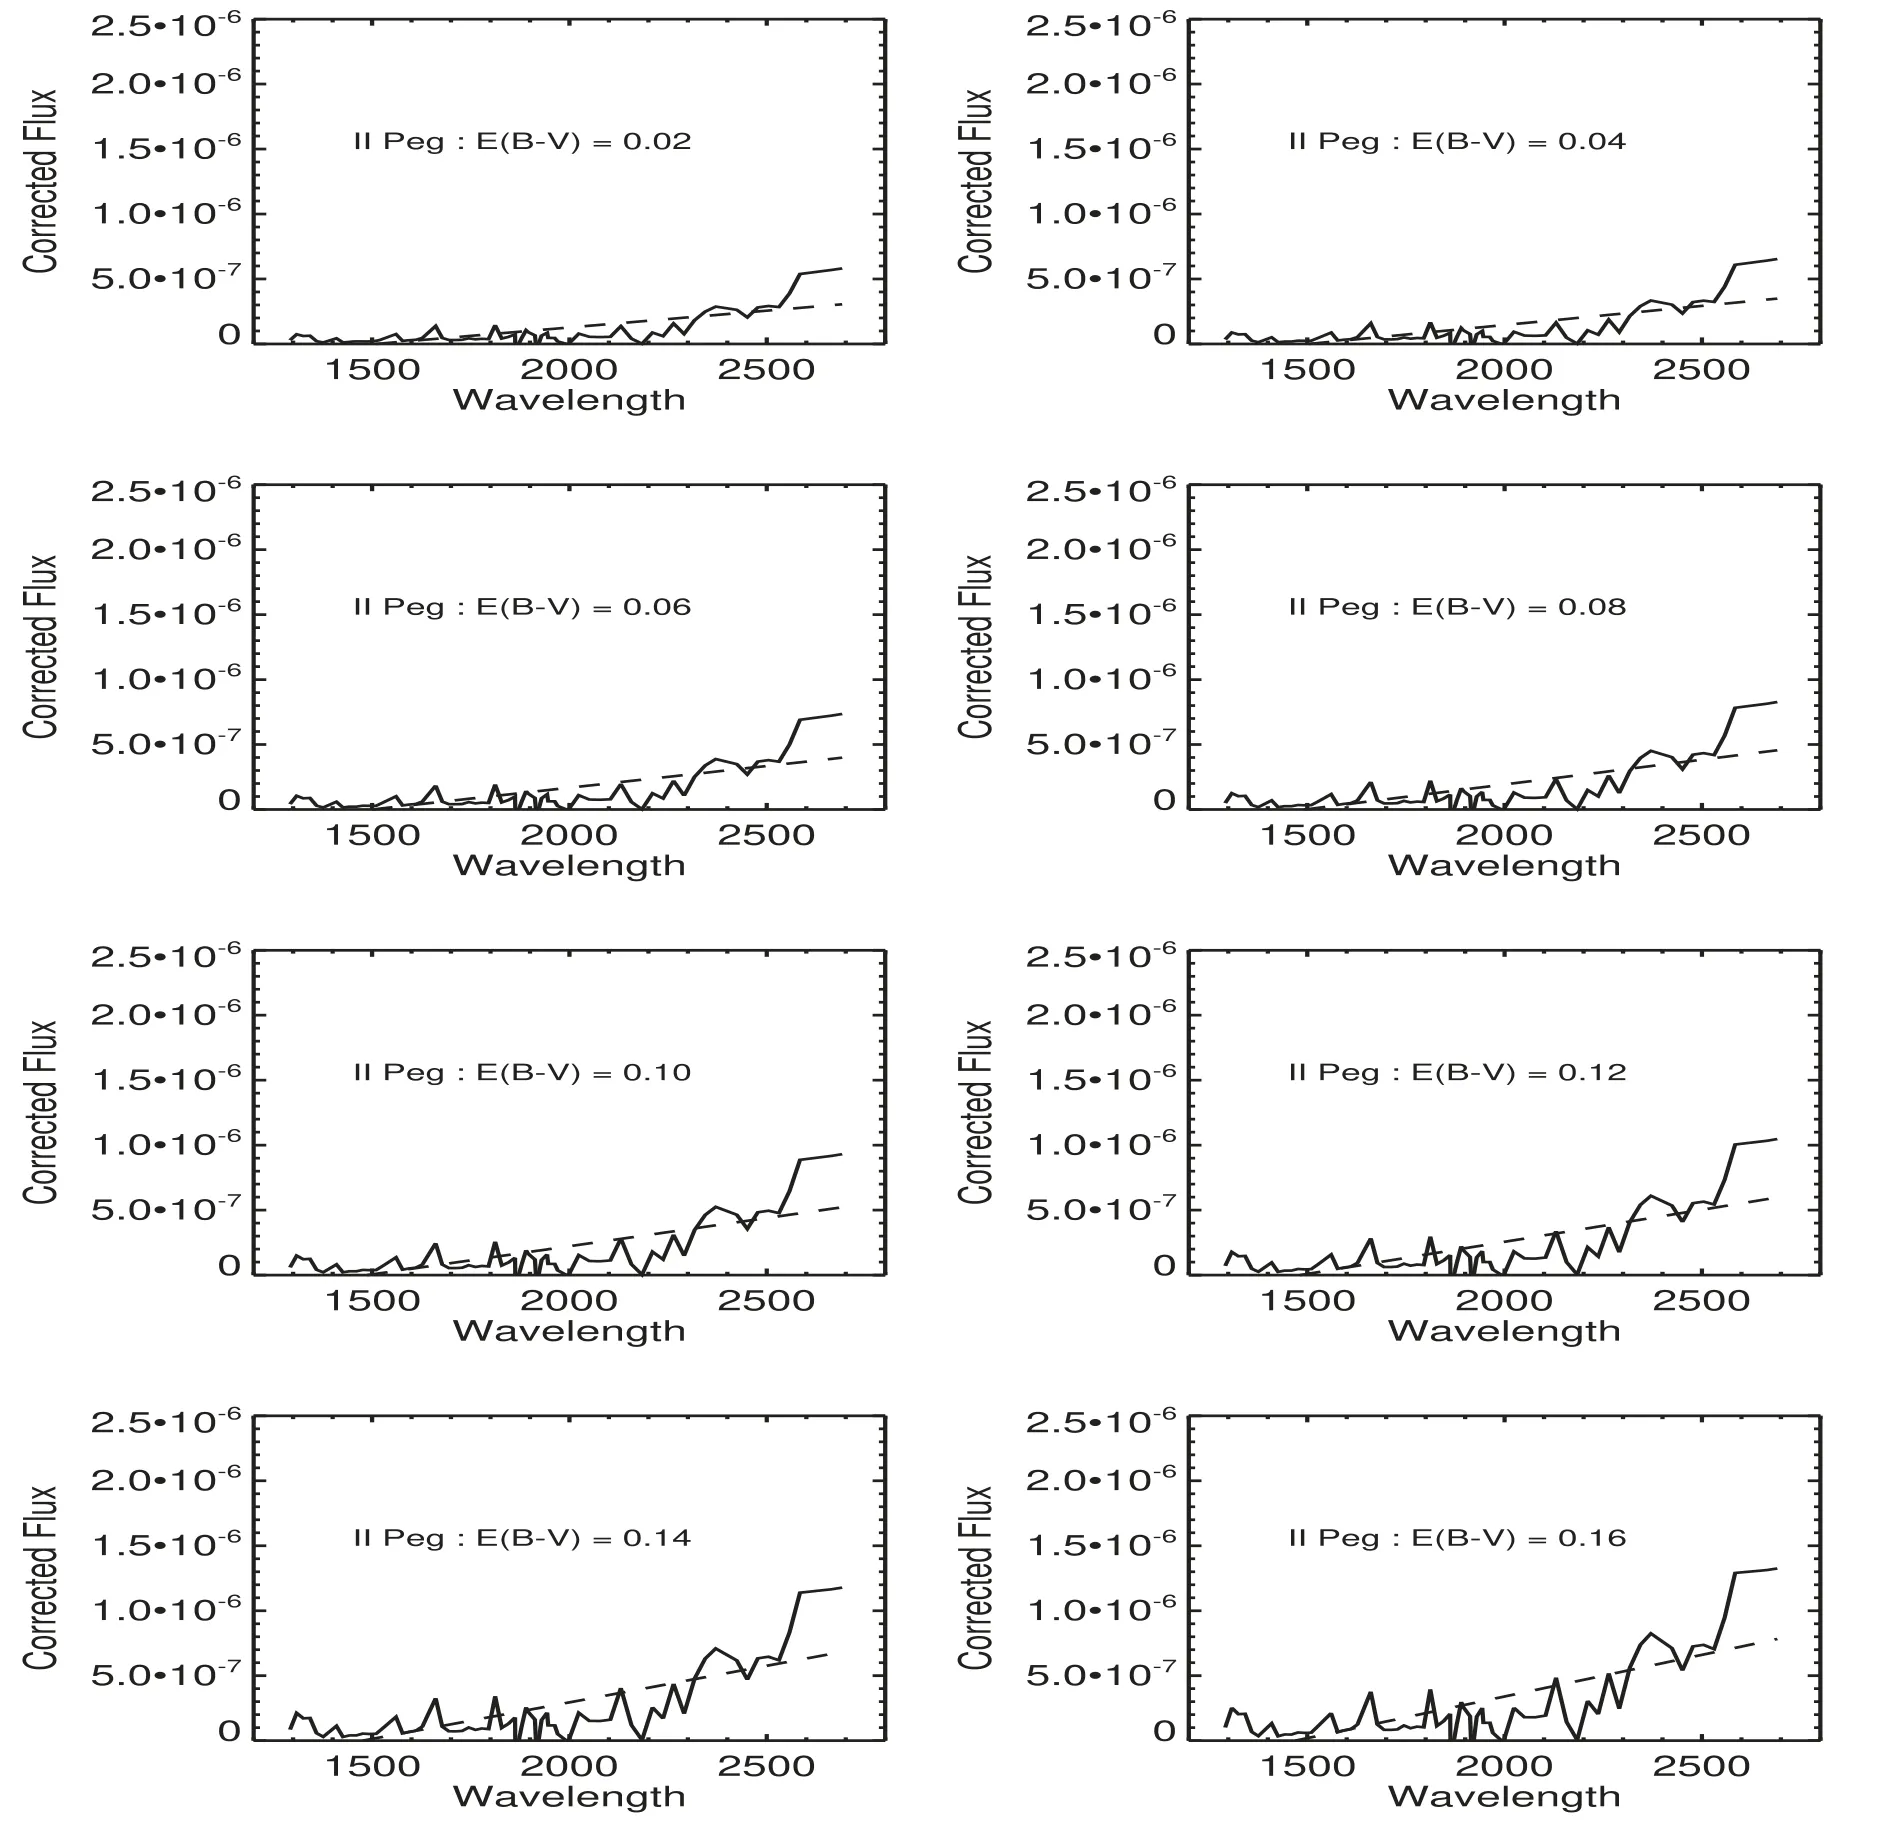
Figure 2.Reddening determination of the II Peg binary system.
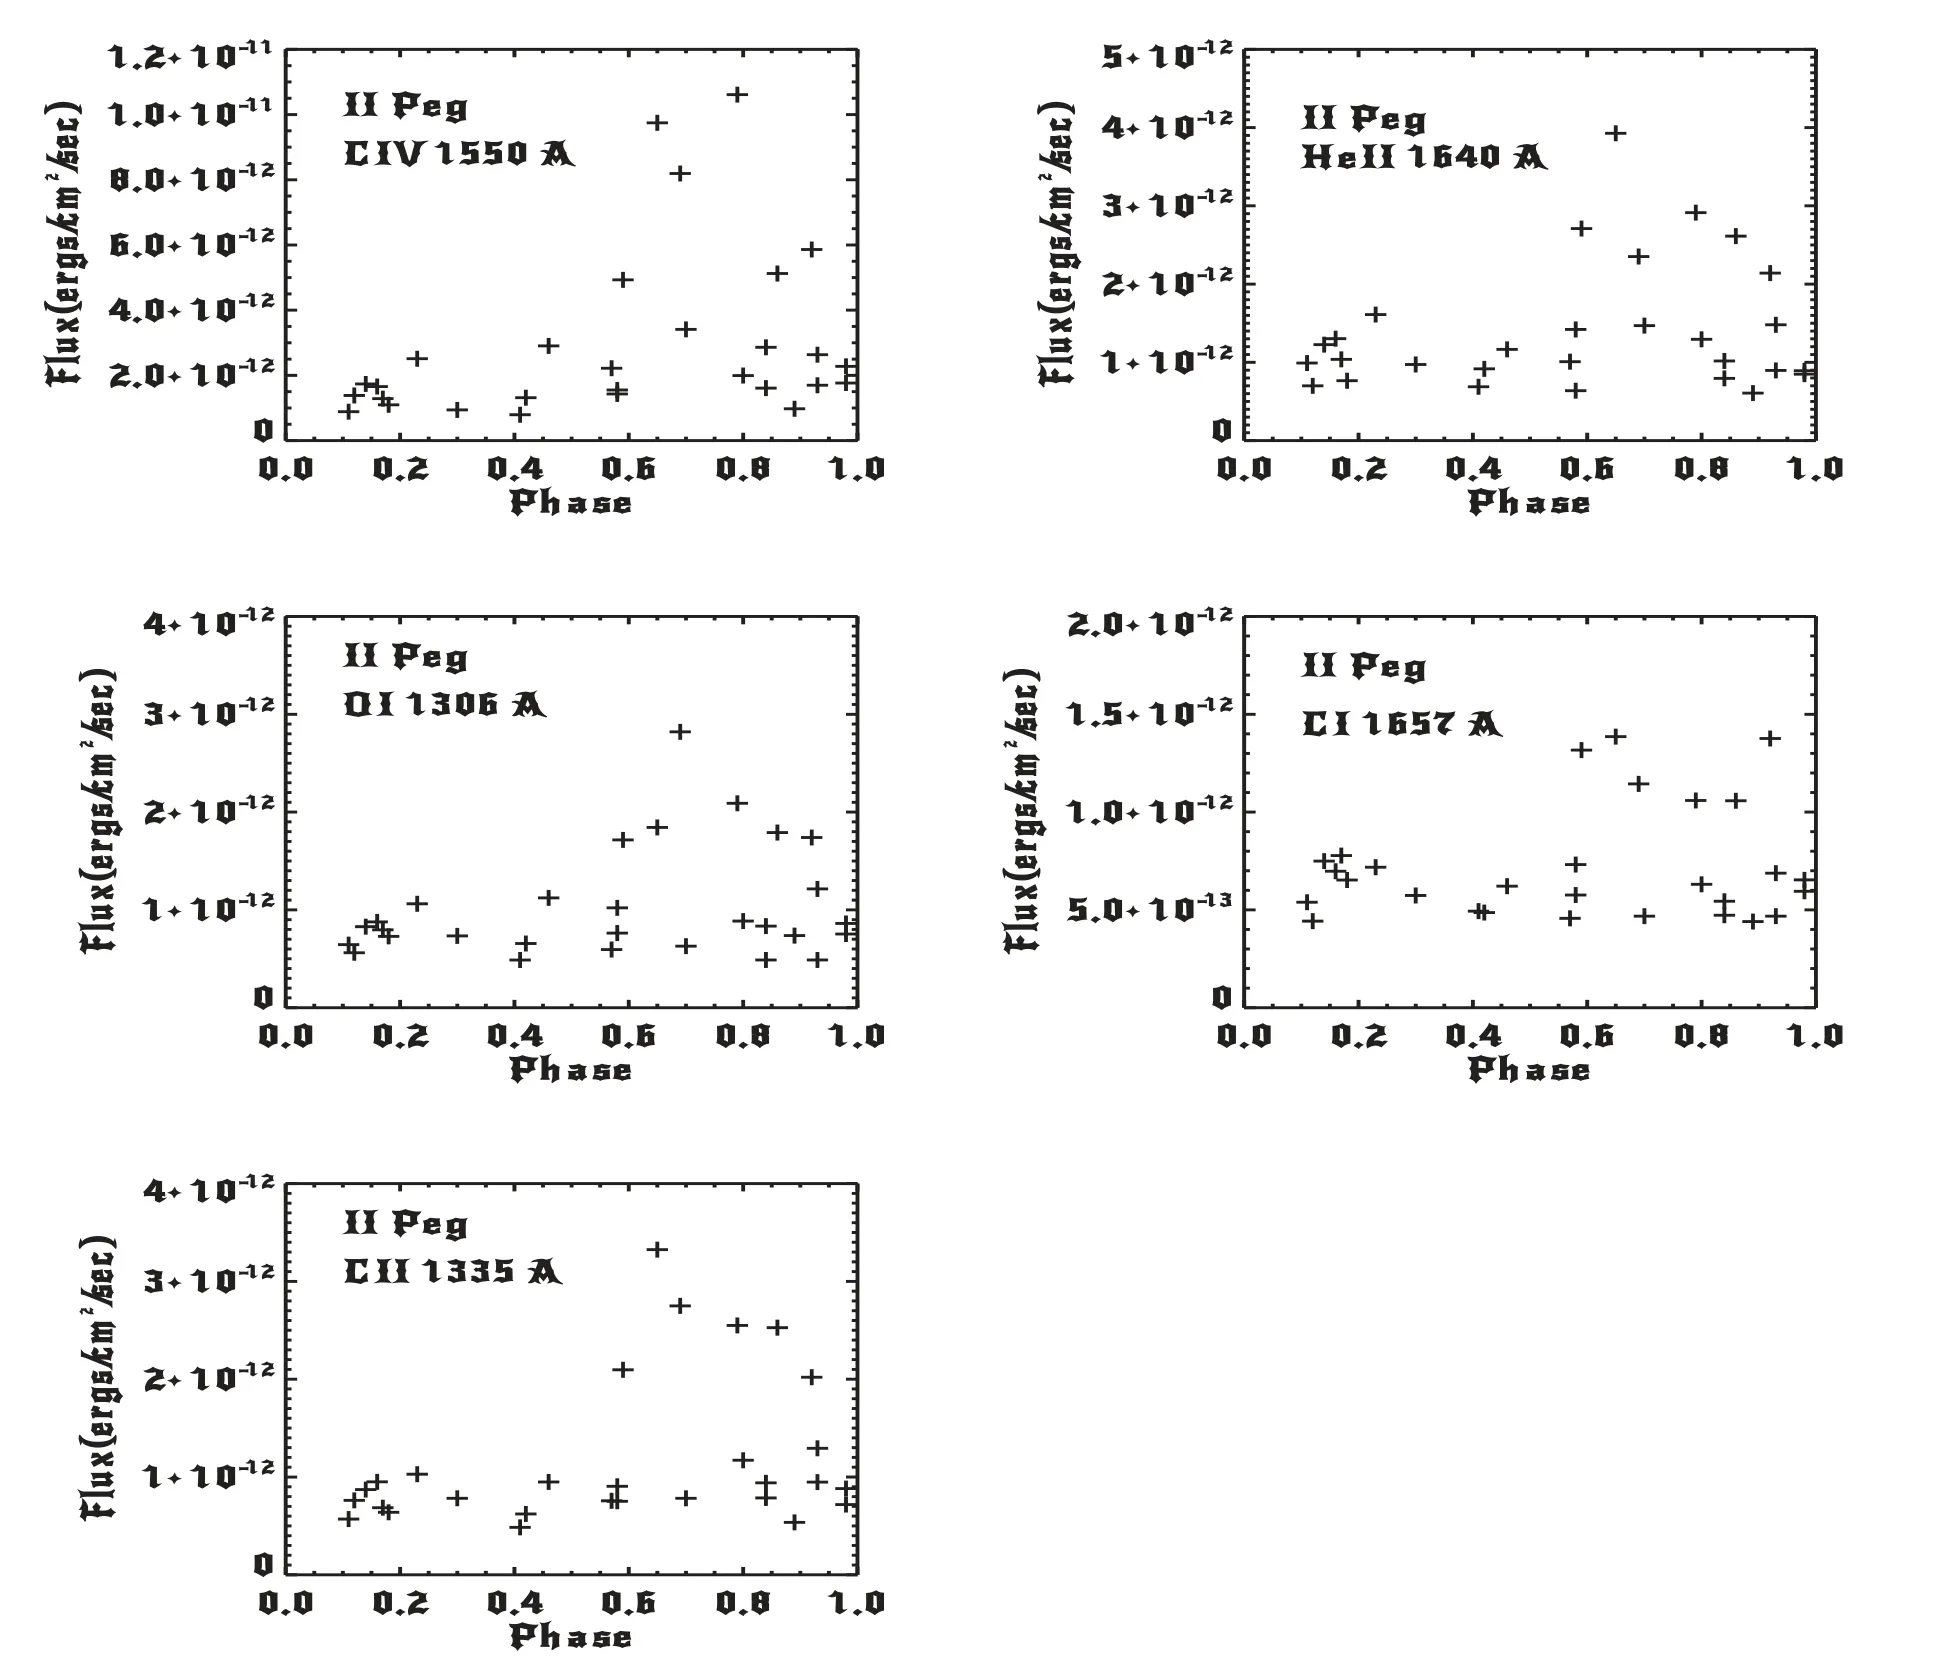
Figure 3.Variations of the O I,C II,C IV,He II and C I line fluxes with phase.
Andrews et al.(1988) studied the spectral behavior and flaring activity of II Peg for observations taken from IUE in 1983.They detected two flares and found that the increase in fluxes of flares reached about six times the quiescent value and the flares occurred at phases around 0.59 and 0.86.They reported that the normal integrated line fluxes are approximately constant.
Sarro&Byrne(2000)investigated the spectral behavior of II Peg over the period 1979–1992 and concentrated mainly on the quiescent states of emission lines (C II,C IV,He II).They detected two flares of II Peg and compared them with the mean quiescent spectrum and found a dramatic increase in line fluxes.
The spectral behavior of our studied spectral lines can be recognized as follows: The atmosphere of the primary object K2 IV has strong magnetic fields leading to its non-radiative heating.The magnetic activity in stars is analogous to that observed with the Sun.Magnetic fields push hot particles upward leading to dark spots in the outer parts and reconnect and produce particles and magnetic energy as flares.Some energy flares are believed to be a main source of heating the outer layers of the chromosphere.The existence of significant magnetic structures on the surface of the primary star has been confirmed by Zeeman-Doppler imaging (Kochukhov et al.2009;Carroll et al.2009).Though the relation between the magnetic fields and the dark spots is not yet evident,the spot activity is interpreted as a result of a magnetic dynamo working in the convective zone.The magnetic activity is variable with time (Messina2008).
The fluxes of emission lines indicate clear evidence of active regions in the chromosphere of II Peg.These active areas are close to the spot group with short term changes in the spot configuration.The increase in the fluxes of UV spectral lines indicates a hot area overlying a cool spot(Kaluzny1984;Rodono et al.1986;Byrne et al.1987;Andrews et al.1988).
The current UV observations with flaring activity can be explained by the model of a two ribbon flare in which the ribbons move quietly away as the flare increases.A prominence is often detected before the flare and vanishes at the beginning of the flare.The two ribbons form on either side of the prominence.As the ribbons move away,loop structures are formed connecting one ribbon to the other,known as post flare loops,indicating that the connecting magnetic field lines accelerate particles to high energy and convert the magnetic energy into heat and kinetic energy,which permit the coronal magnetic field to relax into a lower energy state (Doyle et al.1989;Mathioudakis et al.2003).
A two-ribbon flare is connected with the existence of a filament in an unstable active area.The filament can be considered as a current wire with its associated magnetic field.The large inertia of the photospheric plasma prevents the magnetic field from penetrating through it,so surface currents will be produced and as a result the magnetic field will be changed.The filament is adjusted by an equilibrium force.The motions of the photosphericlayers result in an increase of filament current and the filament will move upward until at some critical height,the equilibrium is lost and a two-ribbon flare begins.The maximum storage of energy occurs when the filament is situated between the two stars (Van Tend &Kuperus1978;Van den Oord1988;Doyle et al.1989).
In summary: a flare requires a reconnection area and a reconnection area requires a current sheet and a current sheet requires an eruption of a rope of magnetic flux.The rope of magnetic flux representing a collection of magnetic field lines covering the central axis is a significant structural factor in the process of reconnection eruption (Cheng et al.2011).During the process of flare the electrons are accelerated and stream down along the loops of a flare,heating the chromosphere and generating significant flare emission at the footpoints which form two ribbons.The UV ribbons with flare fluxes can be produced either by heating the energetic electrons accelerated in flares or by impact excitations by energetic electrons as nonthermal excitation or by thermal conduction along loops(Forbes &Priest1995;Fletcher2002).
3.3.Ultraviolet Luminosity and the Rate of Mass Loss
The UV luminosity in the selected lines is calculated by using the following equation

whereFis the integrated flux value anddis the distance to the star,42 pc (Osten et al.2007).For II Peg,by using line fluxes of O I,C II,C IV,He II and C I,we found the UV luminosities for the five spectral lines in different states as listed in the tables.
The rate of mass loss is calculated by applying the following equation (Nieuwenhuijzen &de Jager)

where the mass of the primary K star isM≈0.8M⊙(Osten et al.2007) and it has a radius ofR≈3R⊙(Berdyugina et al.1998).
We found the rate of mass loss ≈1×10⁻⁸M⊙yr−1.
4.Conclusions
The IUE observations of the II Peg binary system revealed similar behavior of five emission lines (O I,C II,C IV,He II &C I) confirming that they originated in the same emitting area(the chromosphere and transition region of the K star).The emitting source is distinguished by variations of the magnetic activity that are responsible for the observed phase-dependent variations in the line fluxes.
The flaring activity of II Peg is not periodic as with similar binary systems like UX Ari and the increment in fluxes of studied emission lines reaches about six and nine times the quiescent values,and the activity of all mentioned emission lines is around certain phases as reported in previous studies.
The estimated physical parameters (luminosity in UV,rate of mass loss) confirmed that the UV spectral lines originated in the active chromosphere and transition region of the primary star.
The variations of spectral behavior with orbital phase support the model of a two ribbon flare where the reconnection of magnetic field lines that accelerate particles to high energy and convert the magnetic energy into heat and kinetic energy has permitted the coronal magnetic field to relax into a lower energy state.
杂志排行

Research in Astronomy and Astrophysics的其它文章
- Length Scale of Photospheric Granules in Solar Active Regions
- About 300 days Optical Quasi-periodic Oscillations in the Long-term Light Curves of the Blazar PKS2155-304
- Constraining Mass of M31 Combing Kinematics of Stars,Planetary Nebulae and Globular clusters
- The First Photometric Study of W UMa Binary System V1833 Ori
- On the Jet Structures of GRB 050820A and GRB 070125
- Solar Flare Forecast Model Based on Resampling and Fusion Method