About 300 days Optical Quasi-periodic Oscillations in the Long-term Light Curves of the Blazar PKS2155-304
2022-09-02QiZhengXueGuangZhangandQiRongYuan
Qi Zheng,Xue-Guang Zhang,and Qi-Rong Yuan
School of Physics and Technology,Nanjing Normal University,Nanjing 210023,China;211002011@njnu.edu.cn,xgzhang@njnu.edu.cn,yuanqirong@njnu.edu.cn
Abstract Based on the long-term light curves collected from the Catalina Sky Survey (CSS) (from 2005 to 2013) and the All-Sky Automated Survey for Supernovae (ASAS-SN) (from 2014 to 2018),optical quasi-periodic oscillations(QPOs) about 300 days can be well determined in the well-known blazar PKS 2155-304 through four different methods: the generalized Lomb-Scargle periodogram (GLSP) method,the weighted wavelet Z-transform technique,the epoch-folded method and the redfit method.The GLSP determined significance level for the periodicity is higher than 99.9999%based on a false alarm probability.The redfit provided confidence level for the periodicity is higher than 99% in the ASAS-SN light curve,after considering the effects of red noise.Based on continuous autoregressive process created artificial light curves,the probability of detecting fake QPOs is lower than 0.8%.The determined optical periodicity of 300 days from the CSS and ASAS-SN light curves is well consistent with the reported optical periodicity in the literature.Moreover,three possible models are discussed to explain the optical QPOs in PKS 2155-304:the relativistic frame-dragging effect,the binary black hole model and the jet precession model.
Key words: (galaxies:) BL Lacertae objects: individual (PKS 2155-304)–galaxies: active–(galaxies:) quasars:supermassive black holes
1.Introduction
PKS 2155-304(z=0.116)(Aharonian et al.2009)is one of the best known blazars and one of the brightest objects from the UV to TeV energies in the southern sky(Carini&Miller1992;Foschini et al.2007).With the Parkes survey,PKS 2155-304 has been observed in the radio band (Shimmins &Bolton1974).Using HEAo-1,Schwartz et al.(1979) completed its first X-ray observations.Due to its strong and variable X-ray emissions,it was classified as a BL Lac object (Zhang et al.2021).PKS 2155-304 was first identified as a TeV blazar by the detection of VHE gamma-rays by the Durham MK 6 telescopes (Chadwick et al.1999),and then was confirmed by the H.E.S.S.(Aharonian et al.2005).PKS 2155-304 has been observed on diverse timescales over a wide range of frequencies from radio to VHE γ-rays,and has shown rapid and strong variability (Miller &McAlister1983;Fan &Lin2000).Generally,blazar variability timescale (tvar) is divided into three classes (Gupta et al.2004;Agarwal et al.2019): microvariability (intra-night variability or intra-day variability,IDV;tvar∼less than a day) (Wagner &Witzel1995),short-term variability (STV;tvar∼from days to few months) and long-term variability (LTV;tvar∼ from months to several years) (Pandey et al.2020).Through AGN variability,we can obtain information with respect to their nature.It is important for quasar modeling (Fan et al.1998).Optical variability of PKS 2155-304 has been studied for many years.PKS 2155-304 has obvious IDV (Paltani et al.1997;Tommasi et al.2001;Dominici et al.2006),STV (Carini &Miller1992;Pesce et al.1997) and LTV (Kastendieck et al.2011) in the optical band,but it also can stay in a completely stable state for one week (Heidt et al.1997).In addition,the optical variability is related to X-ray(Dominici et al.2004)and NIR bands (Li et al.2018).The main focus of this paper is long-term variability in the opticalV-band in PKS 2155-304.
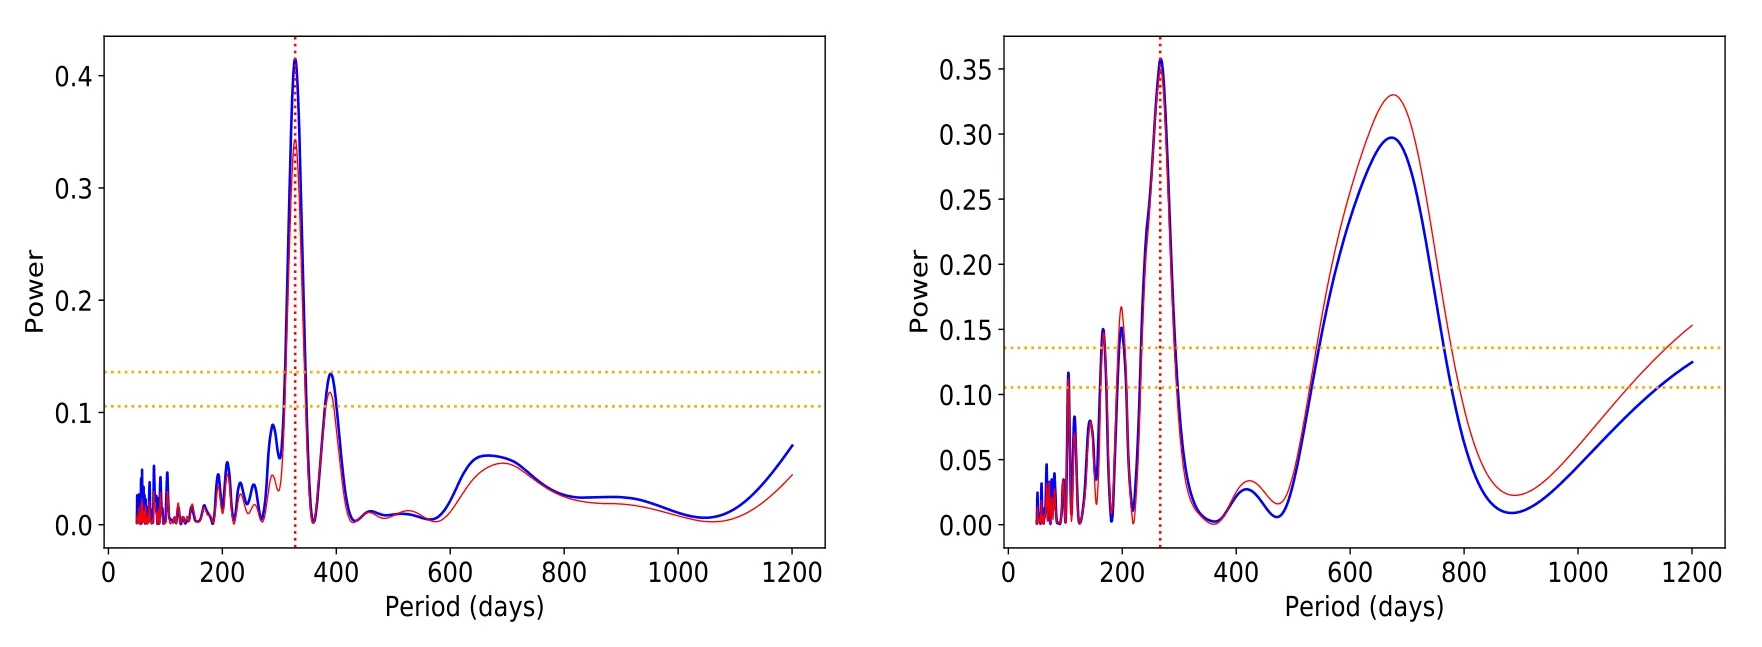
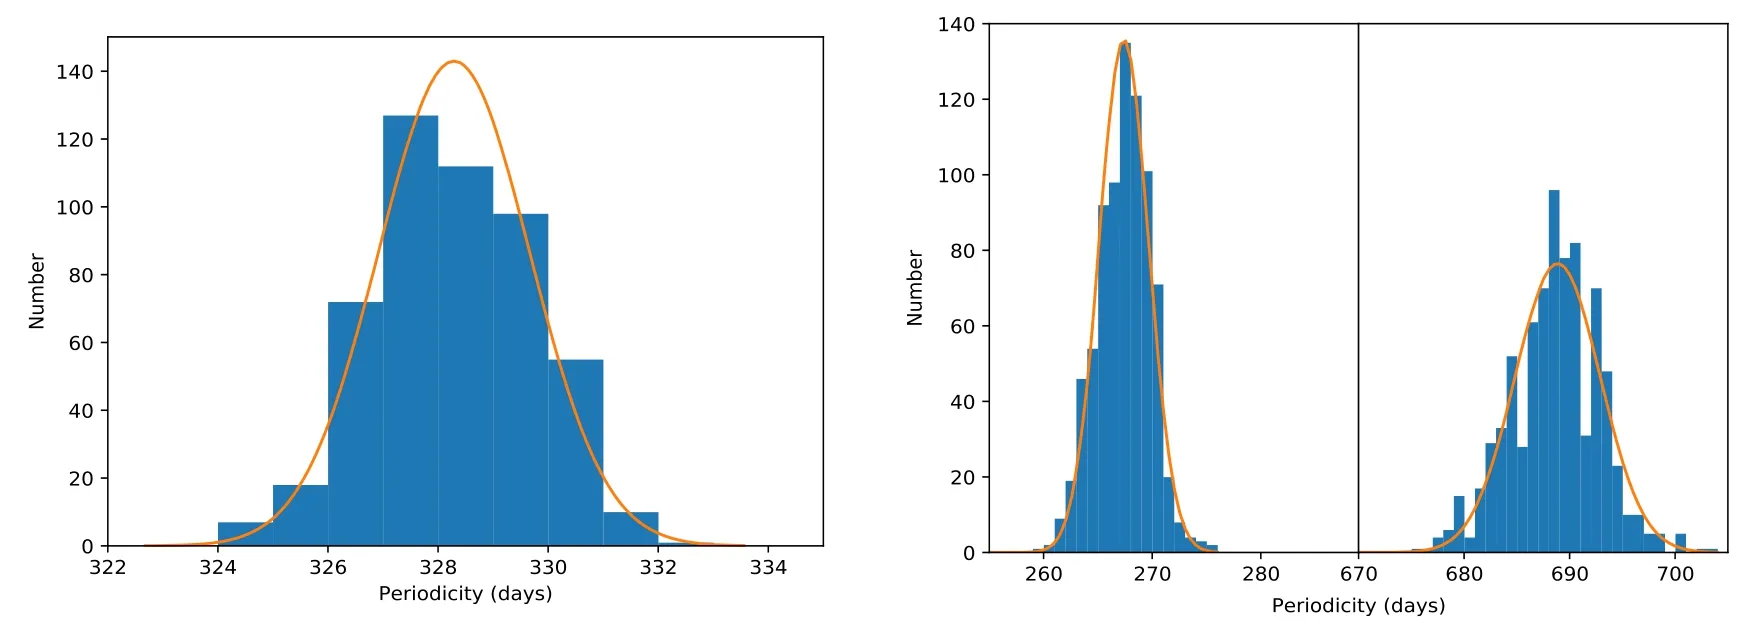
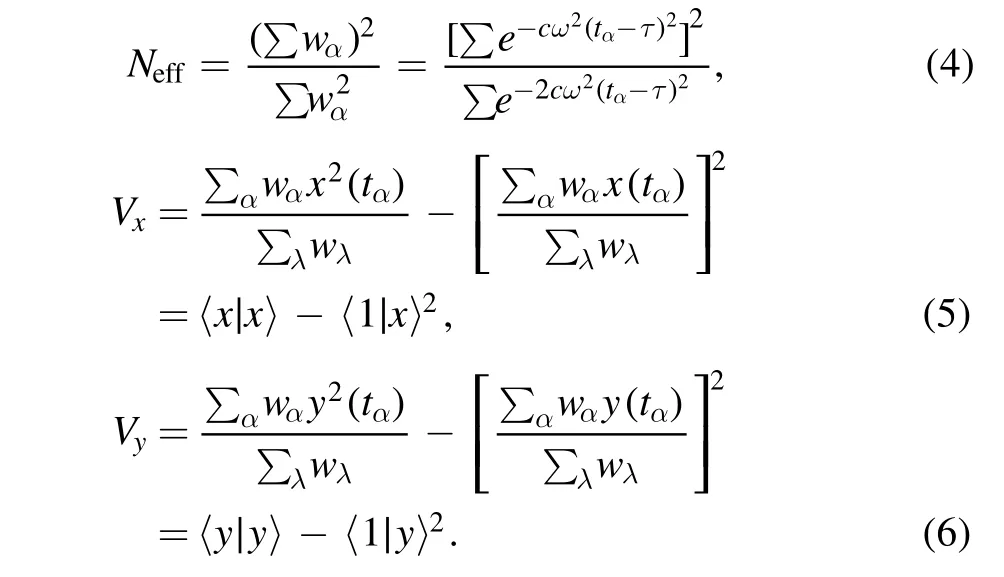
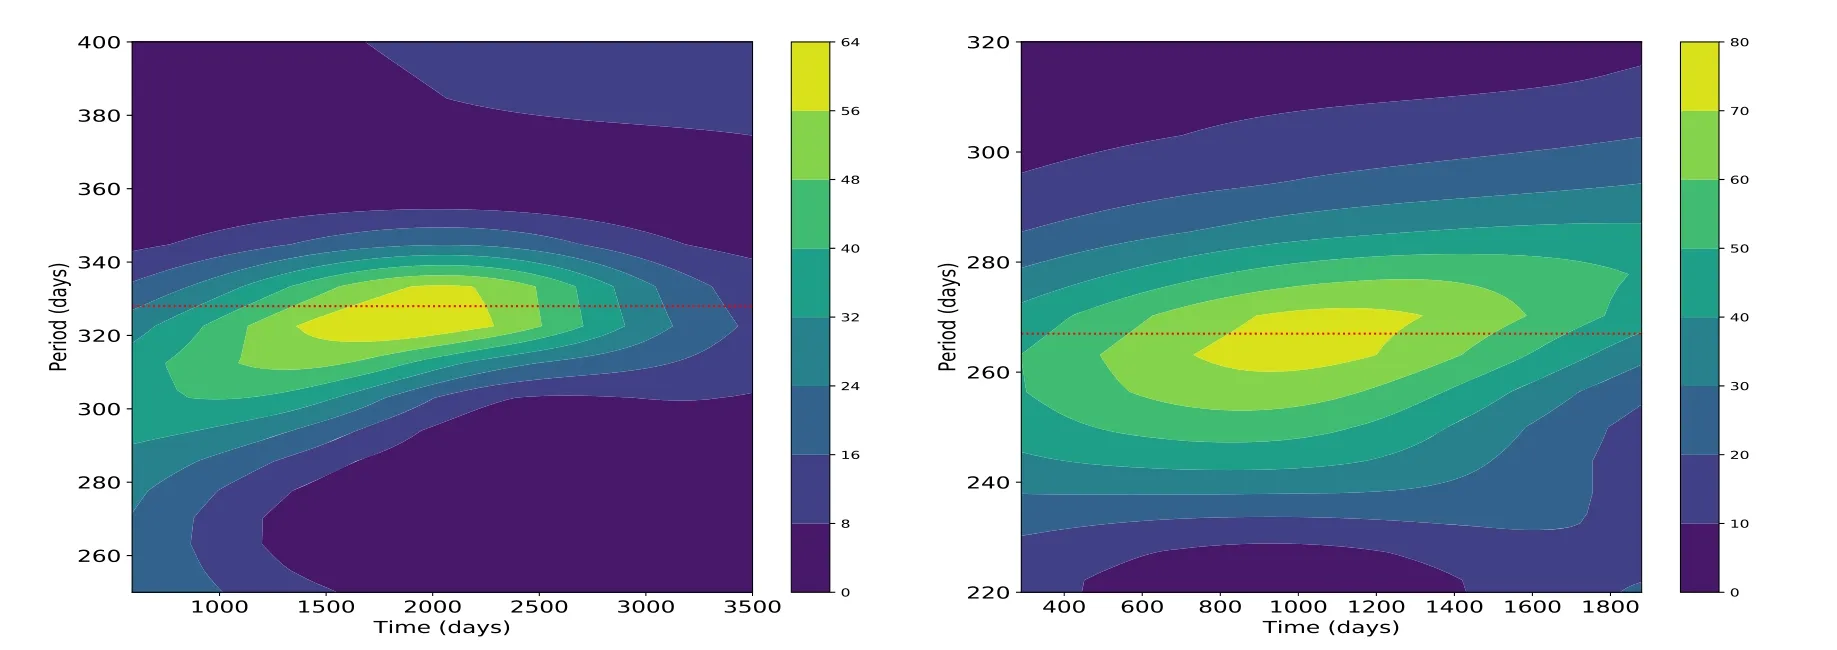
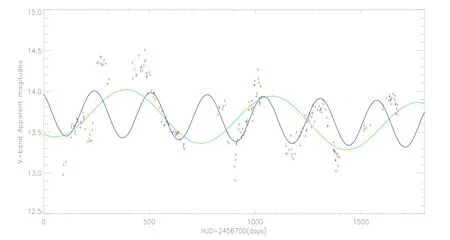
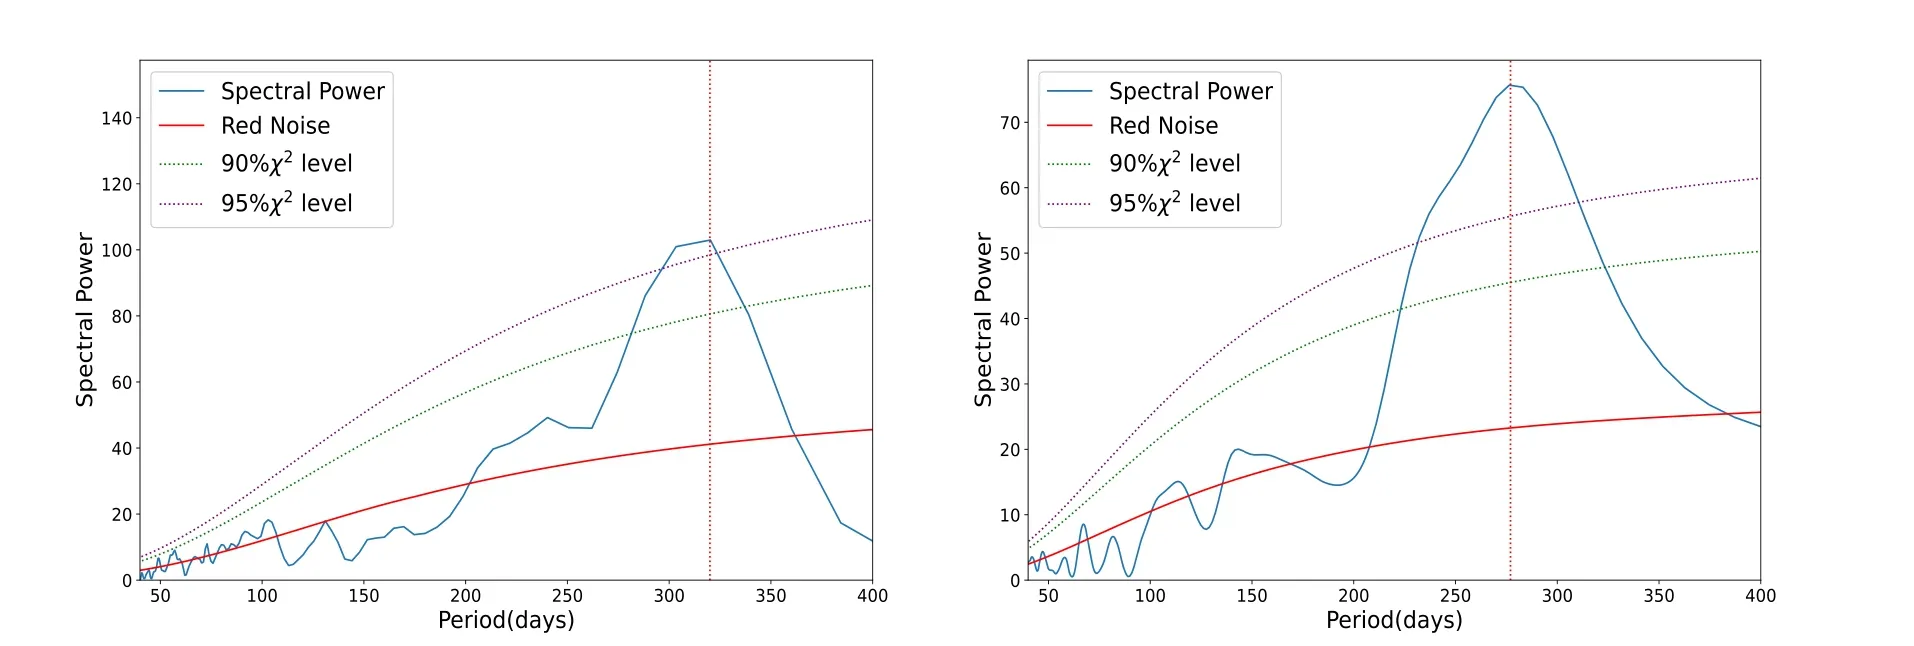
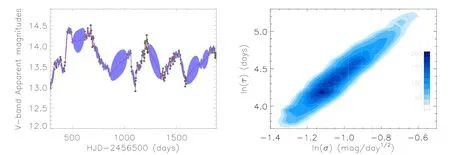
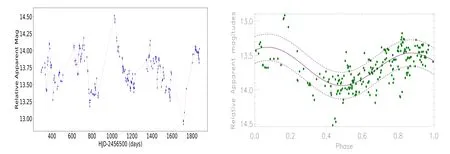
The quasi-periodic oscillations (QPOs) in optical band have been found in PKS 2155-304.In theV-band,with data from 1970 onwards,Fan &Lin (2000) reported QPOs ofT∼4.2 yr andT∼7.0 yr,and also put forward a possibility of a periodicity of less than 4 yr,but they could not confirm this periodicity because of the lack of data.In an available historical archival data set(data from 25 different astronomical groups)in theR-band collected for 35 yr(covering 1979–2013),evidence of QPOs with a periodicity of 317 days was reported in Zhang et al.(2014).Rieger &Volpe (2010) discussed that the longterm QPOs in PKS 2155-304 might indicate a binary black hole(BBH) model,leading to a signal of periodicity when the secondary BH crosses the disk of the primary BH,similar as the QPOs in OJ 287 (Valtonen et al.2008;Hayasaki et al.2013;Britzen et al.2020).In addition,with theVRIJHKphotometry,Sandrinelli et al.(2014)reported QPOs ofT∼315 days by using data from the Rapid Eye Mounting Telescope during 2005–2012,which is well consistent with the report by Zhang et al.(2014).What is more,the overlap of time interval between two works makes the periodicity more robust.A few years later,using the extensive HIPPO data taken from 2009 July 25 to 27,Pekeur et al.(2016) claimed QPOs ofT∼13 minutes andT∼30 minutes,which is the first evidence of QPOs in the polarization of AGN,and discussed that such fast variations in the optical polarization might generate from an emission region,which is comparable in size to radius of gravity of the central engine,in Doppler boosted jet.Sandrinelli et al.(2018) derived data from the Rapid Eye Mounting Telescope photometry,SMARTS,the Tuorla Blazar Monitoring Program,and combined with data from the Steward Observatory Fermi Blazar Observational Program,ROTSEIII,the All Sky Automated Survey robotic telescopes and archival data collected by Kastendieck et al.(2011),and found a periodicity of 315±25 days in theR-band,which can be caused by relativistic jet instabilities(Pandey et al.2020;Kalita et al.2021)or chance fluctuation(Hong et al.2018;Smith et al.2018).Chevalier et al.(2019) reported that a 700 day-long periodicity is found in the optical band,as well as in high energy (100 MeV In other bands,signals of QPOs have also been detected and reported in PKS 2155-304.Urry et al.(1993) reported a∼0.7 day QPOs in the ultraviolet from data obtained by the IUE satellite throughout 1991 November on a daily basis,and suggested that the flares may cause from disturbances propagating along magnetic field in a jet.Unfortunately,with more data achieved during the whole month of 1991 November,Edelson et al.(1995) could not recover the periodicity above with more rigorous analysis.Based on the XMM-Newton EPIC/pn detector observation of 24 data sets,Lachowicz et al.(2009) obtained a periodicity ofT∼4.6 h on 2006 May 1 in the 0.3–10 keV.Gaur et al.(2010)claimed that another light curve,rather than the upper one,from XMMNewton/EPIC displays a weak and broad QPO with a periodicity of 5.5±1.3 ks.Sandrinelli et al.(2014)considered the Fermi light curve(from 2008 August 6 to 2014 June 9),and pointed out a periodicity peak atT∼630–640 days,which is twice as many as optical and NIR period.Zhang et al.(2017)found a 1.74±0.13 year-long γ-ray QPOs in Fermi LAT Pass 8 data with the data from August 2008 to October 2016,probably associated with relativistic jet instability or the process feeding the jet.Moreover,a jets-in-jet model was purposed as a plausible reason to explain the TeV flares.There are blobs that move relativistically in the jet,which lead to fastevolving flares (Giannios et al.2009).Rapid TeV variability can be well explained using a standard SSC approach while taking into account the particle evolution and the external lightcrossing time effects (Katarzyński et al.2008).Prokhorov &Moraghan (2017) provided evidence of a 644 day-long periodicity in γ-ray band from Fermi-LAT (3FGL).The result corresponds to 1.7 yr proposed by Peñil et al.(2020)with same data.Bhatta &Dhital (2020) reported a periodicity of ∼610 days from 3FGL.Tarnopolski et al.(2020)analyzed data from the LAT 8 yr Source Catalog,spanning from 2008 August 4 to 2019 April 19,and found a periodicity of 612±42 days in γray band,confirmed by Żywucka et al.(2021).According to the long timescale,Żywucka et al.(2021) considered that the variability originates in accretion disk. This paper is organized as follows.In Section2,the acquisition of the magnitude measurements,and methods to determine the optical QPOs are presented.Our discussions on the optical QPOs with a periodicity about 300 days are given in Section3.Final summaries and conclusions are shown in Section4.Throughout this paper,we have adopted the cosmological parameters ofH0=70 km·s−1Mpc−1,ΩΛ=0.7 and Ωm=0.3. We collected optical-band photometric data of PKS 2155-304 from the CSS(Drake et al.2009)and from the ASAS-SN(Shappee et al.2014;Kochanek et al.2017),with CSS light curve from 2005 August 15 to 2013 July 6 (MJD from 53 597.542 to 56 479.608),with the ASAS-SN light curve from 2014 May 15 to 2018 September 14 (HJD from 2 456 792.777 to 2 458 375.657),shown in Figure1.CSS utilizes three telescopes,1.5 m telescope with the field of view 5.0 deg2,1.0 m telescope with the field of view 0.3 deg2,0.7 m telescope with the field of view 19.4 deg2,owned and managed by Steward Observatory of the University of Arizona.The CSS is a part of the Catalina Surveys.The CSS project is mainly used for searching rapidly moving Near Earth Objects(NEOs)and makes efforts to catalog at least 90 percent of the estimated population of NEOs larger than 140 m,some of which may pose an impact threat to the Earth.ASAS-SN consists of 24 individual 14 cm telescopes,distributed around the globe with six units located at the Hawaii station of the Las Cumbres Observatory,South Africa,Texas,China and two at Chile.ASAS-SN currently works in the optical wavelength range and is survey to monitor daily the entire night sky.TheV-band used in ASAS-SN is JohnsonV-band filter.In addition,ASAS-SN is now focusing on fainter objects in theg-band and the rate of data collection has been improved to 20 h,which will make ASAS-SN discover more variable objects in greater detail than before.Due to unknown magnitude difference between ASAS-SNV-band andg-band light curves in PKS 2155-304,and due to quite short time duration of the ASAS-SNg-band light curve,the ASAS-SNg-band light curve is not taken into account in this paper. Figure 1.Light curves of PKS 2155-304 in the V-band from CSS (left panel) and in the V-band from ASAS-SN (right panel). Figure 2.The powers determined through the GLSP method applied to the CSS light curve(left panel)and to the ASAS-SN light curve(right panel).The solid blue line in each panel represents the GLSP power of CSS and ASAS-SN light curves,and the solid red line represents the GLSP power of the evenly sampled CSS and ASAS-SN light curves.The vertical red dotted line in each panel marks the position of the corresponding peak of the power.The orange dotted lines represent significance level at 99.99% and 99.9999%,respectively. PKS 2155-304 has been observed for many years and has shown optical QPOs.In order to test the optical QPOs in the CSS and ASAS-SN light curves,the following commonly accepted methods are applied: the generalized Lomb-Scargle periodogram (GLSP) method (Bretthorst2001;VanderPlas2018),the weighted wavelet Z-transform (WWZ) technique(An et al.2013),the epoch-folded method and the redfit method (Schulz &Mudelsee2002). Differing from the Lomb-Scargle algorithm (Lomb1976;Scargle1982),the GLSP method(Zechmeister&Kürster2009)not only considers the errors associated with the fluxes,but also uses sinusoids plus constant rather than sinusoidal functions as a fitting function.As well discussed in Zechmeister &Kürster(2009),lety(t)=a cosωt+b sinωt+c be the fitting function andyibe theNmeasurements of a time series at timetiwith errors σi.Then at given frequency ω,let the squared difference betweeny(t) andyibe minimized: Furthermore,the power P(ω)normalized to unity by(χ2for the weighted mean) can be written as: Figure2shows the powers from the GLSP method.Through the CSS light curve,there is a clear peak around 328±4 days with significance level higher than 99.9999% (false alert probability 0.000 001 in GLSP).As discussed in VanderPlas(2018),the significance is usually expressed in terms of a false alarm probability,encoding the probability of measuring a peak of a given height(or higher)conditioned on the assumption that the data consists of Gaussian noise with no periodic component.Through the ASAS-SN light curve,there is a clear peak around 267±8 days with significance level higher than 99.9999% (false alert probability 0.000001 in GLSP).Meanwhile,there is an additional peak of 689±14 days in ASAS-SN light curve.The uncertainties of the periodicities are determined by the widely applied bootstrap method leading to periodicity distribution shown in Figure3.Meanwhile,based on the GLSP power properties shown in Figure2,quality of 300 days QPOs as discussed in Gierlinski et al.(2008) can be estimated byT/δT∼11.3(Tas periodicity and δTas full width at half maximum)in CSS light curve and 5.2 in ASAS-SN light curve,indicating there is a high quality periodicity. Figure 3.The left panel displays bootstrap method determined distribution of the periodicity about 328±4 days from CSS and the right panel shows bootstrap method determined distributions of the periodicity about 267±8 days and the second periodicity about 689±14 days from ASAS-SN.The solid orange line in each panel marks the best Gaussian Fitting of periodicity distribution. In addition,based on Figure1,the variability amplitude in the CSS light curve(standard deviation about 0.54)is about 1.6 times larger than the variability amplitude in the ASAS-SN light curve(standard deviation about 0.34).The definite reason of the different variability amplitudes(probably due to intrinsic variability related to central accreting process)is unknown.But the quite different variability amplitudes have apparent effects on detecting QPOs through GLSP,probably leading to different peak values in the GLSP power.So the data of CSS and ASAS-SN are not put together. WWZ first proposed by Foster(1996)can be well applied to estimate and determine QPOs (Torrence &Compo1998;An et al.2013;Li et al.2021),especially in unevenly sampled time series,based on three trial functions: 1(t),cos[ω(t-т)] and sin[ω(t-т)].The 1(t) represents a constant function,since the function first described by Foster (1996).wα=exp (-c ω2(tα-т)2) (α=1,2,3) is the statistical weight and in whichcis a tunable parameter.The WWZ power is defined with Neffrepresents the effective number density of data points,and the weighted variations of data x and model function y areVxandVy,respectively.These factors are described as: In Figure4,the powers show clear peaks at ∼328 days in the CSS light curve and at ∼266 days in the ASAS-SN light curve,respectively.The periodicities determined through the WWZ technique are well consistent with the results determined by the GLSP method. Through the CSS light curve,both GLSP and WWZ show a clear peak at about 328 days.Meanwhile,through the ASASSN light curve,besides the peak about 267 days,there is an additional second peak around 689 days through the GLSP method.In order to confirm the periodicity around 300 days,the epoch-folded method is applied.The left panel of Figure5shows the folded CSS light curve with periodicity about 328 days and with zero-point corresponding to MJD=53597.542.The right panel of Figure5shows the folded ASAS-SN light curve with periodicity about 267 days and with phase zeropoint corresponding to HJD=2456752.777.The epoch-folded light curves can be well described by sinusoidal function shown as solid purple lines in Figure5,to support the periodicity around 300 days.In order to test the second periodicity around 689 days detected in the ASAS-SN light curve by the GLSP method,two model functions are applied to describe the ASAS-SN light curve.The first model function(model 1) isa+b×t+c× sin (2π×+φ0) with periodicityTas a free model parameter,leading to the best descriptions shown as the solid blue line in Figure6with(sum of squared residuals divided by degree of freedom) with determinedT∼267 days totally similar as the GLSP determined first periodicity.The second model function (model 2) isa+b×t+c×with periodicityT=689 days (the second periodicity of 689 days detected by GLSP) as a fixed model parameter,leading to the best descriptions shown as the solid green line in Figure6with~29 283.1222.Due to high accuracy of ASAS-SN data point,there are large χ2value.In addition,it is useful to determine whether periodicity of 689 days is preferred through the F-test technique.Based on the different χ2/dofvalues for Model 1 and Model 2,the calculatedFpvalue is about Figure 4.Power properties through WWZ applied to the optical CSS V-band light curve(left panel)and to the optical ASAS-SN V-band light curve(right panel).The horizontal dotted red line in each panel marks the position of the corresponding periodicity. Figure 5.The epoch-folded CSS light curve with a 328 day periodicity (left panel) and the epoch-folded ASAS-SN light curve with periodicity of about 267 days(right panel).The solid purple lines are the best-fitting descriptions by sinusoidal function,and the dashed purple lines show the corresponding 1RMS scatters. Figure 6.Light curve (red plus) of PKS 2155-304 in the V-band from ASAS-SN.The solid blue line shows the best fitting result with periodicity as a free model parameter,the solid green line represents the best fitting result with fixed periodicity. Figure 7.The power spectrum calculated by the redfit method applied to the CSS light curve (left panel) and the ASAS-SN (right panel) light curve. Based ondof2−dof1anddof1as number of dofs of the F distribution numerator and denominator,the expected value from the statistical F-test with confidence level about 0.0021%will be near toFp.Therefore,the confidence level is higher than 99.9979% (1%–0.0021%),higher than 3σ,to support that periodicity of 267 days is preferred,rather than the periodicity of 689 days.Therefore,there are no further discussions on the periodicity of 689 days. A simple fact is that we discover theT∼328 days periodicity from data of the CSS light curve and theT∼267 days periodicity from data of ASAS-SN.The results are similar to the optical QPOs with a periodicity of 317 days in theRband in Zhang et al.(2014),a periodicity of 315 days inVRIJHKbands in Sandrinelli et al.(2014) and a periodicity of 315 days inR-band in Sandrinelli et al.(2018),strongly supporting the expected optical QPOs with periodicity about 300 days in the well-known blazar PKS 2155-304. However,the presence of red noise at the optical band can affect the detected QPOs in AGN.It not only can bury possible QPOs signal,but also may spuriously mimic few-cycle sinusoidlike periods (Krishnan et al.2021).Covino et al.(2019) has shown that some periodicities reported in AGNs appear poorly justified,but Ren et al.(2021) argued that red noise can hardly be responsible for long-term QPOs.In the paper,the influence of red noise is eliminated.Schulz &Mudelsee (2002) provided a computer program (redfit) which can estimate red-noise spectra from unevenly spaced data and give the confidence level.In addition,this program is based on two assumptions(Xiong et al.2017): (1) the noise background can be approximated by continuous autoregressive (CAR);(2) the distribution of data points is not too clustered.Based on the redfit method,the influence of red noise in PKS 2155-304 in CSS and ASAS-SN light curves is check in Figure7.It is obvious that the determined periodicities are around 320 days and 277 days through the redfit method applied to CSS and ASAS-SN light curves,respectively,similar as the results by GLSP,WWZ and epoch-folded method.What is more,the confidence levels of the periodicity in CSS and ASAS-SN light curves are both much higher than 95%. Figure 8.The DRW-determined best descriptions to the light curve of PKS 2155-304(left panel)and the posterior distributions of т and σ(right panel).The solid red line represents the best descriptions and areas filled with light blue show the corresponding 1σ confidence bands and solid green dots are the data of PKS 2155-304 from ASAS-SN in the left panel. Moreover,the damped random walk(DRW)process and/or continuous autoregressive (CAR) are used to examine the probability of detecting fake QPOs.The CAR process is discussed in Kelly et al.(2009): where т and σ are intrinsic characteristic variability amplitude and timescale,respectively.∊(t) is a white noise process,and X(t) is the AGN light curve and тσ2/2 is the variance.According to the public code JAVELIN (Just Another Vehicle for Estimating Lags In Nuclei)(Kozłowski et al.2010;Zu et al.2013),the т of light curve in CSS and ASAS-SN is 132±55 days and 83±36 days,respectively.Here,due to higher quality of ASAS-SN light curve,only the best descriptions to ASAS-SN light curve is shown in the left panel of Figure8.Moreover,the effects of insufficient data sampling can be simply discussed.Based on the best descriptions,an evenly sampled light curve (time step about 0.8 day) can be determined and shown as the solid red line in the left panel of Figure8.Then,the solid red line in the right panel of Figure2shows the GLSP power properties determined from the evenly sampled ASAS-SN light curve,similar as the GLSP power properties from the observed ASAS-SN light curve.Similar results can be found in the left panel of Figure2to the observed CSS light curve and the evenly sampled CSS light curve (time step about 0.2 day).So that,the insufficient data sampling has few effects on our final results. The posterior distributions of т and σ determined by Markov Chain Monte Carlo (MCMC) (Foreman-Mackey et al.2013)technique are presented in the right panel of Figure8.Then it is interesting to determine whether fake QPOs can be detected in CAR process created light curves.Based on Equation (8),the 1000 artificial light curves are created by the following four steps.First,the CAR process parameters are accepted as т=132 days (83 days),тσ2/2=0.29 (0.29 as the variance of the CSS light curve)(тσ2/2=0.11 with 0.11 as the variance of the ASAS-SN light curve)andbdt=12.87(12.87 as the mean value of the CSS light curve)(bdt=13.69 with 13.69 as the mean value of the ASAS-SN light curve).Second,time informationtis the same as that of the CSS (ASAS-SN) light curve.Third,the white noise ∊(t)here is randomly created withrandomnfunction in IDL.Fourth,after 1000 loops,1000 artificial light curves can be created by CAR process.Then fake QPOs are detected among the artificial light curves based on the following three criteria.First,the light curve can show well QPOs with GLSP determined peak value higher than 0.3(peak values in Figure2higher than 0.35);Second,the periodicity of the light curve is between 100 and 500 days;Third,the light curve can be well fit with epoch-folded method.Among the CAR process simulated 1000 light curves with т and σ determined from the CSS light curve (ASAS-SN),there are four light curves (eight light curves) with determined QPOs based on the three criteria above.The probability of detecting fake QPOs is 0.4%in CSS and 0.8%in ASAS-SN light curve.In addition,a CAR process created light curve with fake QPOs is shown as an example in the left panel of Figure9,and the corresponding epoch-folded light curve shown in the right panel of Figure9with best fitting results by sinusoidal function. Figure 9.An example of light curve with fake QPOs by CAR process(left panel)and corresponding epoch-folded light curve with periodicity about 400 days(right panel).The solid purple line represents the best-fitting descriptions by sinusoidal function,and the dashed purple lines show the corresponding 1RMS scatters in the right panel. There are several theoretical models which can be applied to explain the optical QPOs in PKS 2155-304.In this paper,the relativistic frame-dragging effect,the binary black hole model and the jet precession model are mainly discussed as follows. Relativistic frame-dragging effect has been primordially applied to describe the QPOs in galactic X-ray binaries with central spinning black holes (Cui et al.1998;Stella &Vietri1998;Ingram &Motta2019).It is a general relativistic effect related to central accretion discs (Fukumura et al.2009;Ingram&Motta2019;Zhang2021),and it can be also applied in blazars (Marscher et al.2008;Liu et al.2021).As more recent discussions in Bhatta (2021),“the rapidly spinning supermassive black hole can warp spacetime and give rise to the precession of the disk owing to the Lense-Thirring precession.” The Lense-Thirring precession frequency (Cui et al.1998) is given by In this equation,a* is an angular momentum parameter.Mrepresents the mass of black hole,andris the radii of emission regions andrg=GM/c2is the Schwarzschild radii.Moreover,Gierlinski et al.(2008) reported that RE J1034+396 has an X-ray periodicity of 1 h.Meanwhile,the central BH mass of RE J1034+396 reported in Czerny et al.(2016);Jin et al.(2020) is about 5×10⁶M⊙.RE J1034+396 is chosen as a standard case with the Lense-Thirring precession determined X-ray QPOs from the direct vicinity (about 10 Schwarzschild radii)of the black hole as discussed in Gierlinski et al.(2008).Meanwhile,if simply accepted that the optical QPOs of PKS2155-304 are also related to the Lense-Thirring precession,the central BH mass of PKS 2155-304 can be estimated,assumed optical emission regions are about 100 ∼200 Schwarzschild radii. The central BH mass of PKS 2155-304 with optical periodicity about 300 days would be 4.5×10⁶M⊙∼3.6×10⁷M⊙with The mean mass can be roughly estimated as 1.5×10⁷M⊙,which is similar as the BH mass in PKS 2155-304 reported in Lachowicz et al.(2009) through X-ray QPOs properties.However,the estimated BH mass is quite smaller than 109M⊙determined by host galaxy absolute magnitude of PKS 2155-304 as discussed in Falomo et al.(1991),Kotilainen et al.(1998),Sandrinelli et al.(2014),which is about two magnitudes higher than our estimated BH mass,probably due to the following two reasons.On one hand,according to Kormendy &Ho (2013),the relation between black hole mass and magnitude has large intrinsic scatter about 0.31.On the other hand,the beaming effects would affect the host galaxy absolute magnitude,considering that a simple PSF function should be not efficient enough to totally describe central emissions including beaming effects.If there were independent methods applied to determine the central BH mass of PKS 2155-304,it would provide further clues to support whether the relativistic Frame-dragging effect is preferred in PKS 2155-304. Besides the relativistic frame-dragging effect,the binary black hole (BBH) model can be applied to explain the optical QPOs in PKS 2155-304,as the reported long-term optical QPOs in Britzen et al.(2020),Yang et al.(2021),Liao et al.(2021),and O’Neill et al.(2022).Under the framework of the BBH model,the space separationABBHof the central binary black hole should be whereM8is the central total BH mass in units of 108M⊙andPBBHis the QPOs periodicity.IfMBH∼109M⊙,determined by the absolute magnitude of host galaxy of PKS 2155-304,is accepted as the total BH mass,the expected space separation is about So small space separation indicates that it is hard to spatially resolve central binary black hole in central regions of PKS 2155-304 in the near future.However,so small space separation in the BBH model is also reported in literature,such as Li et al.(2021) used the BBH model to explain QPOs with periodicity of 850 days in OT 081,with estimated space separation about 0.0076 pc. Jet procession (Caproni et al.2013;Mangalam2018;Ren et al.2021)is also a possible explanation for the QPOs shown in the long-term light curves.It assumes helical structure in a relativistic jet (Bhatta2018;Zhang et al.2021).Brightness of source varies with the viewing angle (Zhang et al.2014;Li et al.2017).This model has been successfully used to other AGNs.Bhatta et al.(2016) reported that OJ 287 has a periodicity of 400 days.Caproni et al.(2017) reported that PG 1553+113 has a periodicity of 2.24 yr at 15 GHz from data of the MOJAVE/2 cm Survey Data Archive (during 2009–2016).Sarkar et al.(2021)reported that 3C 454.3 shows a periodicity of 47 days in γ-ray and optical bands.Tripathi et al.(2021) reported that AO 0235+164 has a periodicity of 965 days with the radio band data from the University of Michigan Radio Astronomical Observatory during 1980-2012.Zhang &Wang (2021) reported that J0849+5108 shows a periodicity of 176 days at the 15 GHz from observations by the Owens Valley Radio Observatory.It is interesting to consider jet procession model in PKS 2155-304. There are the 0.7 day periodicity in the ultraviolet band(Urry et al.1993)and 4.6 h periodicity in the X-ray band(Lachowicz et al.2009),which are quite different from 300 days optical periodicity of PKS 2155-304 shown in our paper.Considering the differences of the observation time and the radiation area between optical band and other bands,it is possible to detect different QPOs in different bands.Therefore,more efforts should be necessary to check the jet procession model to explain the QPOs in PKS 2155-304. The main summaries and conclusions are as follows. 1.Through the CSS and ASAS-SN light curves,optical QPOs with periodicity about 300 days are reported in PKS 2155-304,which are well consistent with previously reported optical QPOs in the literature through light curves in different optical bands and from different projects,providing strong evidence to support the optical QPOs with periodicity about 300days in PKS 2155-304. 2.The QPOs in the CSS light curve have about 8.8 cycles and in the ASAS-SN light curves have about 6 cycles. 3.If the relativistic frame-dragging effect is applied to explain the optical QPOs in PKS 2155-304,the estimated central BH mass should be about 107M⊙,which is quite smaller than that estimated by absolute magnitude of host galaxy of PKS 2155-304. 4.If the BBH model is applied to explain the optical QPOs,the total BH mass estimated by absolute magnitude of host galaxy would lead the central space separation about 0.004 pc between the central two black holes. 5.The optical 300 days QPOs are different from that in ultraviolet and X-ray bands found in previous references.If the jet precession model is applied,different bands may have similar QPOs.However,it is possible to detect different QPOs in different bands due to different observation time and radiation area. Acknowledgments We gratefully acknowledge our referee for reading our paper again carefully and patiently,and re-giving us constructive comments and suggestions to greatly improve the paper.This work is supported by the National Natural Science Foundation of China(Grant Nos.11873032 and 12173020).This paper has made use of the data from the CSS and ASAS-SN projects developed rapidly moving Near Earth Objects.The CSS website is (http://nesssi.cacr.caltech.edu/DataRelease/).The paper has made use of the data from the ASAS-SN (https://asas-sn.osu.edu/).The website of JAVELIN code is (https://github.com/nye17/javelin/).2.Main Results







3.Discussions


4.Summaries and Conclusions
杂志排行
Research in Astronomy and Astrophysics的其它文章
- Length Scale of Photospheric Granules in Solar Active Regions
- Constraining Mass of M31 Combing Kinematics of Stars,Planetary Nebulae and Globular clusters
- The First Photometric Study of W UMa Binary System V1833 Ori
- On the Jet Structures of GRB 050820A and GRB 070125
- Solar Flare Forecast Model Based on Resampling and Fusion Method
- Effects of Binaries on Open Cluster Age Determination in Bayesian Inference
