Predicting Supermassive Black Hole Mass with Machine Learning Methods
2022-09-02YiHeQiGuoandShiShao
Yi HeQi Guoand Shi Shao
1 Key Laboratory for Computational Astrophysics,National Astronomical Observatories,Chinese Academy of Sciences,Beijing 100101,China; guoqi@nao.cas.cn
2 School of Astronomy and Space Science,University of Chinese Academy of Sciences,Beijing 100049,China
Abstract It is crucial to measure the mass of supermassive black holes(SMBHs)in understanding the co-evolution between the SMBHs and their host galaxies.Previous methods usually require spectral data which are expensive to obtain.We use the AGN catalog from the Sloan Digital Sky Survey project Data Release 7 (DR7) to investigate the correlations between SMBH mass and their host galaxy properties.We apply the machine learning algorithms,such as Lasso regression,to establish the correlation between the SMBH mass and various photometric properties of their host galaxies.We find an empirical formula that can predict the SMBH mass according to galaxy luminosity,colors,surface brightness,and concentration.The root-mean-square error is 0.5 dex,comparable to the intrinsic scatter in SMBH mass measurements.The 1σ scatter in the relation between the SMBH mass and the combined galaxy properties relation is 0.48 dex,smaller than the scatter in the SMBH mass versus galaxy stellar mass relation.This relation could be used to study the SMBH mass function and the AGN duty cycles in the future.
Key words: (galaxies:) quasars: supermassive black holes–galaxies: evolution–methods: data analysis
1.Introduction
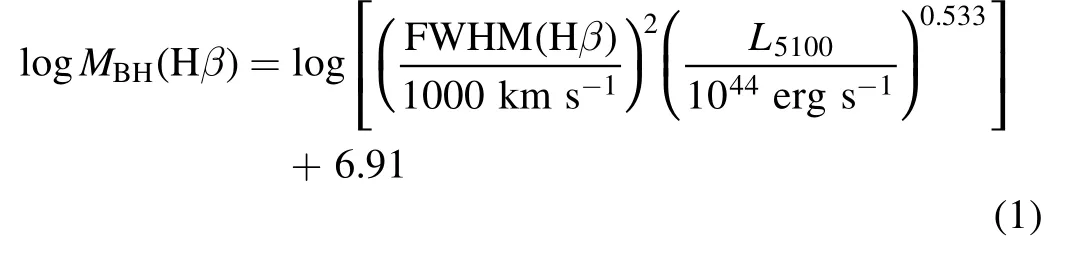
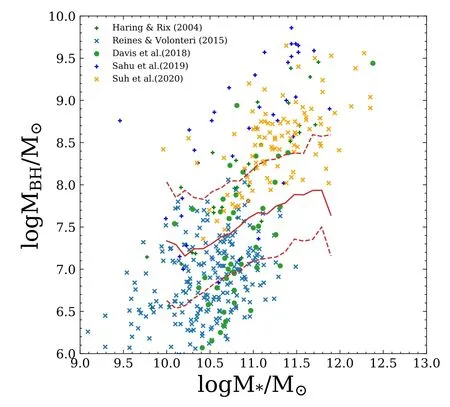
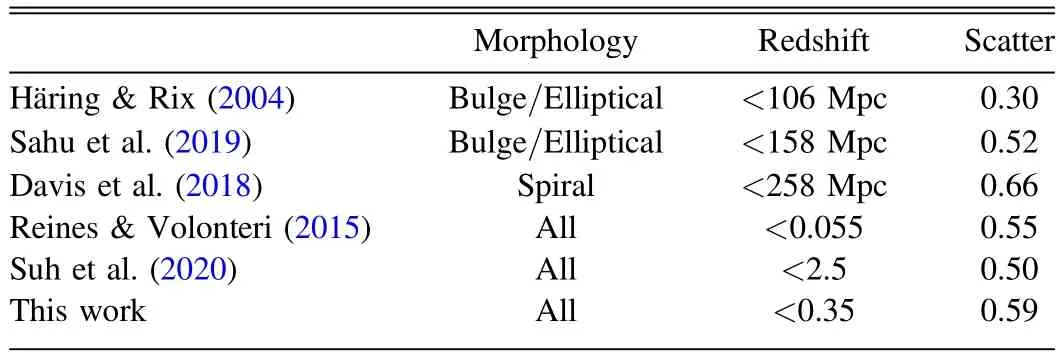
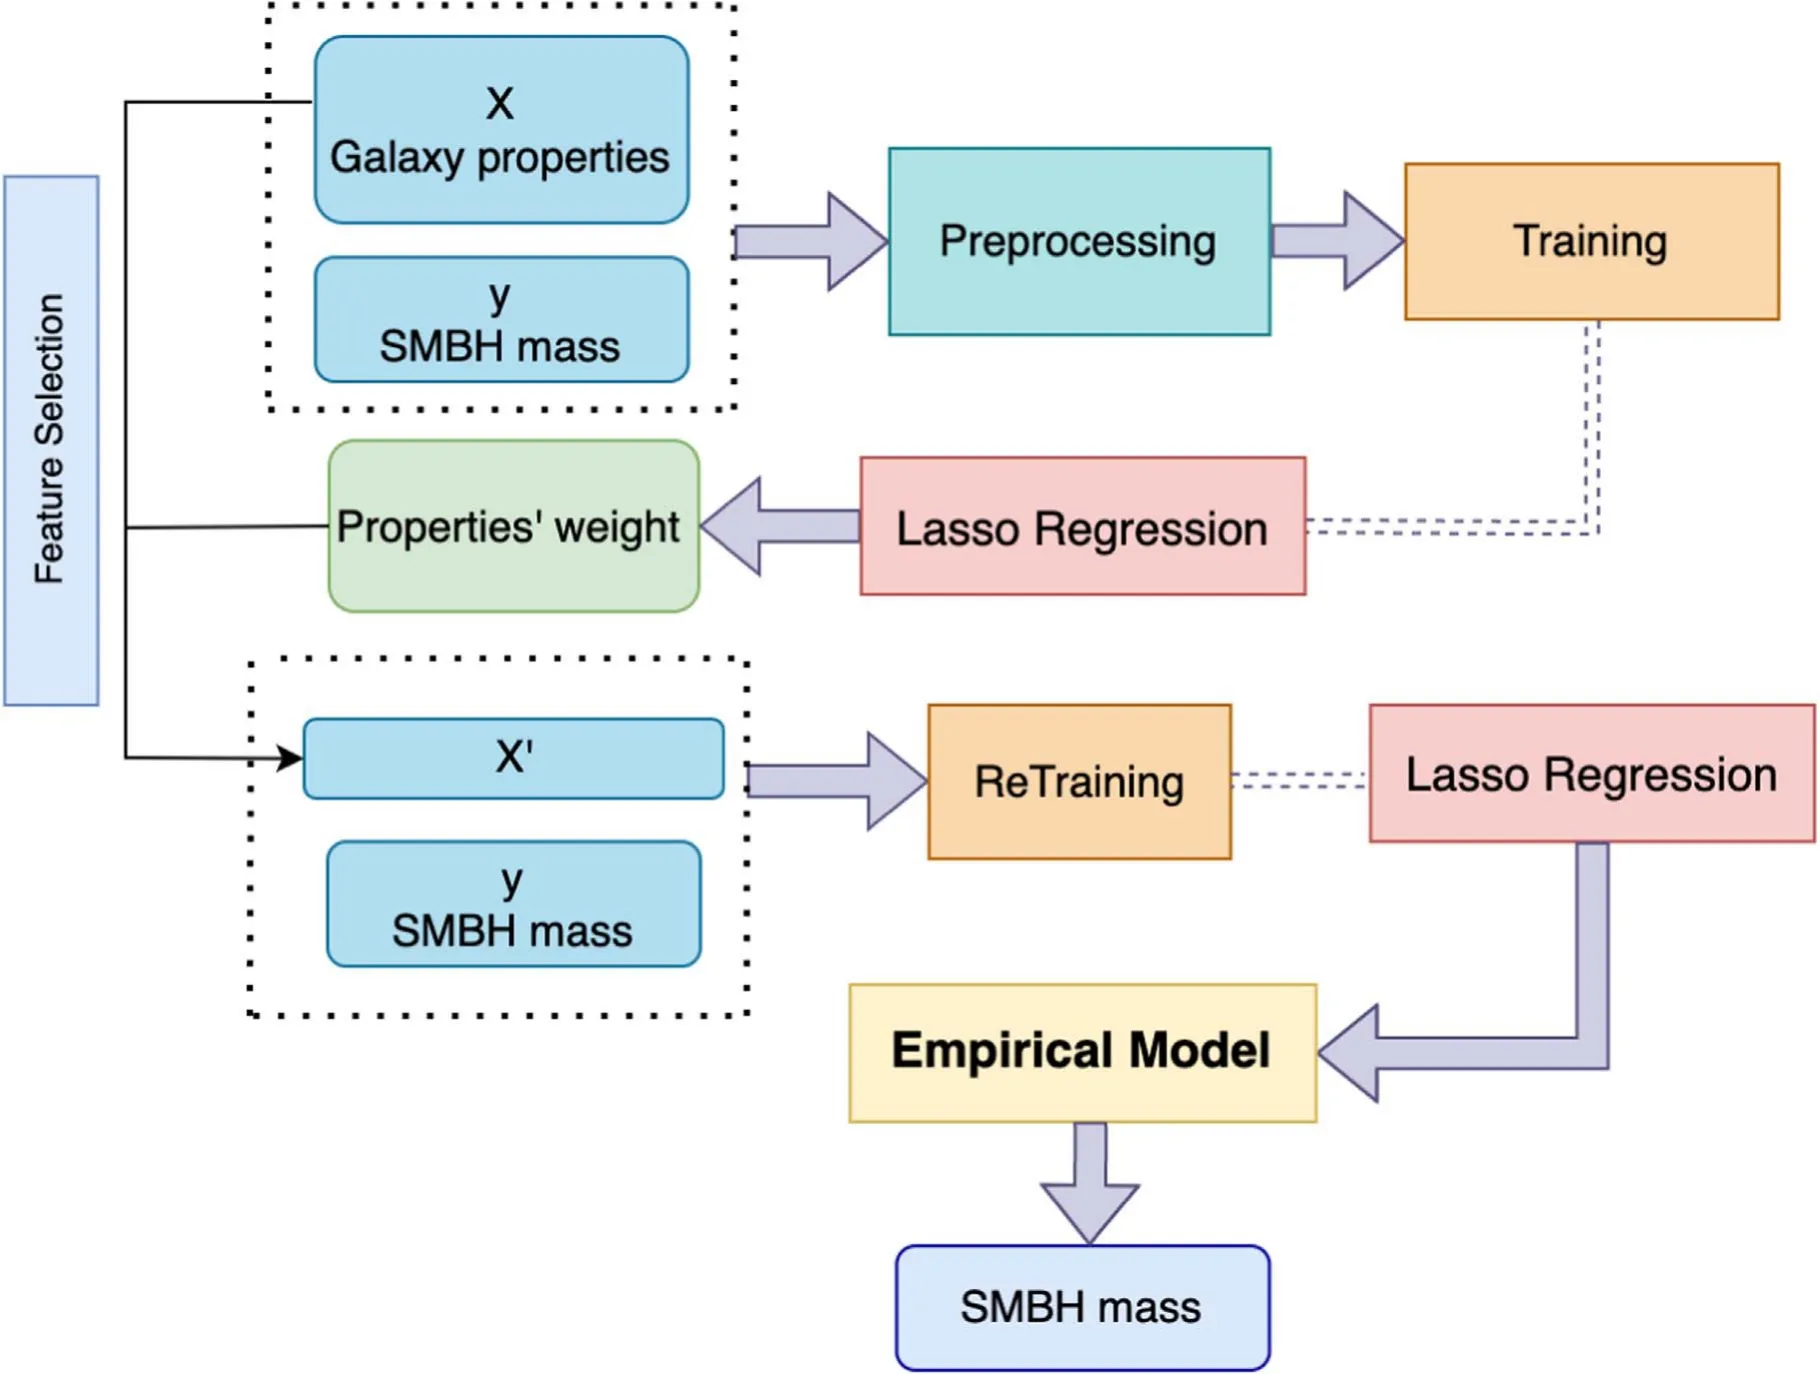
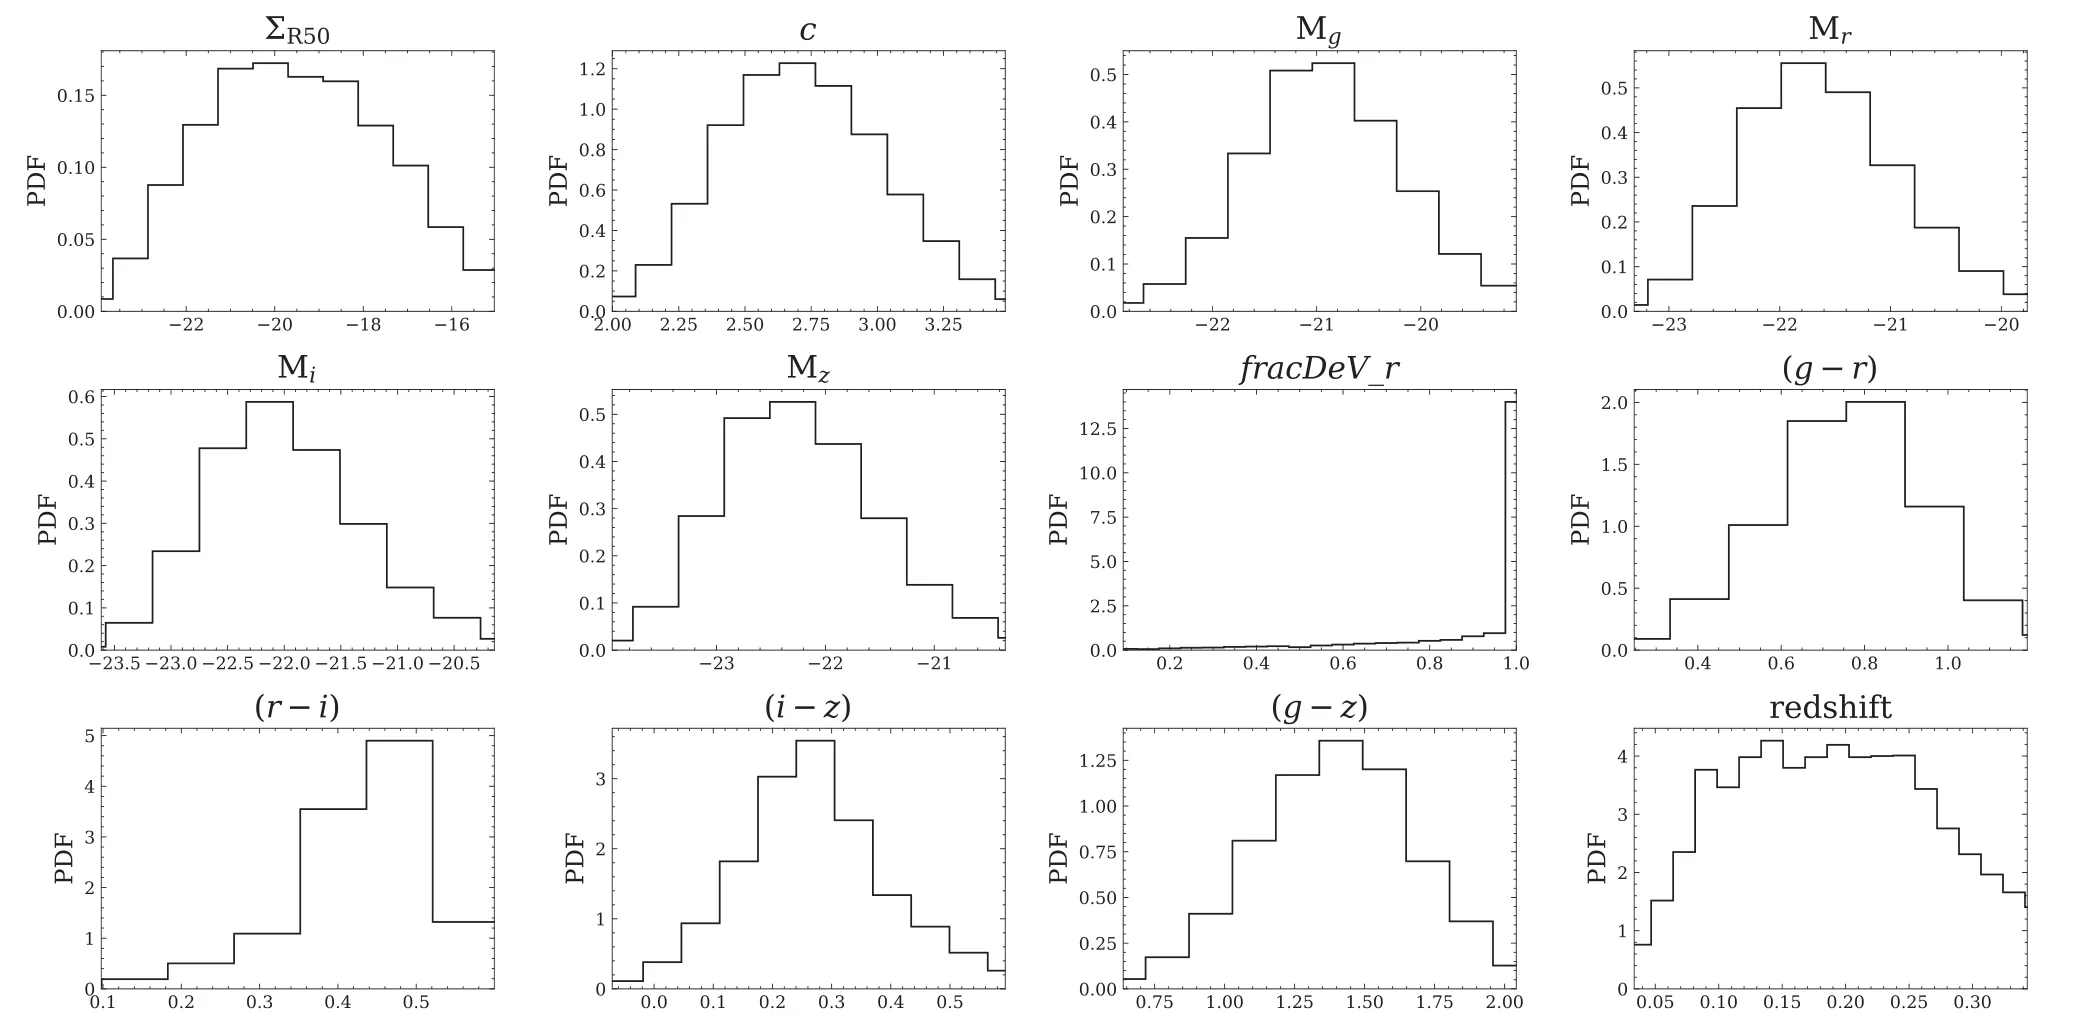
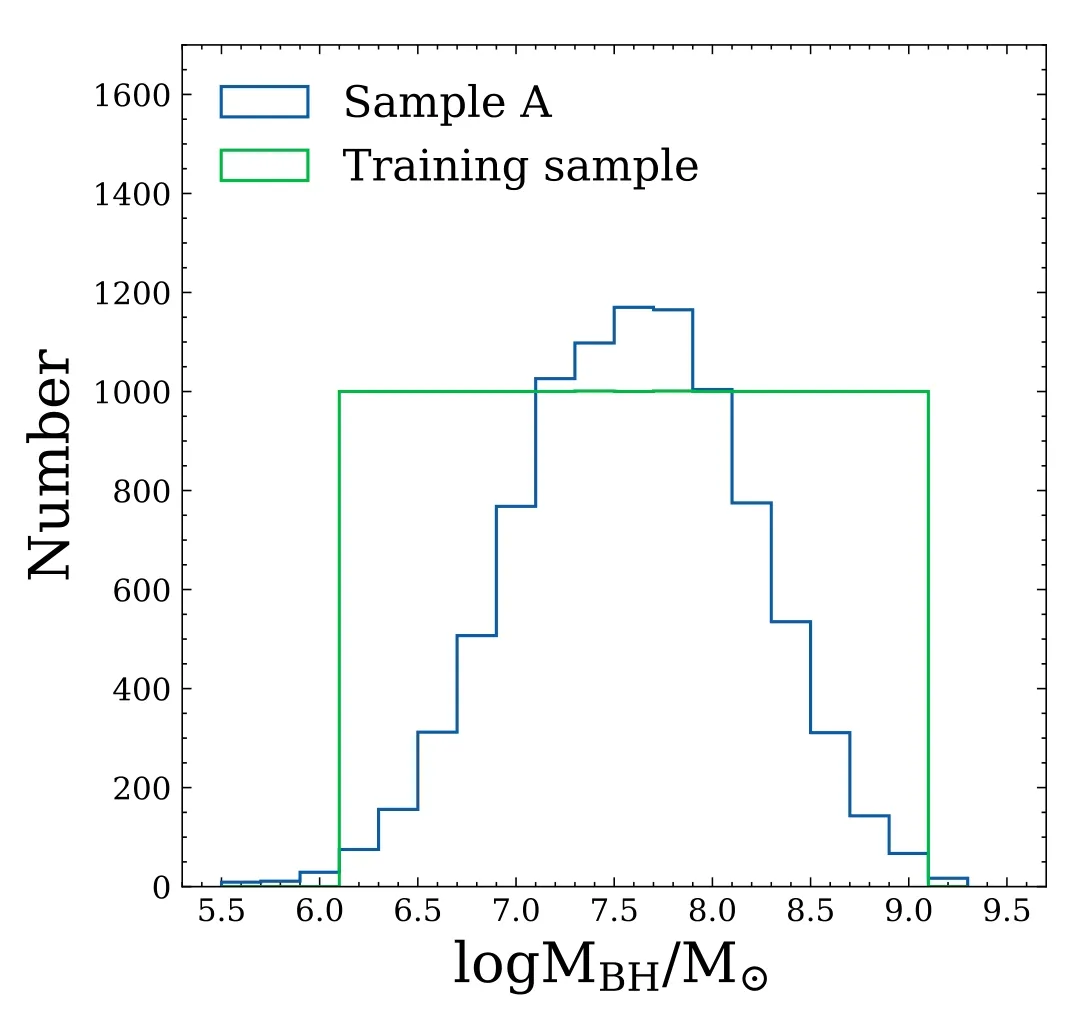
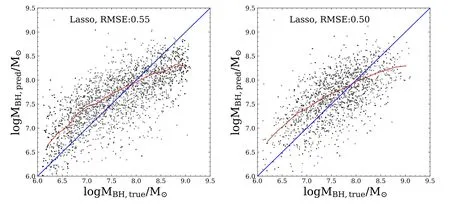
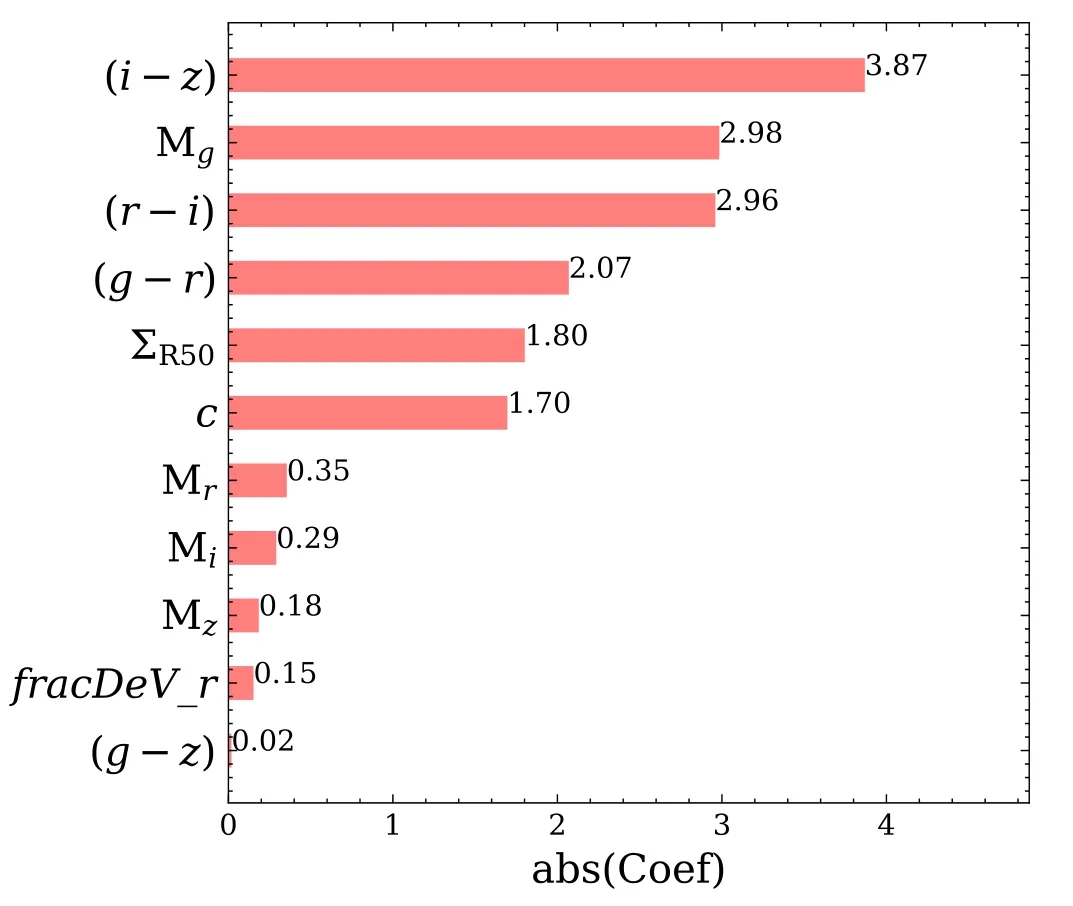
Supermassive black holes(SMBHs)are prevalent at the centers of massive galaxies(e.g.,Kormendy&Richstone1995;Ferrarese&Ford2005;Kormendy&Ho2013).Recently,the SMBH in the elliptical galaxy M87 has been imaged by the Event Horizon Telescope (Event Horizon Telescope Collaboration2019).The mass of the SMBHs is tightly related to the properties of the galaxies,such as bulge mass,velocity dispersion,and surface brightness (Ferrarese &Merritt2000;Merritt &Ferrarese2001;Häring &Rix2004;Saglia et al.2016),as well as the velocity dispersion of the entire elliptical galaxies(Liu et al.2008;Graham&Scott2013;Kormendy&Ho2013).Such correlations present both in nearby and in high redshift galaxies (Wu et al.2002;Shields et al.2006;Shen &Kelly2010;Schramm &Silverman2013).The co-evolution between the SMBHs and their host galaxies invokes great interest,given their orders of magnitude differences in masses and sizes(Hopkins et al.2008;Schawinski et al.2010;Izumi et al.2019;Pensabene et al.2020).Recent studies suggest that massive black holes are formed in the central regions of galaxies as a result of nearby material feeding and SMBH mergers (Di Matteo et al.2005,2008;Alexander &Hickox2012;Marasco et al.2021).On the other hand,SMBHs could play an important role in shaping the formation and evolution of the host galaxies by releasing a vast amount of momentum and energy while accreting gas (Ciotti &Ostriker2007;Sijacki et al.2007;Hopkins et al.2009).
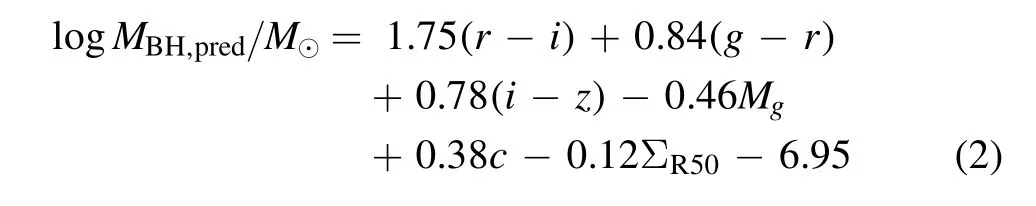
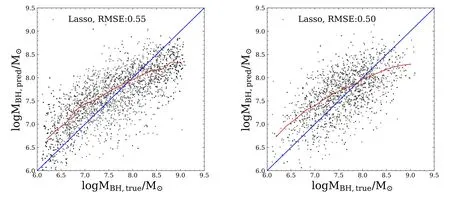
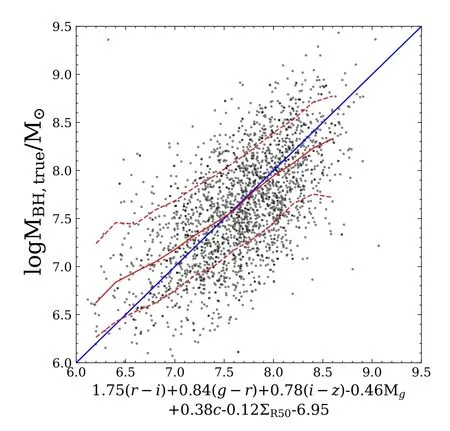
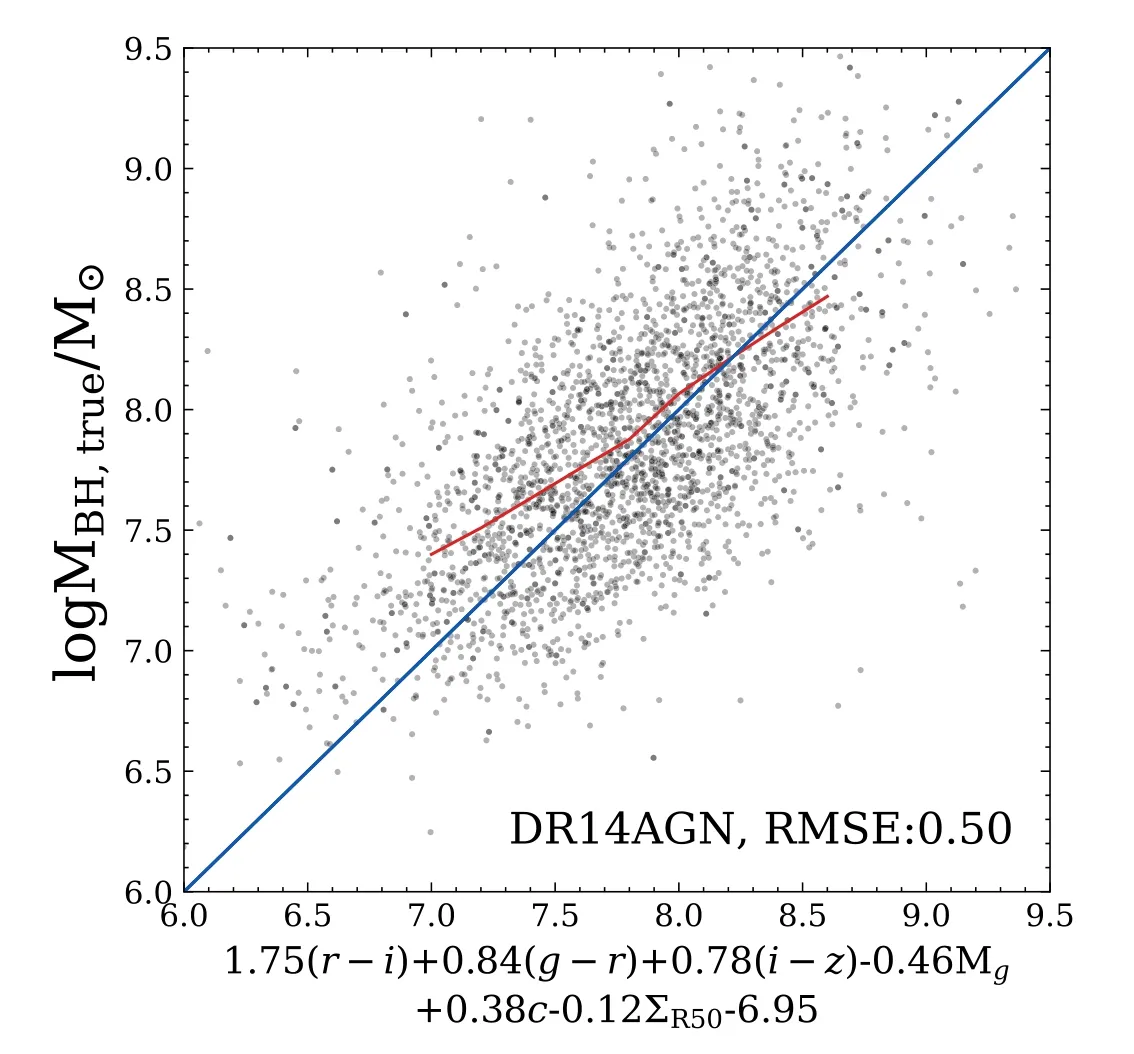
It is crucial to measure the SMBH mass for understanding their formation and evolution,as well as their co-evolution with the host galaxies.However,accurate measurements require high spatial resolution within the gravitational regime of the SMBHs(Magorrian et al.1998;Kormendy &Kennicutt2004).The closest distance ever reached is via the stellar dynamics around the SMBH in the center of the Milky Way.The orbits of stars at∼100 au from the center infer the mass of the SMBH to be 4×10⁶M⊙(Ghez et al.2008;Gillessen et al.2009;Peißker et al.2020).Such high-resolution data are only available in our Milky Way.For distant galaxies,gas dynamics at sub-kpc scales are usually adopted to estimate the SMBH mass.One of the most popular methods is reverberation mapping(Peterson1993;Netzer&Peterson1997;Kaspi et al.2007;Grier et al.2017),which uses the lag between broad emission-line flux and continuum flux to estimate the size of the broad-line region,and the width of the broad emission lines to estimate the velocity dispersion.Assuming an equilibrium status in the broad-line region,one can apply the viral theory to calculate the total mass enclosed as an approximation of the central SMBH mass.Recently Shen et al.(2019) collected 849 broad-line quasars from the Sloan Digital Sky Survey Reverberation Mapping (SDSS-RM) project,covering a redshift range of 0.1 Based on the reverberation mapping data,a correlation between the radius of the broad-line region and the continuum luminosity (R–L) can be derived (Bentz et al.2006,2009;Alvarez et al.2020).It is much less expensive to obtain the continuum luminosity than to measure the lag between broad emission-line flux and continuum flux.Using theR–Lrelation,Liu et al.(2019)estimated the SMBH mass for a large,uniform and well-defined sample of 14,584 broad-line AGNs atz<0.35. Another way to estimate the SMBH mass is via the host galaxy properties,i.e.,the SMBH mass is tightly related to the mass/velocity dispersion of the classical bulge or the same properties of elliptical galaxies.This method could extend the mass measurement to much larger SMBH samples.However,the scatter of estimated SMBH mass is very large for galaxies with pseudo-bulges or for spiral galaxies,∼0.6 dex(Kormendy&Gebhardt2001;Kormendy et al.2011;Greene et al.2016).It is therefore very important to find a robust relation between the SMBH mass and various properties of their host galaxies.Lin et al.(2021)used neural networks to model SMBH mass based on quasars’ luminosity and colors.Their results have a small root-mean-square error (RMSE) value,0.37,but the performance at high and low mass ends is not very good. In this work,we use the SMBH mass estimated by Liu et al.(2019) with galaxy photometry from the Sloan Digital Sky Survey project Data Release 7 (SDSS DR7;York et al.2000),and use the machine learning methods to investigate the correlation between the SMBHs and their host galaxies. The paper is structured as follows.In Section2,we present our sample galaxies and provide a brief introduction to the machine learning method,Lasso regression.We present the results in Section3and discussion in Section4. In this work,we adopt the broad-line AGNs catalog from the SDSS DR7 presented by Liu et al.(2019).The SDSS conducts both imaging and spectroscopic surveys with the 2.5 m Sloan Foundation Telescope(Gunn et al.2006)and the du Pont 2.5 m Telescope (Ahumada et al.2020).Its imaging survey includes five photometric bands:u,g,r,i,andz,with the effective wavelength of 3550,4770,6230,7620,and 9130 Å over 11,663 square degrees.The corresponding depth limit in each band is 22.0,22.2,22.2,21.3,and 20.5 AB magnitudes,respectively (Abazajian et al.2004).It contains 357 million unique objects.Among the five photometric bands,u-band has the largest uncertainty and the lowest sensitivity (Ivezić et al.2004),we therefore exclude theu-band photometry in our analysis. In SDSS,target galaxies are then selected from photometric data for spectroscopic observations.The spectroscopic survey consists of the main sample of bright galaxies with Petrosianrband magnitude <17.77,the luminous red galaxy sample(LRGs)with Petrosianr-band magnitude<19.5 and the quasar candidate sample with point-spread function magnitudei<20.2 up toz<5.5.The spectroscopic catalog contains 930,000 galaxies and 120,000 quasars within 9380 square degrees. Liu et al.(2019) compiled a comprehensive and uniform sample of broad-line AGNs catalog from the SDSS DR7 spectroscopic objects.It contains 14,584 well-defined broad-line AGNs over a redshift range of 0 We briefly summarize the method used in Liu et al.(2019)to estimate the SMBH mass as follows.Liu et al.(2019)adopt the viral method to estimate the SMBH mass using the spectral measurements.The velocity is obtained directly by the width of the broad line,and the broad-line region (BLR) radius is estimated by adopting the empirical correlation with the broadline luminosity(Kaspi et al.2005;Wang et al.2009).Thus,the SMBH mass,MBH(Hβ),can be derived by using the spectra of Hβ with the fitting formula as follows(Greene&Ho2005;Ho&Kim2015): whereL5100is the rest frame continuum luminosity at 5100 Å(L5100≡λLλ(5100Å)).The mass can also be estimated using the broad line Hα with a similar fitting formula (Greene &Ho2005) when data are available.SMBH mass,MBH,is then defined as the average ofMBH(Hβ) andMBH(Hα).The 1σ intrinsic scatter is about 0.35 dex. We compare theMBH–M⋆relation in Liu’s results to those found in the literature.To obtain the stellar mass of the host galaxy,we cross-match this catalog with the spectroscopic data products from the Max Planck Institute for Astrophysics and Johns Hopkins University DR7 catalog(MPA-JHU;Kauffmann et al.2003;Brinchmann et al.2004;Tremonti et al.2004).Figure1presents theMBH-M⋆relation.Red curves denote the median and 1σ scatter of 0.59 dex from Liu’s AGN sample.The MPA-JHU catalog does not take into account the AGN contributions to the stellar mass.As a consequence,the stellar mass could be over-estimated,especially for those with luminous AGNs.This at least partly explains the flat feature at high masses.Häring&Rix(2004)measured theMBH–Mbulgerelation for 30 ellipticals and bulges with an observed scatter of <0.30 dex.Sahu et al.(2019) analyzed a sample of 84 early-type galaxies and their central SMBHs.The estimated scatter around theMBH–M⋆relation is about 0.52 dex.This relation is different from Liu’s results because the former is based either on classical bulges or on elliptical galaxies,while the latter includes spiral galaxies and galaxy disks.Suh et al.(2020) conducted 100 X-ray-selected moderate-luminosity,broad-line AGNs up toz∼2.5 and estimated their masses based on the single-epoch virial method.Their observed scatter is ∼0.50 dex.Davis et al.(2018)used 40 local spiral galaxies with a regression scatter 0.66 dex.It is much larger than those for elliptical galaxies and for classical bulges,confirming a tighter relationship between the SMBH and the spheroidal component of galaxies.Reines &Volonteri (2015) analyzed 262 nearby broad-line galaxies with the same methods as described in Liu et al.(2019),finding a scatter of 0.55 dex.They did not distinguish the bulge component and morphology.These measurements are more in line with theMBH–M⋆relation estimated using Liu’s catalog. Figure 1.SMBH mass vs.galaxy stellar mass relation.The solid red curve and dashed curves denote the median value of Liu’s AGN sample and the corresponding 1σ scatter.Measurements from the literature are presented using different symbols as indicated in the top left corner.Pluses are from Häring&Rix(2004)and Sahu et al.(2019),where the x-axis M*represents stellar mass in bulge or in early-type galaxies.Green filled circles are taken from Davis et al.(2018)for local spirals.Blue crosses are results for nearby galaxies from Reines&Volonteri(2015).Orange crosses are for all galaxy types extending to high redshifts (z <2.5) from Suh et al.(2020). As summarized in Table1,the scatter between the SMBH mass and stellar mass for elliptical galaxies and classical bulges are smaller than those for all galaxies types and those for disk galaxies.Results from Liu’s catalog include all galaxies types and have similar scatters to those reported in the literature. Table 1Summary of Previous Works on the MBH–M⋆Relation In this section,we use machine learning to investigate whether there is a tighter relation between the SMBH mass and galaxy properties other than stellar mass.The machine learning procedure is illustrated in Figure2. Figure 2.Methodology flowchart.The rounded rectangular boxes denote the data sets,and the rectangular boxes represent the operation performed.The arrows show the flow of data.We first perform feature selection according to the weights of the properties given by Lasso Regression,and then train the model based on the new feature set and present an empirical formula. The linear regression analysis is widely employed in statistics.It uses least square method to evaluate the linear relationship between features x and their dependent variabley:y=ωx+b,where ω denotes coefficients andbis a constant.The regression finds the optimal values of ω by minimizing the loss function:whereidenotes a row of data andnis the number of the row.However,reducing the loss function as such could result in an over-fitting problem.As a consequence,the final formula would be too complex and easily perturbed. Lasso (least absolute shrinkage and selection operator;Tibshirani1996) is a regression analysis originally formulated for linear regression models.It is advanced in interpreting statistical models by performing both variable selection and regularization.Based on the loss function of linear regression,Lasso regression introduces al1norm,i.e.,the sum of|ω|less than a certain number.The loss function is modified asThe linear limit pushes the absolute value of the coefficients to decrease,even down to zero.In practice,we use the Lasso algorithm from Scikit-Learn(Pedregosa et al.2011),and utilize GridSearchCV from Scikit-Learn to find the best λ.We also test some non-linear regressions and several other popular machine learning algorithms,including Multilayer Perceptron,Xgboost(eXtreme Gradient Boosting),and Ridge regression.We find their efficiency is similar to the Lasso regression method,yet the latter has the advantage to provide a fitting formula to approximate the results given by the machine learning. Here we use galaxy observables in the SDSS as input for the machine learning processes,which include the absolute magnitudes ing,r,i,andzband(Mg,Mr,Mi,Mz),g-r,r-i,i-z,andg-zcolor,ther-band surface brightness within half-light radiiR50,ΣR50,concentration (c=R90/R50,whereR90is the radii enclosing 90% Petrosian flux) and bulge fractionfracDev_rdetermined by the bulge-disk decomposition method usingrband.We do not apply attenuation corrections.Instead,we assume that the attenuation could be part of the constraint on the SMBH mass via their effects on luminosity and colors.We perform a test to correct intrinsic attenuation using CIGALE(Boquien et al.2019;Yang et al.2020) and find that the resulting RMSE is similar to what we find without taking into account the dust corrections.We ignore the dependence on redshift evolution because previous studies do not show strong evidence of evolution in theMBH–M⋆relation with time (e.g.,Cisternas et al.2011;Suh et al.2020).In addition,AGNs in Liu’s catalog lie in a very narrow redshift range,0 Samples in the data set are randomly shuffled and divided into two subsets:Subset A contains 75%of the population and Subset B contains the rest 25%.Subset B is regarded as the validation set.The distribution of the SMBH mass of Subset A is presented in Figure4.It peaks at 107.8M⊙and drops both at high masses and low masses.The decline at high masses is mainly caused by the decreasing number of massive structures as predicted by the standard cosmology model.At low masses,it could either be caused by the low fraction of AGN in low mass systems or be limited by the detection ability.The cost function is to estimate the total deviations from the true values.The result thus could be biased by the most abundant population,i.e.,both low mass and high mass SMBHs have a very low weighting in determining the machine learning results(see also Lin et al.2021).To avoid such bias we generate the training sample by randomly selecting the same number of SMBHs in each bin from Subset A,i.e.,1000 per 0.2 dex.For those bins with fewer than 1000 sources,we duplicate the sample to have an even distribution in SMBH mass as indicated by the green histogram in Figure4.We discard sources with SMBH mass less than 106.1M⊙or larger than 109.1M⊙to avoid shooting noises. Figure 3.The probability distribution function(PDF)of galaxy properties used for the machine learning.ΣR50 denotes the surface brightness within r-band half light radii,and c means the ratio of the 90%r-band light radii and the half light radii.Mg,Mr,Mi,and Mz are the absolute Petrosian magnitude.fracDeV_r represents the de Vaucouleurs component weight in the bulge-disk decomposition model. Figure 4.SMBH mass distributions.Blue and green histograms present the SMBH mass distributions of Subset A and the training sample,respectively.We transform the distribution of SMBH in Subset A into a uniform distribution of mass in the range from 106.1 M⊙to 109.1 M⊙to avoid the bias toward the most abundant population. We use the 11 variables as indicated in the last section to perform the machine learning and select a subset of the variables which have the highest contributions to reproduce the measured SMBH mass. We apply the Scikit-Learning on all of the 11 features and present in Figure5the predicted SMBH mass(hereafterMBH,pred)against the true SMBH mass(hereafterMBH,true).It shows a clear positive relationship between the predicted SMBH mass and the true values both for the training sample and for the validation sample.Training results work better at intermediate regimes as expected.The median value of the SMBH mass is somehow overpredicted at low masses and underpredicted at high masses.It is at least partly because there is not enough intrinsic variation of the data points and the results are highly biased by a small number of statistics,especially at low masses.The RMSE of the validation sample is 0.50 dex,somehow lower than those in training samples,0.55 dex.This is because the training samples have more weights at high and low masses where the training works less well.Given the fact that the intrinsic error in the SMBH is 0.35 dex,the accuracy is well enough. Figure 5.Predictions of Lasso regression based on all features in the training set(left)and the validation set(right).The solid red curves show the median values of the machine learning prediction,and the blue lines denote 1:1 ratio between the predicted masses and the true values.The corresponding RMSE is indicated in each panel. We further explore the correlation of the 11 parameters in Figure6.It shows thatMg,Mr,MiandMzare strongly correlated.It is because luminous galaxies are brighter in all bands,and vice versa.Interestingly,we findg-rcolor andg-zcolor are closely correlated.It could be due to the fact thatg-randg-zfall on the same side of big-blue-bump region(Shields1978;Malkan &Sargent1982). We compare the contribution of each feature by ranking their coefficients in Figure7.Since we use the normalized features,the coefficients are capable of indicating their contributions to the prediction.We notice that there is an obvious gap between the first six features and the rest of them.We thus keep thei-z,r-i,g-rcolors,Mg,ΣR50andcin our optimized feature space. We retrain the Lasso regression model utilizing the six selected features and present the result in Figure8.Like those with the full features,it shows that the six selected features have a similar ability in reproducing the SMBH mass both for the training sample and the validation sample.Quantitatively,the RMSE is 0.50 dex for the validation set,similar to the validation results based on the full features.This demonstrates that the feature selection is reasonable. Figure 6.Pearson correlation coefficients of the galaxy properties adopted in machine learning.Color bar shows the absolute correlation strength between two features,with 1 for the strongest correlation. Figure 7.The absolute coefficients in the result of Lasso regression.The feature values are normalized in the training processes.The coefficients thus represent the contributions of different properties. In Lin et al.(2021),they used Neural Network to predict the SMBH mass of quasars based on photometric luminosities and colors.The RMSE of 0.37 dex in their work is lower than ours.They only consider quasars whose luminosity overweight the starlight and more closely related to the SMBH. The Lasso linear regression provides the coefficients of the six features to predict the SMBH mass as follows:We compareMBH,predtoMBH,truefor the full sample in Figure9.Red curves denote the median value and the 1σ deviation.Interestingly,although the predicted SMBH masses deviate from the true values at high and low masses,when binned in the combined galaxy properties as indicated in thex-axis,the slope is close to one aboveMBH,pred=107M⊙,suggesting our model is appropriate for population studies.At low masses,the predicted mass is slightly higher,which could be due to the deficit of training samples at these masses. The 1σ scatter around the median value is about 0.48 dex,much smaller than the scatter (0.59 dex) in theMBH–M⋆relation in Liu’s AGN catalog(Figure1).The scatter is smaller than or comparable to those discovered by Davis et al.(2018),see also Sahu et al.(2019)and Suh et al.(2020),most of which performed more expensive dynamical measurements to obtain the SMBH mass.The scatter is somehow larger than those in Häring &Rix (2004).This is because they apply to the bulge and elliptical samples,while we include both spirals and elliptical galaxies. We further quantify the performance of our fitting formula using type 1 AGNs reported in SDSS DR14 (Abolfathi et al.2018) SPIDERS (SPectroscopic IDentification of eROSITA Sources,Coffey et al.2019) which is an SDSS-IV (Blanton et al.2017) X-ray selected AGN catalog,consisting of 7344 2RXS (Boller et al.2016) and 1157 XMM-Newton (Dwelly et al.2017) AGNs with masses measured using Mg II and Hβ emission lines(Coffey et al.2019).Only those with broad-line width greater than 800 km s-1AGNs are included in this catalog.We restrict our sample galaxies to havez<0.35 to avoid the possible evolution effect.The final sample contains 2799 AGNs. In Figure10,we present the relation between the SMBH mass (Coffey et al.2019) and the combined galaxy properties that we found.The RMSE is 0.50 dex,similar to the result based on Liu’s AGN catalog.The fitting formula performs very well in reproducing the type 1 AGNs from SDSS DR14,except for those belowMBH=107.5M⊙,where the training sample is too small.The data points are more concentrated with a smaller scatter of 0.42 dex. Figure 8.Predicted SMBH mass vs.true SMBH mass for the training set (left) and validation set (right) using the six selected features.Line types are the same as those in Figure 5. Figure 9.SMBH mass vs.the linear combination of the six selected galaxy properties provided by the machine learning for all samples in Liu’s catalog.No duplication of samples is performed.Red solid curve and dashed curves show the median value and the 1σ scatter. Figure 10.Same as Figure 9 but for the SDSS DR14 AGN catalog. In the past few decades,numerous AGNs have been discovered,which allows us to establish the relationship between the SMBH growth and their host galaxy evolution.The mass of SMBHs is a crucial element in such studies.We use machine learning to extract the relation between the SMBH mass and their host galaxy properties using a comprehensive AGN catalog based on SDSS DR7. We adopt a flexible and computationally efficient method,Lasso regression,which is powerful in variable selection.We find that colors,magnitude,surface density and concentration are most relevant in determining the SMBH mass.Based on the Lasso regression results,we provide an empirical formula to connect the SMBH mass and their host galaxy properties.The RMSE is 0.50 dex,comparable to the intrinsic uncertainty of 0.35 dex in the training data. Interestingly,though the RMSE is not very small,when binned in galaxy properties,the predicted SMBH mass and the true SMBH mass follow the 1:1 ratio between [107,108.5]M⊙.The scatter is 0.48 dex,much lower than the scatter in theMBH–M*relation.The machine learning results at high masses and low masses are somehow less accurate,which is mainly due to the poor intrinsic variance in the training samples at such masses. In order to validate the performance of the Lasso regression algorithm,we tried several popular machine learning methods,including Multilayer Perceptron,Xgboost,and Ridge regression.The Multilayer Perceptron is a class of feedforward artificial neural networks,composed of several layers of nodes.Xgboost is a popular gradient boosted trees algorithm.Ridge,similar to the Lasso regression,introduces thel2norm instead of thel1norm.The RMSEs are 0.49,0.52,0.50 dex,respectively.The results based on different models are similar.We choose Lasso regression for it is capable of feature selection and could provide a fitting formula.We also tried to do the intrinsic dust correction by CIGALE (Boquien et al.2019;Yang et al.2020),and the RMSE is 0.53 dex. Shankar et al.(2008) derived the SMBH mass function by estimating the SMBH mass from theMBH–M⋆relation.Using more galaxy properties,our formula could predict the SMBH mass more accurately.As a result,we could be able to provide more reliable SMBH mass functions.In combination with the AGN luminosity functions,it could also provide clues on the AGN duty cycles.In the future,we intend to collect more data at low and high masses.We will further divide samples into several subsamples according to their morphology which may improve the accuracy and reliability of the method.Using data from deeper surveys,we could also study the possible redshift evolution. Acknowledgments This work is supported by the National Key Research and Development of China (Grant No.2018YFA0404503),NSFC(Grant Nos.12033008 and 11988101),the K.C.Wong Education Foundation and the science research grants from the China·Manned Space Project with No.CMS-CSST-2021-A03.2.Data and Method
2.1.Data
2.2.Machine Learning Method
3.Results
3.1.Regression Results and Features Selection

3.2.Empirical Model
3.3.Application on DR14 AGN catalog
4.Conclusion and Discussion
杂志排行
Research in Astronomy and Astrophysics的其它文章
- Length Scale of Photospheric Granules in Solar Active Regions
- About 300 days Optical Quasi-periodic Oscillations in the Long-term Light Curves of the Blazar PKS2155-304
- Constraining Mass of M31 Combing Kinematics of Stars,Planetary Nebulae and Globular clusters
- The First Photometric Study of W UMa Binary System V1833 Ori
- On the Jet Structures of GRB 050820A and GRB 070125
- Solar Flare Forecast Model Based on Resampling and Fusion Method