Observed Frequent Occurrences of Marine Heatwaves in Most Ocean Regions during the Last Two Decades
2022-08-13XiaojuanZHANGFeiZHENGJiangZHUandXingrongCHEN
Xiaojuan ZHANG, Fei ZHENG, Jiang ZHU, and Xingrong CHEN
1International Center for Climate and Environment Sciences, Institute of Atmospheric Physics,Chinese Academy of Sciences, Beijing 100029, China
2University of Chinese Academy of Sciences, Beijing 100049, China
3Collaborative Innovation Center on Forecast and Evaluation of Meteorological Disasters,Nanjing University of Information Science and Technology, Nanjing 210044, China
4National Marine Environmental Forecasting Center, Beijing 100081, China
ABSTRACT Marine heatwaves (MHWs) are prolonged high-temperature extreme events in the ocean that can be devastating to marine life and seriously impact climate systems and economies. This paper describes the accessibility, content,characteristics, and potential applications of an MHW dataset to facilitate its use in scientific research. Daily intensities of global MHWs from 1982 to 2020 were analyzed using gridded SST data sourced from the National Oceanic and Atmospheric Administration (NOAA) Optimum Interpolation (OI) SST V2 high-resolution (0.25°) dataset. The analysis shows a linear increase in the frequency of MHWs in most ocean regions of the world as well as significant interdecadal changes. This data product can be used as a basic dataset to study the seasonal to decadal changes in extreme ocean events and explore the effects of global warming on the surface layers of oceans during the last 40 years.
Key words:marine heatwave,daily intensity,linear trend,climate extremes

Dataset profile Dataset title A daily dataset of global marine heatwaves from 1982 to 2020 Corresponding author Fei ZHENG (zhengfei@mail.iap.ac.cn)Time range 1982–2020 Geographical scope Global Data format 2D dataset for NETCDF file (.nc)Data volume 122 Mb for the daily MHW intensity Data service system http://www.scidb.cn/en/s/nqauYn DOI: 10.11922/sciencedb.00872 Source(s) of funding Key Research Program of Frontier Sciences, CAS (Grant No. ZDBS-LY-DQC010); National Natural Science Foundation of China (Grant No. 41876012); Strategic Priority Research Program of the Chinese Academy of Sciences (Grant No. XDB42000000) National Key R&D Program of China 2018YFB0505000 Dataset composition MHW dataset comprises 468 files, with 12 files per year between 1982 and 2020
1.Introduction
Heatwaves are important extreme climatic events in the atmosphere and oceans. Marine heatwaves (MHWs) are defined as extremely warm sea surface temperature (SST)events that last from several days to several months or even longer, ranging from several kilometers to several thousand kilometers in size (Oliver et al., 2018; Holbrook et al.,2019). Under the influence of global warming, MHWs that constantly refresh the record have a serious impact on the climate system and social economy (e.g., Oliver et al., 2017;Smale et al., 2019; Cheung et al., 2020; Coleman et al.,2020; Piatt et al., 2020).
Discrete climate events can promote gradual changes in the distribution of species and can ultimately affect the structure and function of ecosystems (Jentsch et al., 2007; Wernberg et al., 2013). Recent research results have indicated that MHWs will become increasingly frequent and extreme under global warming conditions, likely pushing marine organisms and ecosystems to the limits of their resilience and even beyond, which could cause irreversible changes(Frölicher et al., 2018; Arafeh-Dalmau et al., 2019; Coleman et al., 2020). In recent years, multiple significant MHWs that have caused devastating changes to marine ecosystems have been reported around the globe (Laufkötter et al.,2020). These include MHW events near the coast of Western Australia in 2011 (Pearce and Feng, 2013), the Northwest Atlantic in 2012 (Scannell et al., 2016), the Northeast Pacific Ocean in 2014–16 and 2019 (Bond et al., 2015; Di Lorenzo and Mantua, 2016; Amaya et al., 2020; Piatt et al.,2020), and waters around tropical Australia in 2015/2016(Oliver et al., 2017; Benthuysen et al., 2018). These extreme temperature events have caused coral bleaching(Wernberg et al., 2013; Dalton et al., 2020) and the largescale transfer and high mortality rates of marine species(Garrabou et al., 2009; Frölicher and Laufkötter, 2018;Smith et al., 2019; Cheung et al., 2020).
Current research has revealed that surface MHWs are the direct result of local-scale processes acting within the mixed layer (e.g., ocean heat advection, air-sea interactions,or vertical mixing), and MHWs can be modulated by remote influences (e.g., climate modes such as ENSO) and their teleconnections (Holbrook et al., 2019). As such, the mechanisms by which MHWs are generated and maintained are complex. For example, the mixed layer heat budget contributes to the South China Sea (SCS) SST warming trend;studies have shown that warm advection from the southern SCS in 1998/99 and from the Kuroshio intrusion in 2006/07,induced by anomalous ocean currents, is likely the major contributor to warming of the subsurface water in SCS (Xiao et al., 2018, 2019). Increased insolation may play an additional role in warming the near-surface ocean (Gupta et al., 2020).A previous study (Wei et al., 2021) found that the record-setting MHW that occurred along the coast of Southern and Baja California in August 2018 resulted from the superposition of “weather-timescale” warming by coastal wind relaxation and intraseasonal warming caused by coastally trapped waves. Another study shows that the extreme warming in SCS during 2015/2016 was related to an unusual Indian ocean dipole event (Xiao et al., 2020). This illustrates that the analysis of atmospheric and ocean processes at different timescales can lead to a better understanding of the formation mechanisms of strong MHWs. Due to the complexity of the mechanism affecting MHWs, the prediction of MHWs is also a great challenge. A study by Hu et al. (2017)on the predictions of a continuous warm blob in the Northeast Pacific also shows that the prediction of the evolution of warm events is promising but difficult, especially for their growth, which is consistent with unpredictable atmospheric variability.
The public is increasingly aware of the importance of MHWs, yet the scientific understanding of MHWs is still in the exploratory stage. To date, many different definitions of MHWs have been proposed. Most early studies of SST anomalies were generated from monthly datasets, thus eliminating shorter but usually more intense events (Wernberg et al., 2013). Subsequent studies gradually set a high SST threshold as a fixed threshold, but this method only applies to small research areas (Waliser, 1996). Hobday et al. (2016)proposed a new widely used MHW definition based on the study of atmospheric heatwaves. In this study, the definition of MHWs by Hobday et al. (2016) is used to identify and quantify MHWs from daily temperature measurements and to ultimately establish a high-spatiotemporal-resolution database of global MHWs from 1982 to 2020. This database can be used as a basic dataset to study the seasonal to decadal changes in extreme ocean events and explore the effects of global warming on the surface layers of oceans during the last 40 years.
The remainder of this paper is organized as follows. Section 2 describes the definition and calculation method of MHW, and the characteristics of MHWs. Section 3 assess the reliability of the dataset from two aspects. Section 4 illustrates the meaning and potential applications of the dataset.Finally, Section 5 provides a summary and prospects for future work.
2.Definition and calculation method of marine heatwaves
Considering that marine ecosystems are greatly affected by extreme sea temperature anomalies, research on extreme SST anomalies started very early, and many different indicators have been used thus far to assess extremely high marine temperatures. For example, the maximum SST is used to study coral bleaching (Berkelmans et al., 2004).Sorte et al. (2010) used a defining method of atmospheric heatwaves to define MHWs as periods during which the average temperature or maximum temperature is at least 3°C to 5°C higher than normal and lasts for at least 3 to 5 days. Conversely, Wernberg et al. (2013) defined a warming anomaly with an SST 2.5°C higher than the climatic average or more as an MHW. Subsequent studies computed the 99th percentile of the analyzed year and then expressed MHWs as an anomaly with respect to the average August temperature(Marbà et al., 2015). Most previous definitions of MHWs were derived from monthly datasets with low resolutions that obscured shorter but usually more intense events. These definitions cannot be applied to studies comparing regions and ecosystems.
According to the characteristics of an MHW (a discrete and prolonged anomalous warm water event in a particular location) and inspiration from atmospheric heatwave research, Hobday et al. (2016) proposed a new definition of MHWs that has been widely used in recent years: MHWs are anomalous warming events that last for five or more days, with daily temperatures higher than the 90th percentile over a 30-year historical baseline period. Based on using the global daily remotely sensed National Oceanic and Atmospheric Administration (NOAA) Optimum Interpolation (OI)SST V2 high-resolution (0.25°) gridded SST data obtained from 1982–2020 (Reynolds et al., 2007), and referencing the definition of MHWs by Hobday et al. (2016), this study calculates the MHWs from 1982 to 2020. Figure 1a shows the SST in November at a grid point in the Pacific Ocean(20°N, 150°E) from 1982 to 2020. As shown in Figure 1a,the definition of an MHW is relative to the 90% SST threshold, which is the same as the defined threshold in previous studies. This is deemed suitable for detecting “extreme”events in most areas. Using this method, there is a threshold for each grid point every day; therefore, MHWs from different regions can be directly compared. Figure 1b is a schematic diagram of the definition of MHWs. This study defines the period when SST is above the threshold (based on 1983–2012) for at least five consecutive days as an MHW event; the intensity is calculated based on the difference between SST and the 1983–2012 climatological mean. For leap years, the threshold of 29 February is calculated based on the 90th percentile of the SST for the three days of 28 February, 29 February, and 1 March. The parameters used to describe the characteristics of an MHW include the duration (time between the start and end dates (i.e., duration =T_end – T_start), the cumulative intensity (sum of daily intensities during the MHW), the average intensity (cumulative intensity divided by the duration of the event) and the maximum intensity (maximum daily intensity during the MHW).Figure 1c shows an example of an MHW assessment at a grid point in the Pacific Ocean (20°N, 150°E) from 2010 to 2017, showing that the threshold varies daily during the year and that MHWs have obvious seasonal and interannual changes. Our definition of MHWs is slightly modified from the previous definition of MHWs, in two main aspects. The first modification deviates from the previous definition of MHWs (Hobday et al., 2016) in that we adopted a more realistic threshold and climatological mean calculated from the original data without any smoothing because a smoothed climatology can artificially amplify the intensity and extend the duration of MHW events. The other modification concerns the adjustment in the calculation for leap years that was not included in the previous study (Oliver et al., 2017). Thus,we further included the calculation of MHWs on 29 February in leap years. In this way, the daily MHWs of normal years and leap years can be reasonably obtained to analyze the daily change process of MHW. Compared with the definition of MHW by Hobday et al. (2016), the MHW calculated by our method may have a lower frequency and weaker cumulative intensity based on a more reasonable definition of the climatological mean.
Based on the above analysis, the characteristics of MHWs are known as either “anomalously warm”,“discrete”, or “prolonged”. Specifically, “anomalously warm” is defined as a temperature that is above a baseline climatology threshold, “discrete” implies that MHWs have clear start and end dates and are identifiable events, and “prolonged” indicates that the duration of the event is at least five days. Additionally, marine organisms respond quickly to extreme events such as MHWs. Therefore, daily and finerresolution grid data are more valuable for analyzing daily variations in MHWs. To study the changes that occur in MHWs on different time scales during the last 40 years and their impacts on the surface layers of oceans, we saved the daily MHW intensity data in the database Science Data Back(http://www.scidb.cn/en/s/nqauYn). The saved dataset presents the daily intensity of global MHWs from 1982 to 2020 and is stored in NETCDF format with a horizontal resolution of 0.25° × 0.25° and a daily time step. For the period without MHWs, the data are stored as 0. Other commonly used MHW characteristics, such as maximum intensity, duration, frequency, and cumulative intensity, can be calculated based on the provided daily MHW intensity data. The frequency can be obtained by the sum of the number of occurrences of MHWs, and the duration is the number of days between the start and end times of the MHW. The maximum intensity can be obtained by finding the maximum value of the daily MHW intensity, and the cumulative intensity can be calculated by summing the daily MHW intensities. For example, the cumulative intensity of monthly and yearly MHWs can be obtained by summing the daily MHW intensities for the month or year.
3.The reliability of the MHW dataset
The reliability of the MHW data is mainly assessed from two aspects. One of these aspects was the selection of the observation data used to calculate the MHWs, and the other involved the verification of MHW data. Considering the first aspect, Hobday et al. (2016) compared the MHWs calculated with SST data with different resolutions and different time scales. They found that the MHWs calculated by all datasets had similar evolutionary characteristics except for differences in intensity. This is due to daily variability in the logger data, as it is smoothed at coarse spatial (1° grid)and time (monthly and weekly) resolutions. Therefore, the data used in this study were high-resolution SST observation data that have been widely used in MHW research in recent years so that both strong and weak MHWs are correctly detected in observational data, making the MHW data more reliable. Another aspect of the reliability analysis of MHW data is mainly based on the checking of the dataset. For example, four better-known MHW regions were selected based on the cumulative intensity of MHWs in 2020 to illustrate the reliability of the MHW dataset. First, the cumulative intensity of MHWs in 2020 was calculated according to the MHW dataset. Figure 2 shows that MHWs were detected in nearly half of the oceans in the world, with the eastern Arctic Ocean having the highest cumulative intensity. Then, according to the area with the highest cumulative intensity of MHWs in 2020, four areas in the four oceans were selected:the EAL (Eastern Arctic Location), NEPL (Northeast Pacific Location), NWAL (Northwest Atlantic Location),and CIL (Central Indian Ocean), representing the nearby areas. Finally, the changes in MHWs in the four areas from 1982 to 2020 were analyzed.
The changes in the MHWs at the above four points in 2020 and the changes in the total days, maximum intensities,and cumulative intensities of MHWs from 1982 to 2020 are given in Fig. 3. The durations of MHWs in the EAL and NEPL regions reached several months in 2020 (Figs. 3a, b).In contrast, the MHWs in the NWAL and CIL regions had shorter durations and higher frequencies (Figs. 3c, d). For the EAL area, the total days, maximum intensities, and cumulative intensities of MHWs reached maximum values from 1982–2020 in 2020. Since the EAL is located in the eastern Arctic, the MHW here is strongly correlated with sea ice(Hu et al., 2020). The maximum cumulative intensity in the EAL may be affected by the variation in sea ice coverage.The attributes of MHWs in the EAL area indicate a significant growth trend after 2005, which may have been affected by the Arctic amplification effect associated with global warming (Figs. 3e, i, m). This rapid increase in Arctic MHWs was consistent with the discussion in previous literature (Hu et al., 2020). For the NEPL area, the total days and cumulative intensities of MHWs increased significantly in the past ten years, with the greatest number of MHW days and cumulative intensities occurring in 2016 (Figs. 3f, n). This result is consistent with the 2015–16 MHW in the Northeast Pacific that caused severe marine ecological damage, as recorded in the literature (Piatt et al., 2020). The maximum intensity of MHWs in 2019 was the highest in the period considered but with a lower total number of MHW days and a lower cumulative intensity (Fig. 3j). These statistics were related to the 2019 Northeast Pacific event discussed in the relevant literature (Amaya et al., 2020). For the NWAL area, the total days and cumulative intensities of MHWs also increased in the past ten years. The maximum total days and highest cumulative intensity occurred in 2012, but the highest maximum intensity value occurred in 2008 (Figs. 3g, k, o). The first statistic was influenced by the 2012 Northwest Atlantic MHW (Scannell et al., 2016). For the CIL area, each attribute of MHWs reached a maximum in 2019, and the total days and cumulative intensity increased during the evaluated period (Figs. 3h, l, p). The collective analysis of the four case study regions demonstrates that the MHW dataset can accurately detect abnormal warm water events and can be used to analyze different attributes of MHWs.
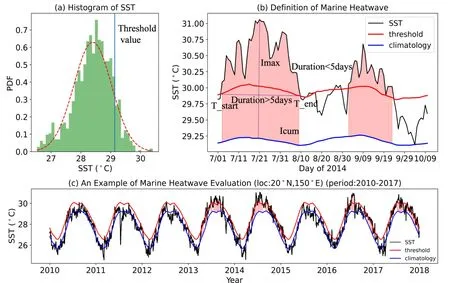
Fig. 1. Schematic diagrams used to define a marine heatwave (MHW). Panel (a) outlines the selection of threshold values. The red dashed line represents the probability density function (PDF) of SST in November at a grid point in the Pacific Ocean (20°N, 150°E) from 1982 to 2020, and the blue straight line is the threshold value defined based on the 90th percentile value of each day at each location. Panel (b) is used to define a marine heatwave. The period when the SST (black line) is above the threshold (red line) for at least five consecutive days is defined as a MHW event. Intensity is calculated based on SST minus climatological mean (blue line), icum “the cumulative intensity”(shading) is the sum of daily intensities during a MHW, and imax is the maximum daily intensity during a MHW.T_start and T_end represent the start day and end day of a MHW, respectively. Panel (c) is an example of marine heatwave evaluation. The red shading represents the detected MHWs.
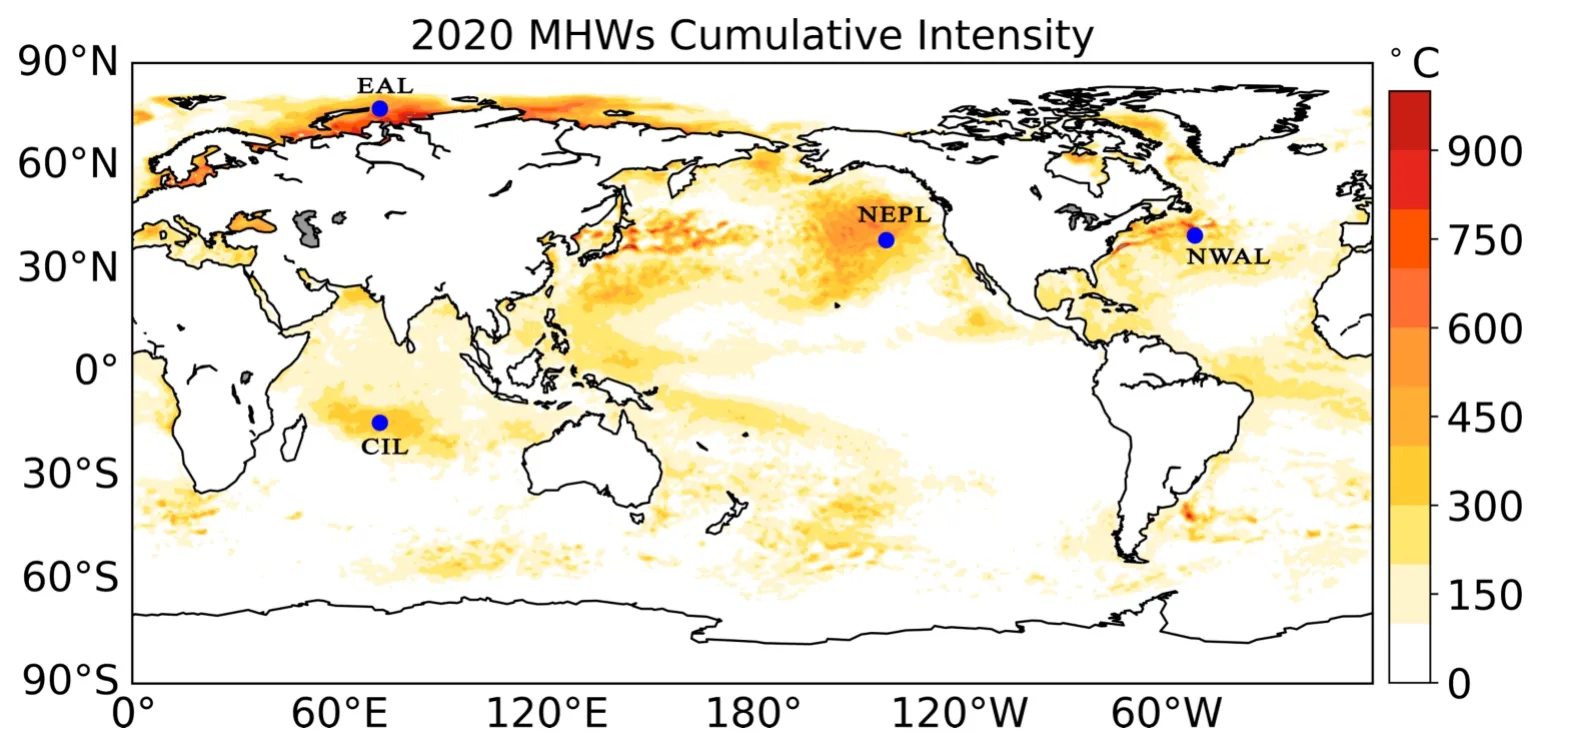
Fig. 2. Cumulative intensity of MHWs in 2020. The blue dots labeled CIL, NEPL, NWAL, and EAL represent the Central Indian Ocean location (15°S, 71°E), Northeast Pacific location (40°N,140°W), Northwest Atlantic location (42°N, 55°W), and eastern Arctic location (75°N, 70°E),respectively.

Fig. 3. Attribute analysis of MHWs from 1982–2020 in the EAL, NEPL, NWAL, and CIL regions. Panels (a)–(d) represent the MHWs of EAL, NEPL, NWAL, and CIL in 2020, respectively. Panels (e)–(h) show the total days in the corresponding area. Panels(i)–(l) is the maximum intensity of the corresponding area. Panels (m)–(p) display the cumulative intensity of the corresponding area.The red histogram represents the strongest event of the corresponding attribute.
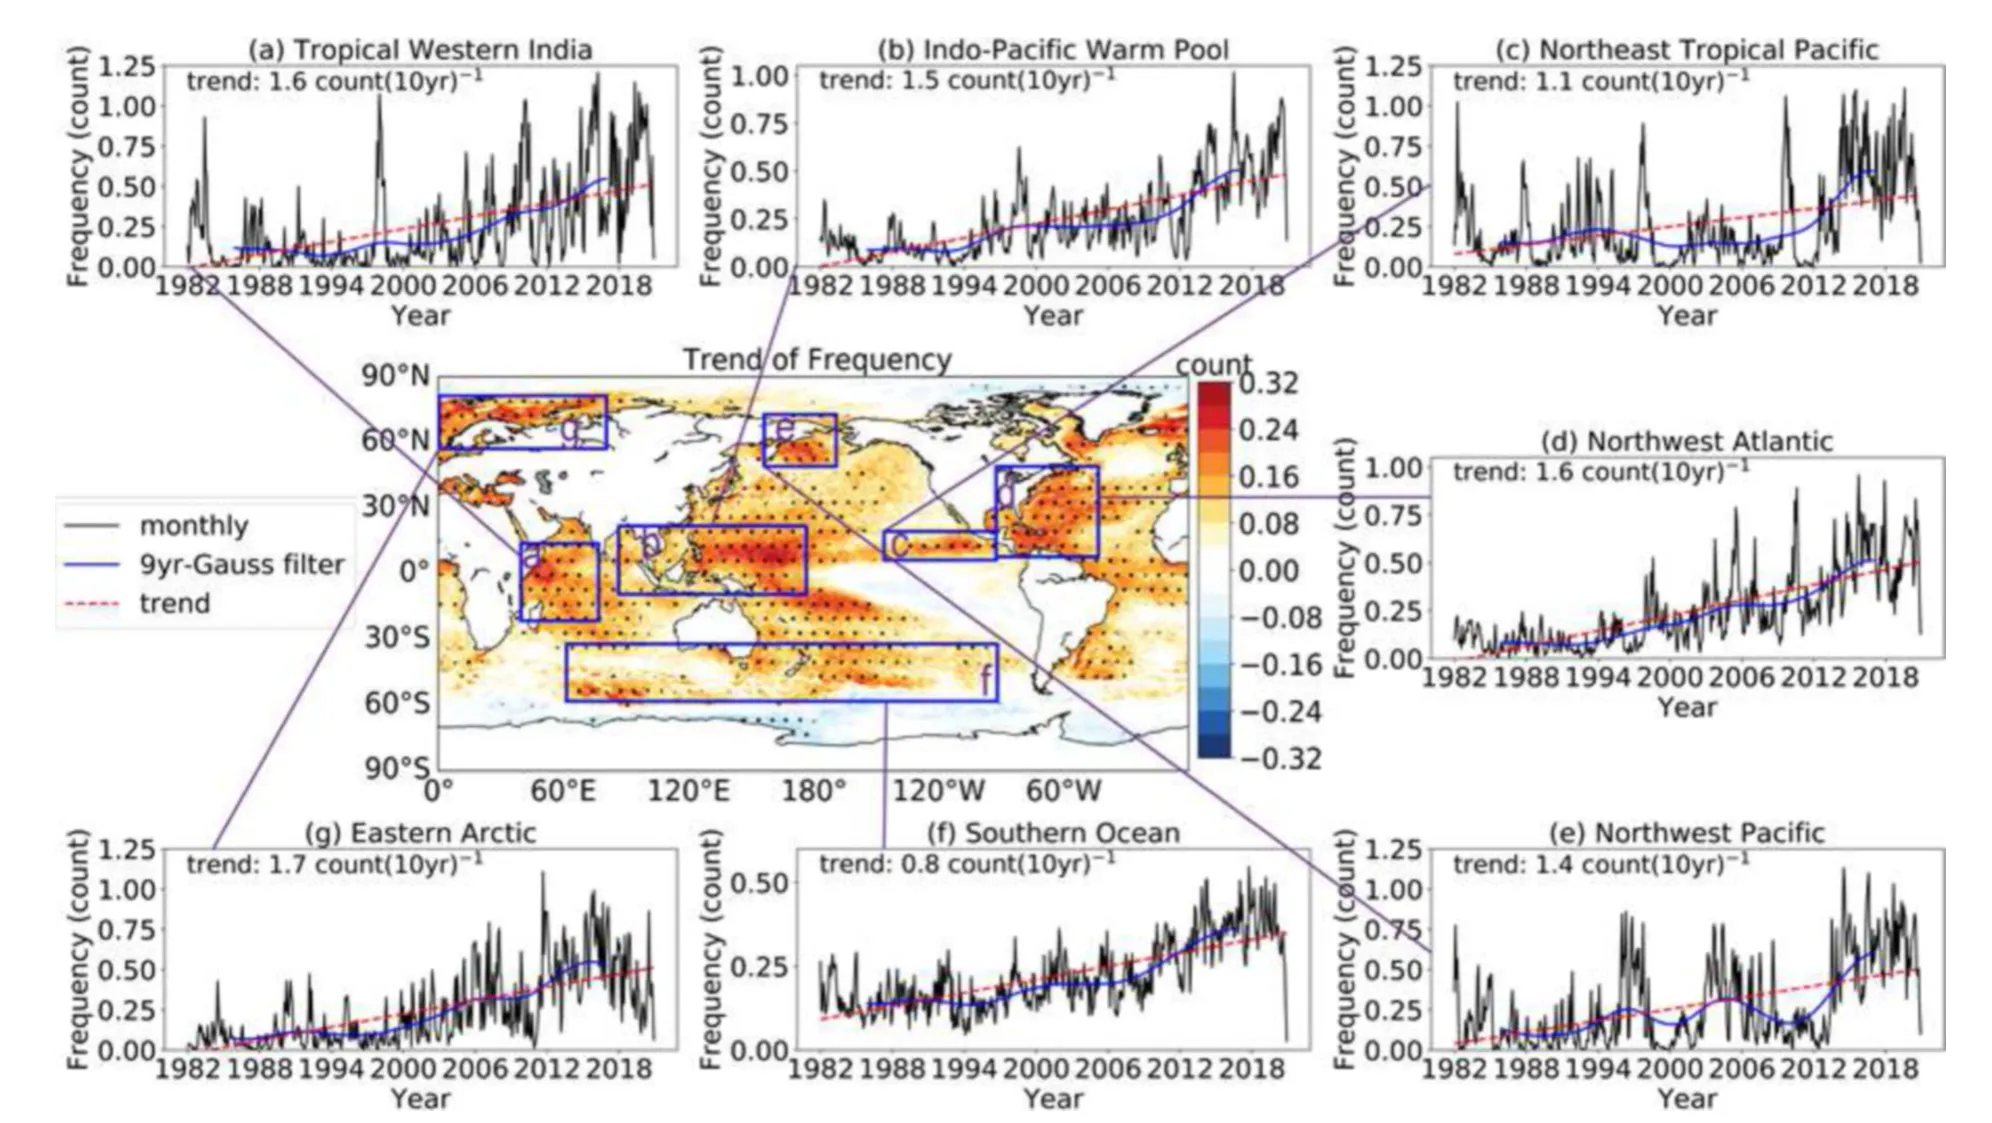
Fig. 4. The linear trend and the time series of MHW frequency. The spatial map is the annual linear trend of the global MHW frequency, and the purple boxes indicate the selected key areas: Tropical Western India (20°S–10°N, 40°–70°E), Indo-Pacific Warm Pool (10°S–25°N, 90°–180°E), Northeast Tropical Pacific (5°–20°N, 140°–90°W), Northwest Atlantic (10°–50°N, 90°–40°W), Northwest Pacific (50°–70°N, 160°E–160°W), Southern Ocean (60°–30°S, 60°E–80°W), and eastern Arctic (50°–70°N, 0°–80°E). Panels (a)–(g) represent the time series of MHW frequencies in different key areas. The black line represents the monthly MHW frequency, the blue line represents its 9-year Gaussian filtering, the red dotted line represents the linear trend, and the upper left number represents the interdecadal trend.

Fig. 5. Characteristics of MHW attributes of the world’s four largest fishing grounds from 1982 to 2020. Panels (a)–(d) represent the annual cumulative intensity of MHWs of the four major fishing grounds. Panels (e)–(h) represent the distributions of the frequency corresponding to the fishing ground. Panels (i)–(l) represent the distributions of the total days corresponding to fishing grounds. The red line is the 9-year Gaussian filter corresponding to different attributes.
4.Applications of the MHW dataset
This study aims to introduce a dataset describing MHWs. The calculations, methods, and quality tests have already been introduced above. Below, the meaning and potential applications of the data are discussed. The significance of this data product is that it can be used as the basic dataset to study the seasonal to interdecadal changes in different attributes of MHWs, the physical mechanisms of MHWs, and the ecological impacts of MHWs in recent decades. Two examples illustrating the potential applications of these data are described below. For the first example, the monthly and annual frequencies of MHWs were calculated according to the MHW dataset, and the ordinary least squares (OLS) method was used to analyze changes in MHW frequencies from 1982 to 2020. Figure 4 shows that the strongest linear increases in MHW frequencies occurred in the equatorial western Pacific warm pool area, the Northwest Atlantic, and the eastern Arctic Ocean, with an average annual linear increase of 0.3 events per year. Previous studies have shown that stronger MHWs may be caused by global warming (Oliver et al., 2018). Recent studies have shown that most upwelling areas have less warming than other ocean areas; therefore, upwelling can slow the occurrence of MHWs (Varela et al., 2021). From the analysis of the MHW frequency in seven key areas, the frequencies in all key areas show clear linear growth trends and experience significant interannual and interdecadal changes. Although the increasing trend of MHW frequency is simply presented by a linear fitting in this work, more reasonable trend fitting,such as quadratic fitting, etc., can also reflect the abrupt change that occurred around 2000. Among these areas, the Northeast Arctic Ocean has the fastest linear growth rate,with an average increase of 1.7 events per decade, followed by the Indo-Pacific Warm Pool, the Northwest Atlantic, and the tropical western Indian Ocean, with average increases of 1.5–1.6 events per 10 years. The region with the slowest linear growth is the Southern Ocean (Figs. 4a–g). In summary,MHWs have occurred more frequently in most ocean areas in the past two decades.
As another example of the potential application of the data, a comparison of the attributes of MHWs in the world’s four major fishing grounds from 1982 to 2020 is described below. The four major fishing grounds are the Hokkaido Fishing Grounds, North Sea Fishing Grounds, Newfoundland Fishing Grounds, and Peru Fishing Grounds. Except for the Peru Fishing Grounds, which are formed by an upward compensation current, the other three fishing grounds are formed by the convergence of warm and cold currents.Figure 5 shows the average annual cumulative intensity, the regionally-averaged change in annual frequency, and the annual total MHW days in the four fishing grounds from 1982 to 2020. The annual average cumulative intensity of MHWs in the Newfoundland Fishing Grounds was the strongest, with a maximum value reaching 280°C, far exceeding those of the other three fishing grounds (Figs. 5a–d).Given the annual regional average MHW frequency and 9-year Gaussian filtering, all fishing grounds had significant interannual and interdecadal changes. The North Sea Fishing Grounds reached the highest frequency (more than 9 events)in 2014. Notably, the MHW frequencies in all fishing grounds had linear growth trends. The Newfoundland Fishing Grounds had the strongest linear growth trend, with an average increase of 1.6 times per decade, while the Peru Fishing Grounds had an insignificant growth trend (Figs. 5e–h). The total days of MHWs in all fishing grounds also had significant interannual and interdecadal variabilities. Among them, the Peru Fishing Grounds had the strongest amplitude variations which may have been due to the influence of the interannualscale climate signal ENSO. For the long-term trend of total MHW days, in addition to the weak negative trend in the Peru Fishing Grounds, the other three fishing grounds demonstrated a significant growth trend, among which the Newfoundland Fishing Grounds was most significant, with an average increase of 29 days per decade (Figs. 5i–l). The MHWs of the three fishing grounds where the cold and warm currents converge had significant growth trends in recent decades. In contrast, the growth of MHWs in the Peru Fishing Grounds was not significant, and even the total days had weak negative growth, indicating that upwelling may slow down the production of MHWs (Varela et al.,2021). The two examples given above represent simple applications of the MHW dataset. Additionally, the MHW dataset can also be used to calculate other attributes of MHWs, such as their duration and average intensity, at different temporal and spatial scales.
5.Summary and prospects
The MHW dataset is a unique MHW database with a high temporal and a spatial resolution with global coverage.It contains MHW intensities from 1982 to 2020 with a horizontal resolution of 0.25° × 0.25° and a daily time step. This database can provide basic scientific support for researchers studying extreme ocean events. The dataset can also support fisheries and other relevant study areas. The dataset is archived in the Science Data Bank (https://www.scidb.cn/en/s/nqauYn). In addition, we will provide consistent real-time updates to the dataset in the future. Since the spatial extent of anomalous SST warming was not considered when defining MHWs, the spatial extent of the SST anomaly will be considered when estimating the uncertainty of the calculated MHWs in future work. Because the uncertainty of MHWs mainly comes from the SST products, we intend to repeat our calculations based on multiple sets of high-resolution SST data (e.g., OSTIA, etc.) to analyze the uncertainty of MWH calculations. Furthermore, the selection of the threshold used to define MHWs is a gradual and evolutionary process. Generally, the characteristics of MHWs are sensitive to the selection criteria, and there are some differences in certain characteristics (frequency and duration, etc.)of MHWs detected by different thresholds. Inspired by atmospheric heatwave research, previous studies (e.g., Hobday et al., 2016; Oliver et al., 2018; Coleman et al., 2020; Varela et al., 2021) have mostly used a 90% threshold to define MHWs, which can reasonably analyze significant MHW events in different regions and their impact on ecology. A higher threshold (such as the 99% threshold) may filter out typical MHWs with important physical processes. Therefore,the definition of MHWs here is selected based on the 90%threshold that changes with the seasons, which can detect abnormally warm events. Due to the significant warming in the ocean, a longer climatology may influence the identification of MHWs.
Acknowledgements.This work was supported by the Key Research Program of Frontier Sciences, CAS (Grant No. ZDBSLY-DQC010), the National Natural Science Foundation of China(Grant No. 41876012), the Strategic Priority Research Program of the Chinese Academy of Sciences (Grant No. XDB42000000), and the National Key R&D Program of China 2018YFB0505000.NOAA High-Resolution SST data were provided by the NOAA/OAR/ESRL PSD, Boulder, Colorado, USA, from their Web site at http://www.esrl.noaa.gov/psd/. The authors wish to thank two anonymous reviewers for their very helpful comments and suggestions.
Data availability statement and sharing policy.The data that support the findings of this study are openly available in the Science Data Bank at https://www.scidb.cn/en/s/nqauYn (doi:10.11922/sciencedb.00872). Users are encouraged to download and share the datasets. All the datasets are free.
Disclosure statement.No potential conflicts of interest are reported by the authors.
Open AccessThis article is licensed under a Creative Commons Attribution 4.0 International License, which permits use, sharing,adaptation, distribution and reproduction in any medium or format,as long as you give appropriate credit to the original author(s) and the source, provide a link to the Creative Commons licence, and indicate if changes were made. The images or other third party material in this article are included in the article’s Creative Commons licence, unless indicated otherwise in a credit line to the material.If material is not included in the article’s Creative Commons licence and your intended use is not permitted by statutory regulation or exceeds the permitted use, you will need to obtain permission directly from the copyright holder. To view a copy of this licence,visit http://creativecommons.org/licenses/by/4.0/.
杂志排行
Advances in Atmospheric Sciences的其它文章
- Erratum to: Stratospheric Ozone-induced Cloud Radiative Effects on Antarctic Sea Ice
- Correction to: Correlation Structures between Satellite All-Sky Infrared Brightness Temperatures and the Atmospheric State at Storm Scales
- Seasonal Predictions of Summer Precipitation in the Middle-lower Reaches of the Yangtze River with Global and Regional Models Based on NUIST-CFS1.0
- Spatiotemporal Variations of Microwave Land Surface Emissivity(MLSE) over China Derived from Four-Year Recalibrated Fengyun 3B MWRI Data
- Energy Paths that Sustain the Warm-Sector Torrential Rainfall over South China and Their Contrasts to the Frontal Rainfall: A Case Study
- Effects of Drag Coefficients on Surface Heat Flux during Typhoon Kalmaegi (2014)