Seasonal Predictions of Summer Precipitation in the Middle-lower Reaches of the Yangtze River with Global and Regional Models Based on NUIST-CFS1.0
2022-08-13WushanYINGHuipingYANandJingJiaLUO
Wushan YING, Huiping YAN, and Jing-Jia LUO
Institute for Climate and Application Research (ICAR)/ILCEC, Key Laboratory of Meteorological Disaster,Nanjing University of Information Science and Technology, Nanjing 210044, China
ABSTRACT Accurate prediction of the summer precipitation over the middle and lower reaches of the Yangtze River (MLYR) is of urgent demand for the local economic and societal development. This study assesses the seasonal forecast skill in predicting summer precipitation over the MLYR region based on the global Climate Forecast System of Nanjing University of Information Science and Technology (NUIST-CFS1.0, previously SINTEX-F). The results show that the model can provide moderate skill in predicting the interannual variations of the MLYR rainbands, initialized from 1 March. In addition, the nine-member ensemble mean can realistically reproduce the links between the MLYR precipitation and tropical sea surface temperature (SST) anomalies, but the individual members show great discrepancies, indicating large uncertainty in the forecasts. Furthermore, the NUIST-CFS1.0 can predict five of the seven extreme summer precipitation anomalies over the MLYR during 1982–2020, albeit with underestimated magnitudes. The Weather Forecast and Research(WRF) downscaling hindcast experiments with a finer resolution of 30 km, which are forced by the large-scale information of the NUIST-CFS1.0 predictions with a spectral nudging method, display improved predictions of the extreme summer precipitation anomalies to some extent. However, the performance of the downscaling predictions is highly dependent on the global model forecast skill, suggesting that further improvements on both the global and regional climate models are needed.
Key words:seasonal forecast,summer precipitation,global climate model,WRF downscaling
1.Introduction
The middle and lower reaches of the Yangtze River(MLYR), one of the most densely populated regions in China, has suffered from large interannual variations of precipitation in summer. Abnormal precipitation over the MLYR region, especially extreme events such as floods or droughts, often causes tremendous losses to the economy,environment, and society. For example, in summer 2020,the great Yangtze River flood caused about USD$11.75 billion loss and 141 dead or missing (e.g., Gan, 2020). Thus, a skillful prediction of such disasters is crucial for policy making as well as disaster prevention, which would help significantly alleviate the damages. However, skillful seasonal forecasting of the MLYR summer precipitation, which is governed by the highly varying East Asian summer monsoon system (EASM) and complicated multiscale atmosphere–ocean–land–ice processes and their interactions, is challenging (e.g., Ding and Chan, 2005; Wang et al., 2015).
Different from weather forecasts, which is a problem of atmospheric initial values, the source of seasonal predictability of the atmosphere primarily comes from external boundary forcing, such as sea surface temperature (SST), soil moisture, and sea ice (e.g., Luo et al., 2016). In addition, seasonal predictions usually focus on monthly or seasonal mean anomalies relative to their climatological values, such as temperature or precipitation anomalies, which reflects the interannual variations of the climate system. On the Earth, the most pronounced interannual climate phenomenon is El Niño-Southern Oscillation (ENSO), which has large impacts on global weather and climate (e.g., Luo et al.,2008; Cai et al., 2019; Ren et al., 2019; Yang et al., 2021).The summer precipitation over the MLYR region can be significantly affected by the tropical Pacific ENSO via triggering an abnormal anticyclone/cyclone over the western North Pacific (WNP, Wang et al., 2000). The impacts can be modulated by the SST anomalies in the Indian Ocean, as a capacitor of ENSO, to prolong the anomalous circulation over the WNP (e.g., Xie et al., 2009, 2016; Tang et al., 2021; Zhou et al., 2021). In addition, the tropical Atlantic SST anomalies can also influence the EASM with a westward-propagated atmospheric teleconnection through the Walker Circulation(e.g., Jin and Huo, 2018). Besides the impacts of tropical SST anomalies, many extratropical signals can also influence the MLYR summer precipitation, including snow cover in Eurasia and the Tibetan Plateau, blocking highs in high-latitudes of Eurasian continents, perturbations of the Asian westerly jet, and so on (e.g., Li et al., 2001; Zhang et al., 2001;Lu, 2004; Wu et al., 2009; Chen and Zhai, 2014; Chen et al.,2019).
Although tremendous effort has been put toward developing statistical and/or dynamical modeling methods to predict MLYR precipitation anomalies, prediction skill remains quite limited (e.g., Fan et al., 2007; Ren et al., 2019). In recent decades, dynamical seasonal forecast systems based on coupled global climate models (CGCMs) have been developed and rapidly improved. CGCMs can successfully forecast ENSO and large-scale atmospheric circulations associated with tropical SST anomalies at seasonal-to-interannual time scales, including the Pacific-Japan (PJ) pattern (e.g., Wang et al., 2009; Kosaka et al., 2012; Martin et al., 2020).Among the CGCMs, the Climate Forecast System of Nanjing University of Information Science and Technology (NUISTCFS1.0, previously SINTEX-F) has displayed good performance in predicting tropical SST anomalies in the Pacific and Indian Oceans, especially ENSO events, at lead times of up to two years (e.g., Luo et al., 2005a, 2007, 2008; He et al., 2020). However, how well the NUIST-CFS1.0 predicts the summer precipitation over the MLYR region, especially the extreme events, on a seasonal time scale remains to be assessed.
Demanded by the rapid development of economy and society, high-quality climate forecast service issued not only at longer lead times but also with finer spatial resolutions becomes increasingly important (e.g., Golding et al., 2017).
However, the horizontal resolution of most current state-ofthe-art CGCMs is usually coarser than 100 km due to limited computational resources. The coarse resolution of the CGCMs limits their performance in reproducing fine features(such as regional complex terrains) and small-scale physical processes. To improve the predictions of regional climate,downscaling with a fine-resolution regional model has been utilized for many decades (e.g., Giorgi et al., 2001; Lo et al.,2008). To perform the dynamical downscaling, regional climate models (RCMs) are often driven by the CGCMs or reanalysis data that provide initial and lateral boundary conditions over a specified domain. Previous studies have demonstrated that, with a high spatial resolution, RCMs can provide more detailed forecasted features and improve GCM performance to some extent (e.g., Ding et al., 2006; Yuan and Liang, 2011; Ratnam et al., 2013)
In this study, we evaluate the ability of NUIST-CFS1.0 in forecasting summer precipitation over the MLYR region during 1982–2020 and further use the Weather Research and Forecast (WRF) model to dynamically downscale the global forecasts. Section 2 briefly describes the forecast model, observational data, and methods for skill evaluations.Sections 3 and 4 present the ability of NUIST-CFS1.0 in forecasting the summer and extreme precipitation events over the MLYR region. In section 5, we use the WRF model to perform and assess dynamical downscaling predictions of seven extreme summer precipitation events over the MLYR region. A summary and discussion are given in section 6.
2.Models, datasets, and methods
NUIST-CFS1.0, used in this study, is the same as the SINTEX-F model that was originally developed at Japan Agency for Marine-Earth Science and Technology (JAMSTEC; Luo et al., 2003, 2005b). This CGCM consists of the European Center Hamburg Atmospheric Model version 4.6(ECHAM4.6; Roeckner et al., 1996) at T106L19 resolution and the Ocean Parallélisé version 8.2 (OPA8.2; Madec et al.,1998) at 2° (lon) × 0.5° (lat) (equator) ~2° (lon) × 2° (lat)(polar) grid spacing with 31 levels in the vertical direction.The atmosphere and ocean components are coupled by the Ocean Atmosphere Sea Ice Soil (OASIS 2.4; Valcke et al.,2000) coupler every two hours without any flux correction.The effect of ocean surface current on momentum flux change has been considered (e.g., Luo et al., 2005b). The atmosphere component contains a five-layer land surface model and a semi-Lagrangian cloud water scheme (Tiedtke,1989; Roeckner et al., 1996). The sea ice cover is relaxed toward observed monthly climatology in the ocean model.Readers are referred to Luo et al. (2005b) for detailed information on the CGCM.
We assess the hindcasts for the boreal summer (June-July-August, JJA) initiated from 1 March during 1982–2020, according to the requirement by the annual national summer climate forecast conference organized by China Meteorological Administration. The ensemble hindcasts consist of nine members, which were generated by three different versions of the model with different coupling physics(Luo et al., 2005b). Each version of the model provides a set of three hindcasts started from three different initial conditions, which are produced by a coupled SST-nudging scheme that restores the model’s SST to daily observed values with different nudging coefficients (Luo et al., 2005a,2008).
Based on the 6-hourly CGCM outputs, we further dynamically downscaled the NUIST-CFS1.0 nine-member hindcasts using WRF model version 3.9.1 (Skamarock et al.,2005). All the downscaled hindcast experiments were run at a horizontal resolution of 30 km with 36 vertical levels. The model domain contains the entirety of East Asia (Fig. 1),which consists of 231 cells in the west–east direction and 211 cells in the south–north direction. Table 1 gives the listof the parameterization schemes of the main physical processes that were adopted in the WRF model downscaling experiment. The spectral nudging method was also employed to minimize climate drift in WRF by adding largescale GCM constraints over the WRF domain, in addition to the initial and lateral boundary conditions (e.g., Miguez-Macho et al., 2004; Laprise et al., 2012; Tang et al., 2017).The wavenumber 2 was selected in both the zonal and meridional directions to constrain the features with a scale larger than 3000 km using bias-corrected GCM outputs.Zonal and meridional wind components and geopotential height and temperature fields above the planetary boundary layer were applied with a nudging coefficient of 3 × 10⁻⁴s–1.

Fig. 1. Topography height (units: m) used in (a) NUISTCFS1.0 and (b) WRF downscaling.
Since systematic biases in the NUIST-CFS1.0 hindcasts would result in negative impacts when forcing WRF (Christensen et al., 1998), all the GCM-forcing fields required to drive WRF are corrected with the ERA-Interim monthly climatology of 1991–2020, as was done in previous studies (e.g., Xu and Yang, 2012; Ratnam et al., 2016). Same as the NUIST-CFS1.0 hindcasts, the WRF hindcasts were integrated from 1 March to 30 September of each year.
For validating and evaluating the model forecasts, we adopted the re-gridded monthly precipitation in China at a resolution of 0.5° × 0.5° (Zhao et al., 2014) and global precipitation from the CPC Merged Analysis of precipitation at 2.5° × 2.5° (Xie and Arkin, 1997). The monthly mean SST at 1° × 1° was obtained from the Met Office Hadley Center(Rayner et al., 2003), and the monthly mean atmospheric circulation data at a resolution of 2.5° × 2.5° was obtained from National Centers for Environmental Prediction(NCEP)-Department of Energy (DOE) Reanalysis II (Kanamitsu et al., 2002).
The forecast skill is assessed using Pearson correlations between the NUIST-CFS1.0 ensemble mean hindcasts and the observations during the 39 years (i.e., 1982–2020) and the WRF ensemble mean hindcasts over the past 10 years (i.e., 2011–20). Note that, due to limited computational resources, we performed only 10-year WRF downscaling hindcasts to obtain the WRF forecast climatology and evaluate its prediction skill. The statistical significance of the prediction skill is measured using a two-tailed student t-test.And, forecast skill for the spatial distribution of atmospheric anomalies is assessed using a pattern correlation, root-meansquare error (RMSE), and mean value.
3.NUIST-CFS1.0 seasonal forecasts of JJA precipitation
Figure 2 displays the climatological summer (JJA)mean precipitation of 1982–2020 over eastern China based on the observations and the NUIST-CFS1.0 hindcasts. In general, the JJA climatological mean precipitation gradually decreases from south to north over East China. The maximum precipitation greater than 10 mm d–1is located in southern China, and the second maximum appears along the coast of Southeast China. Compared with the observations, NUISTCFS1.0 displays good performance in reproducing the spatial pattern of summer mean precipitation over eastern China (cf.Figs. 2a and 2c) but underestimates the precipitation, especially in Southeast China. Associated with the seasonal migration of the EASM, the time–latitude cross section of the climatological mean precipitation averaged over 110°–122.5°E clearly shows a northward shift of the rainfall belt from 20°N to 35°N in early summer (Fig. 2b). And the mei-yu rainband exists in the latitudes between 25°N and 35°N during the period from late June to mid-July. NUIST-CFS1.0 successfully reproduces the occurrence of the mei-yu rainband,despite the intensity of the precipitation in the hindcasts being much lower than that observed (Fig. 2d).
The dry bias over South China is a common problem in many current global climate models (GCMs), with varying underestimations of the precipitation magnitude (e.g., Lee et al., 2010; Liu et al., 2015; Guo et al., 2017). There may be two reasons for this dry bias in NUIST-CFS1.0. Firstly,with a systematic cold bias of SST over the Indo–Pacific region, a cyclone bias occurs over the WNP that limits the moisture transport from the South China Sea and WNP to South China [Fig. S1 in the electronic supplementary material(ESM)]. Secondly, due to the coarse resolution in the GCMs,small- and medium-scale physical processes cannot be fully resolved, and thus the intensity of extreme rainfall is largely underestimated.
We further examine the standard deviations of the interannual variation of summer mean precipitation over East China (Fig. S2 in the ESM). Similar to the climatology, theobserved precipitation shows strong variability over the MLYR and southern China. The average standard deviations of summer mean precipitation from individual ensemble members fail to reproduce the observed features, which is consistent with underestimation of the extreme rainfall. As expected, the interannual variability in the ensemble mean prediction is much smaller because the internal variability of the atmosphere has been smoothed out.

Fig. 2. (a, c) Climatological mean precipitation (units: mm d–1) over East China and (b, d) the temporal evolution of regional mean precipitation over 110°–120.5°E based on the observations (upper panels), and the NUIST-CFS1.0 hindcasts (bottom panels).
To assess the skill of NUIST-CFS1.0 in predicting the precipitation anomalies, we calculated the spatial distribution of the temporal correlation coefficient between the predicted and observed JJA precipitation anomalies during 1982–2020 over East China (Fig. 3a). We can find negative anomaly correlation coefficient (ACC) skill in many parts of southern, northeastern, and northern China, indicating great difficulty in predicting the interannual variations of summer precipitation there. Encouragingly, positive ACC values can be seen over the MLYR region (28°–34°N, 110°–122.5°E). This suggests that, although NUIST-CFS1.0 has limited skill in predicting JJA precipitation anomalies over many areas of East China, it is able to forecast the MLYR precipitation anomalies to some extent. Figure 3b illustrates the MLYR summer precipitation anomaly based on the observations and the model hindcasts from 1982 to 2020. The correlation coefficient between the predictions and the observations reaches 0.34, statistically significant at the 95% confidence level. However, the interannual variations of the MLYR summer precipitation are substantially underestimated in the model’s ensemble mean predictions. The standard deviation of the predicted precipitation is 0.25 mm d–1, which is less than one-third of the observed value (0.82 mm d–1).
The moderate but statistically significant prediction skill for JJA precipitation anomalies over the MLYR region indicates that NUIST-CFS1.0 can reproduce some of the underlying mechanisms responsible for the summer precipitation variations. Previous studies have suggested that the WNP summer monsoon (WNPSM) is the main system controlling the entire East Asian climate during boreal summer,and its interannual variations strongly affect MLYR precipitation (e.g., Wang and LinHo, 2002; Ding and Chan,2005). Figures 4a and b exhibit the typical anomalies of horizontal winds at the 850-hPa level and precipitation over East Asia associated with one standard deviation of the MLYR precipitation anomaly based on the observations and NUIST-CFS1.0 predictions. Consistent with previous studies, the observational result displays a dipole pattern of the atmospheric circulation anomaly over East Asia, with an anomalous anticyclone located in the South China Sea and the WNP and a cyclonic anomaly over the Yangtze River and Japan Sea; this resembles the Pacific–Japan teleconnection pattern (Nitta et al., 1987; Huang and Sun, 1992). The stronger-than-normal anticyclone over the WNP acts to transport more warm moisture northward from the tropics that converges over the MLYR region. This provides a prerequisite condition to increasing the summer precipitation there. The regressed circulation pattern in the NUIST-CFS1.0 forecasts is similar to the observed, albeit with some local discrepancies. This indicates that NUIST-CFS1.0 can capture this important dynamical linkage between the MLYR summer precipitation and WNPSM, hence producing the positive ACC skill over the MLYR region (recall Fig. 3a). Interestingly,compared to the observed results, the anomalous anticyclone over the WNP appears to be stronger and occupy a broader area in the model hindcasts (cf. Figs. 4a and 4b). This indicates that the relation between the WNP anticyclone and the MLYR precipitation may be overestimated in the NUISTCFS1.0 ensemble mean forecasts.
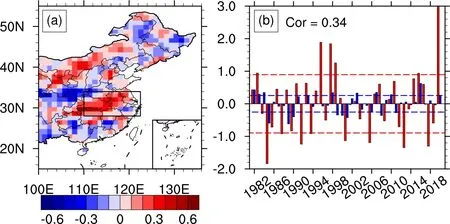
Fig. 3. (a) The correlation coefficient between the observed and forecasted summer precipitation anomalies by NUIST-CFS1.0 over East China. Stippling indicates the correlation exceeds the 95% significance level according to two-tailed Student’s t-test. (b) Year to year variations of the summer precipitation anomalies(units: mm d–1) averaged over the MLYR region (28°–34°N, 110°–122.5°E) based on the observations (red bar) and the NUIST-CFS1.0 hindcasts (blue bar). The red (blue) line in (c) indicates one standard deviation of the observations (the hindcasts).
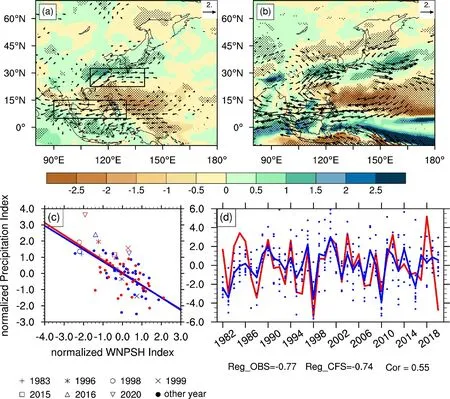
Fig. 4. Regressed anomalies of summer mean precipitation (shading) and 850-hPa horizontal winds (vector) onto the MLYR precipitation based on (a) the observations and (b) NUIST-CFS1.0 predictions. Dotted areas denote the regressed precipitation anomalies are statistically significant at the 90% confidence level according to two-tailed Student t-test. Only statistically significant wind anomalies are displayed. The two black boxes in (a) indicate the regions used to define the WNPSM index. (c) Scatter diagram of the normalized WNPSM index with the normalized MLYR precipitation anomalies based on the observations (red symbols) and the NUIST-CFS1.0 predictions (blue symbols). The red and blue lines are linear fits to the observations and the NUIST-CFS1.0 predictions, respectively.(d) Time series of the WNPSM index from nine member forecasts (blue dots), the ensemble mean forecasts (blue line), and the observations (red line) during 1982–2020.
To represent the strength of the WNPSM, we defined the WNPSM index as the difference of zonal winds at the 850-hPa level between (5°–15°N, 90°–130°E) and (22.5°–32.5°N, 110°–140°E) following Wang and Fan (1999).Based on the scatter plot of the summer precipitation anomalies over the MLYR region and the WNPSM index, we can find that the MLYR precipitation anomalies are highly correlated with the WNPSM circulation, with the coefficients reaching –0.76 and –0.74 for the observations and the NUIST-CFS forecasts, respectively (Figs. 4c and 4d). Meanwhile, the ACC between the NUIST-CFS1.0-forecasted WNPSM index and the observation during 1982–2020 is 0.55, indicating that NUIST-CFS1.0 can predict the interannual variations of the large-scale circulation of the WNPSM well.
Previous studies have shown that the interannual atmospheric anomalies are largely induced by SST anomalies in the tropical oceans, which trigger teleconnections and remotely modulate the low-level atmospheric circulation,moisture transportation, and precipitation in East Asia (e.g.,Zhou, 2011; Zhang et al., 2017). Therefore, we compared the observed and forecasted relations between the MLYR precipitation and tropical SST anomalies during summer (Figs.5a–c). In the observations, the MLYR precipitation shows significant correlations with the SST anomalies in the topical WNP, North Indian Ocean (NIO), and tropical North Atlantic (NAT). Different from the observations, the simple averages of the nine-member forecasts display weak and insignificant correlations with the SST anomalies in these regions (Fig. 5b). In contrast, the NUIST-CFS1.0 ensemble mean forecasts show an overestimated relation between the MLYR precipitation and tropical SST anomalies (Fig. 5c).The large correlation differences between the individual ensemble members and the ensemble mean forecasts indicate that strong internal variability of the atmosphere may overwhelm the teleconnections between the tropical SST anomalies and the MLYR precipitation, causing great uncertainty and challenges in predicting summer precipitation anomalies over East Asia.

Fig. 5. Correlation coefficients between the MLYR summer precipitation anomalies and summer SST anomalies during the period of 1982–2020 from(a) the observation, (b) a simple average of individual predictions, and (c)nine-member ensemble mean predictions of NUIST-CFS1.0. (d) Correlation coefficients of summer SST anomalies between the observations and NUISTCFS1.0 ensemble mean predictions. Stippling indicates the correlation exceeds the 99% confidence level. The three boxes in (a) indicate the regions used to define the SST indexes of NIO, WNP and NAT (from left to right),respectively.
We further analyzed the relations between summer SST anomalies in several key regions and the WNPSM. Based on the above results, we paid special attention to the SST anomalies in the NIO (10°S–20°N, 40°–100°E), WNP (10°–20°N, 110°–160°E), and NTA (0°–25°N, 60°–15°W).Strong correlations can be found between the observed WNPSM index and the SST anomalies in the three regions,with the coefficients being –0.52, –0.61, and –0.48, respectively (see Table 2). The NUIST-CFS1.0 ensemble mean forecasts can realistically capture these tropical SST anomalyrelated circulations over East Asia (Fig. S3 in the ESM).Both the observational results and the ensemble mean forecasts suggest that warm SST anomalies in the three regions can induce a stronger-than-normal anticyclone in the lower troposphere over the WNP, and hence help increase the summer precipitation over the MLYR region. Considering the model’s high prediction skill for the SST anomalies in the tropical oceans (Fig. 5d), we infer that a portion of the predictability for the WNPSM index and MLYR precipitation anomalies results from the high predictability of the tropical SST anomalies. It is worth noting that the correlations between the WNPSM index and the SST anomalies in the three regions show a large spread among the NUISTCFS1.0 individual ensemble member forecasts, and their averaged correlations are lower than the observed values (see the bottom row in Table 2). This is consistent with the correlation results based on the MLYR precipitation index (recall Figs. 5a–c). The contrasts between the ensemble mean forecasts and individual ensemble member forecasts indicatethat large uncertainty exists in predicting the atmospheric response to the tropical SST anomalies, which may be partly responsible for the limited skill in predicting the MLYR precipitation anomalies.

Table 2. Pearson correlation coefficients between the WNPSM index and the NIO, WNP, and NTA SST indices based on the observations, the NUIST CFS1.0 ensemble mean forecasts, and the simple average of individual member forecasts. Numbers in parentheses indicate the (minimum, maximum) correlation coefficient from the individual member. Statistically significant correlations at the 95% confidence level are indicated in bold.
4.NUIST-CFS1.0 seasonal forecasts of extreme summer precipitation
Extreme precipitation events often induce huge economic losses, threatening the community, lives, and properties. In this section, we aim to explore how well NUISTCFS1.0 could have predicted the extreme precipitation events over the past four decades. The extreme precipitation events are defined by when the MLYR summer seasonal mean precipitation exceeds one standard deviation above the climatological mean (Fig. 3b). Seven extreme precipitation summers (1983, 1996, 1998, 1999, 2015, 2016, and 2020) are identified based on the observations, and statistical features of these seven extreme precipitation events are listed in Table 3. Regarding the areal mean magnitude of the precipitation anomalies over the MLYR region, we can find that NUIST-CFS1.0 is able to predict three of the seven extreme precipitation events (1983, 1998, and 2016), and two above-normal (but not extreme) precipitation events(2015 and 2020). However, the model predicts below-normal precipitation in summer 1996 and 1999, which are opposite to the observations.
The spatial distributions of the extreme precipitation anomalies over the MLYR region based on the observations and the NUIST-CFS1.0 forecasts are shown in Fig. 6. It can be found that during the summers of 1998, 2016, and 2020,NUIST-CFS1.0 roughly predicts the spatial distributions of the above-normal precipitation over the MLYR region with statistically significant positive pattern correlation coefficient(PCC) skill (see Table 3). Interestingly, NUIST-CFS1.0 captures the unique positive precipitation anomalies over eastern MLYR in summer 2015 (Fig. 6).

Table 3. Forecasts of seven extreme summer precipitation (units: mm d–1) events over the MLYR, including the areal mean, pattern correlation coefficient (PCC), and root-mean-square error (RMSE) of the seasonal mean precipitation anomalies, and 90th percentile of daily precipitation anomalies during June-July-August. Statistically significant correlations at the 95% confidence level are indicated in bold.
In addition, as shown by the scatter diagrams of the WNPSM index and the MLYR precipitation from the observa-tions and the NUIST-CFS forecasts (recall Fig. 4c), four of the observed seven extreme precipitation events (i.e., 1983,1996, 1998, and 2020) co-occurred with weaker-than-normal WNPSMs, but only the weaker-than-normal EASMs during summer 1983 and 1998 are successfully predicted. Previous studies have attributed the weaker-than-normal WNPSM to an extreme El Niño in the preceding winter (e.g., Kosaka et al., 2012; Martin et al., 2020). However, although there was also an extremely strong El Niño in winter 2015/16, a neutral WNPSM was observed in summer 2016. This is because the WNPSM had experienced a transition from a weak situation in June–July to a dramatically strong situation in August 2016, resulting in a change of the MLYR precipitation from above-normal to below-normal (see Fig. 7c). The sudden intra-seasonal change of the WNPSM circulation was thought to have been caused by the extremely strong Madden–Julian Oscillation (MJO) and East Asian Jet (e.g., Yuan et al., 2017; Li et al., 2017). NUIST-CFS1.0 predicts a weakerthan-normal WNPSM in 2016 following an extremely strong El Niño, similar to the cases in 1983 and 1998. The strong intra-seasonal change of the WNPSM in summer 2016 is not captured, which is generally not predictable on the seasonal time scale.
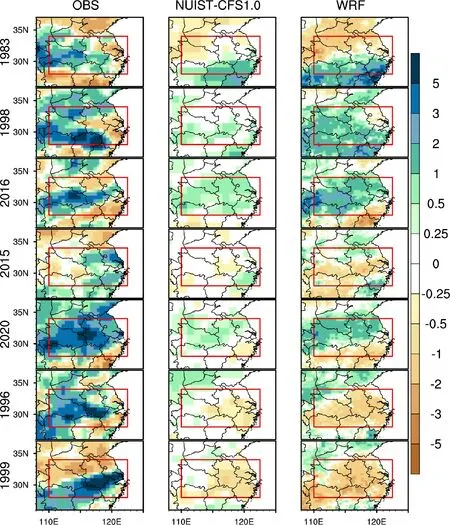
Fig. 6. Spatial distribution of the precipitation anomalies (units: mm d–1) during the seven extreme summers based on the observations (left panels), NUIST-CFS1.0 predictions (middle panels), and WRF downscaling predictions (right panels). Red boxes denote the MLYR region.
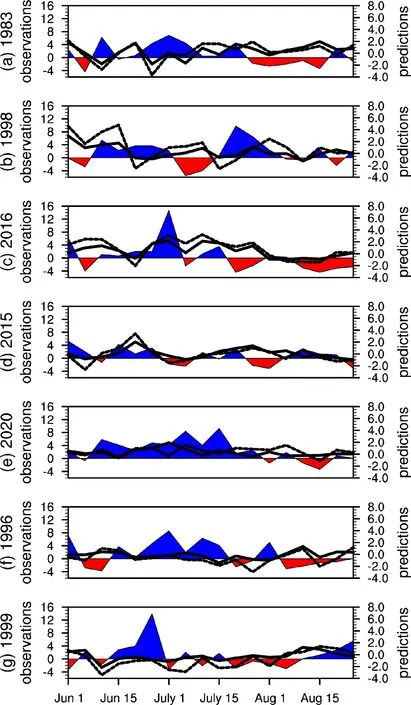
Fig. 7. Time series of the pentad precipitation anomaly (units: mm d–1) averaged over the MLYR region based on the observations (shaded lines), NUIST-CFS1.0 forecasts (solid lines), and WRF downscaled results (short dashed lines) during the seven extreme wet summers. The precipitation anomaly above normal is in blue and below normal is in red.
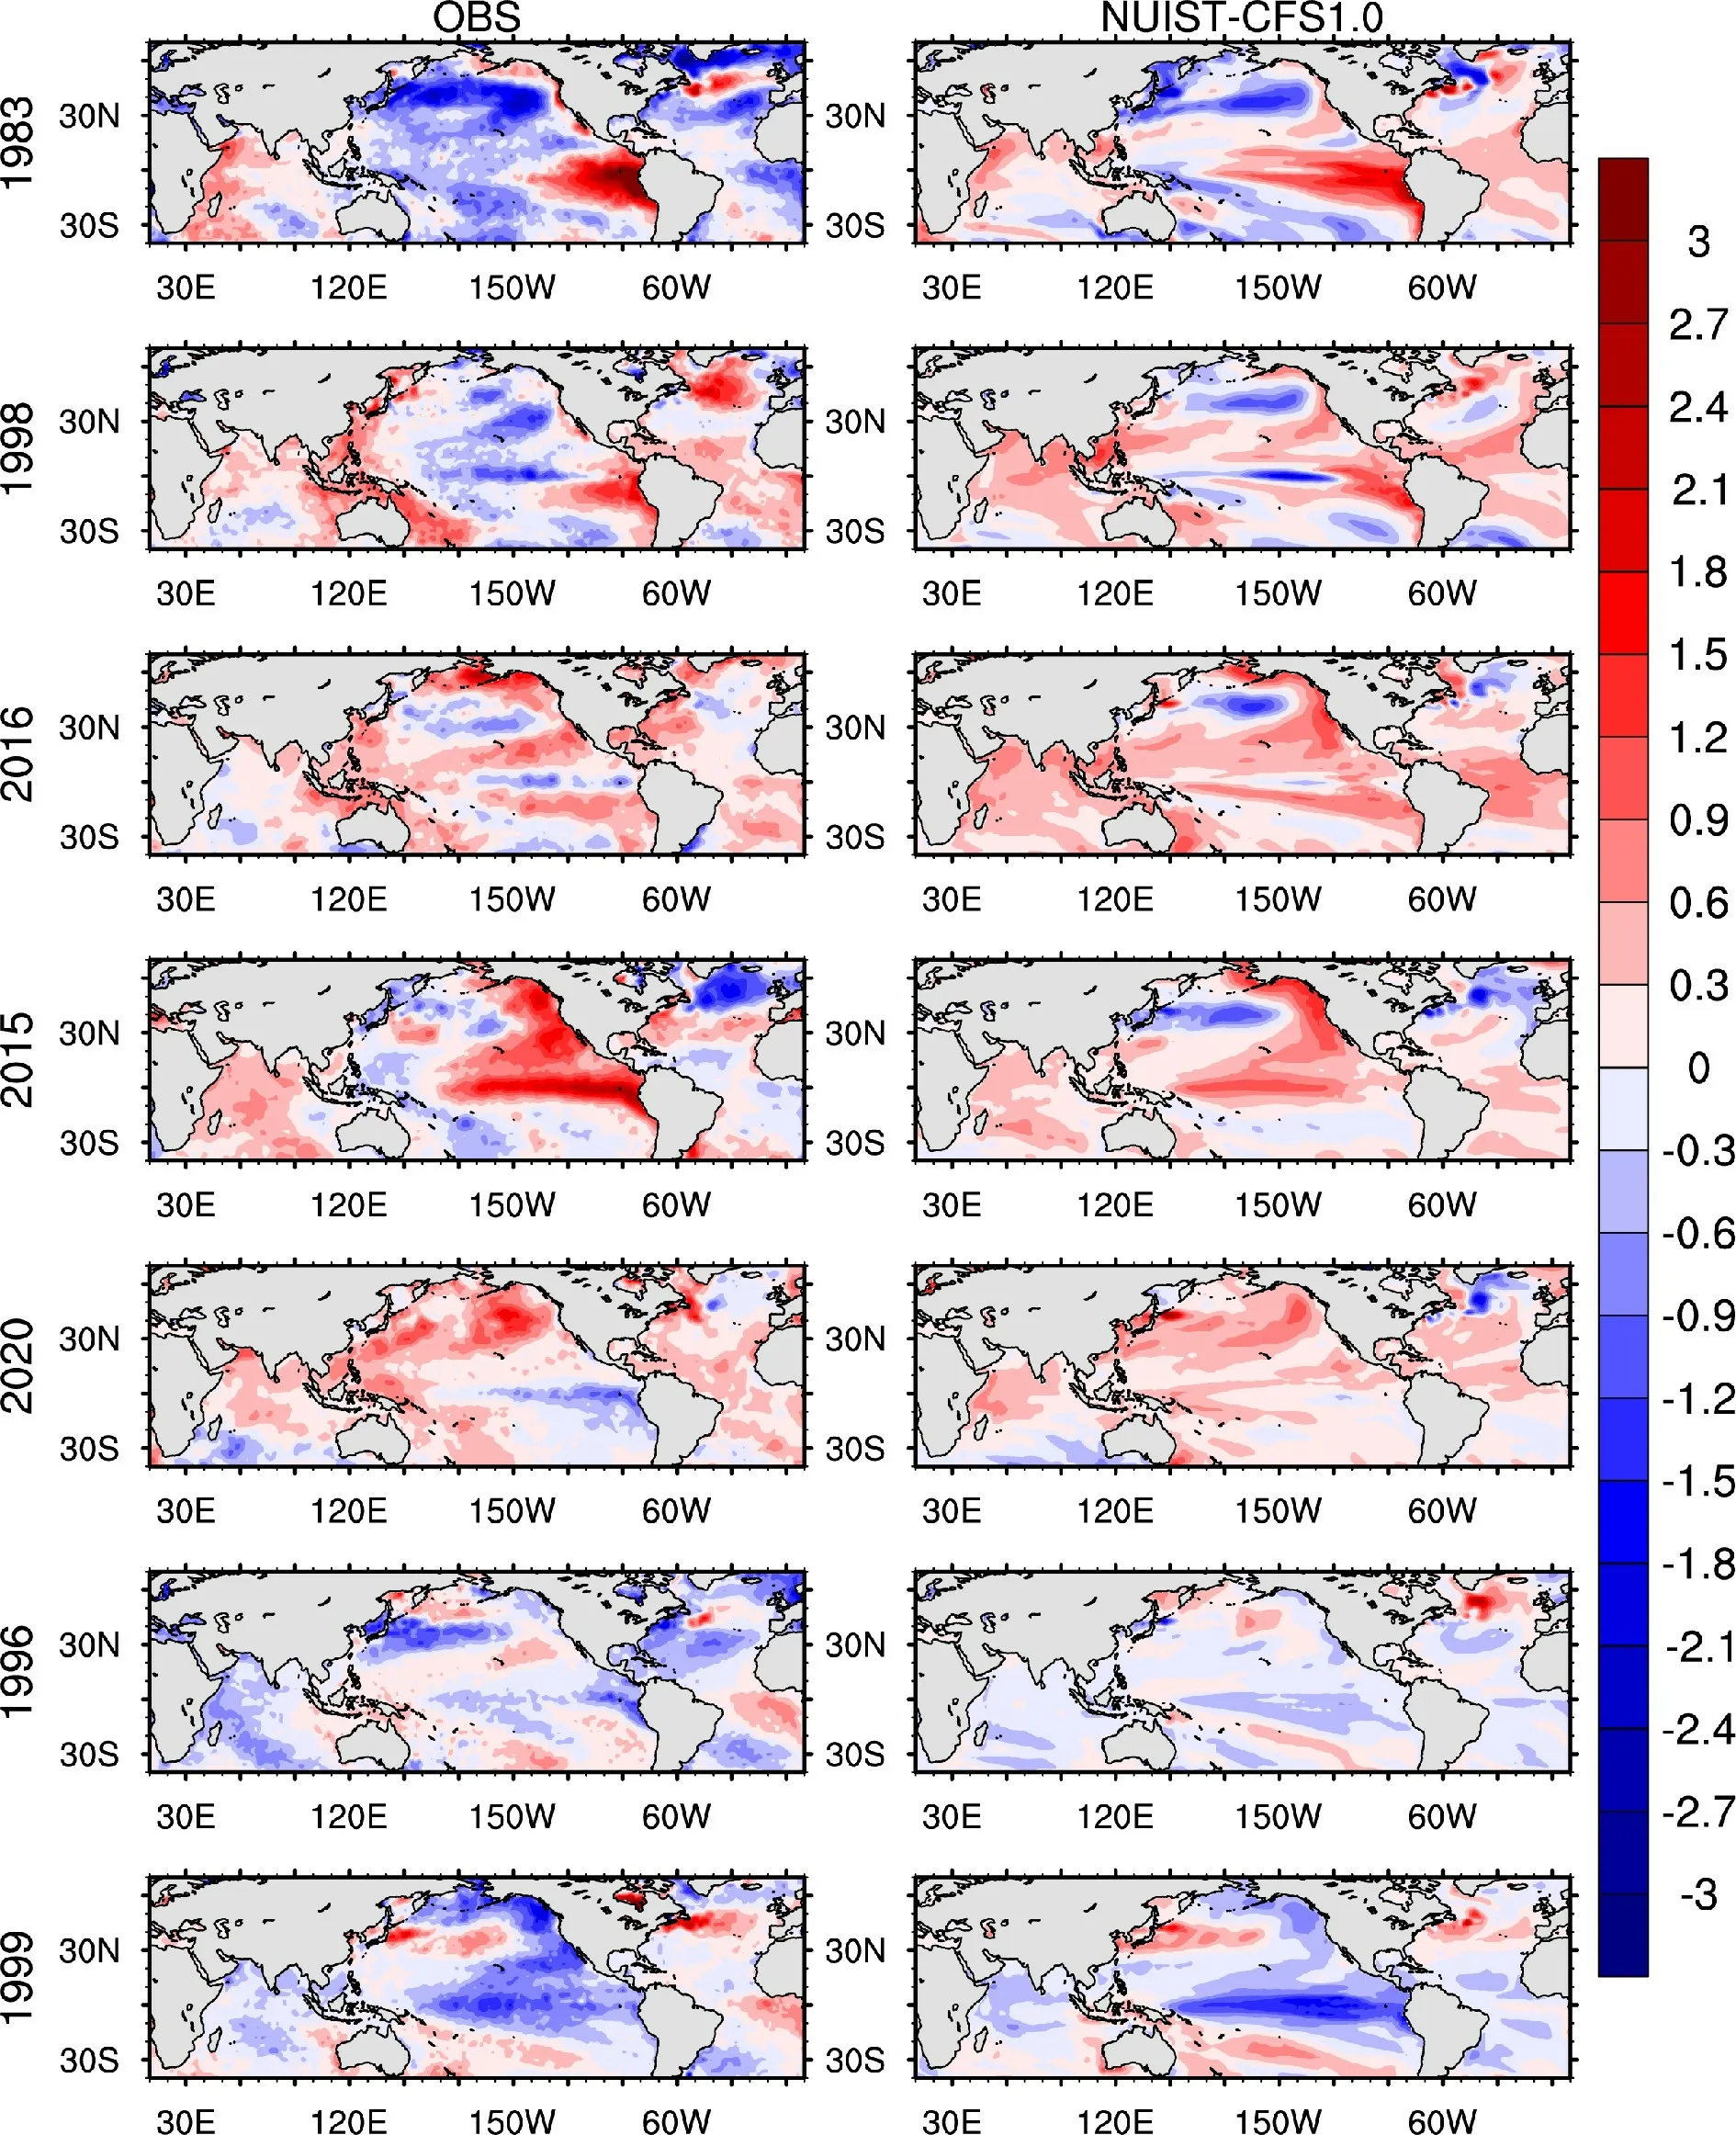
Fig. 8. SST anomalies (units: °C) in summer during the seven extreme precipitation events from (left column) the observations and (right column) the ensemble mean forecasts of NUIST-CFS1.0.
Without the strong El Niño signal in the preceding winter, excessive precipitation occurred over the MLYR during the summers of 2015 and 2020. In summer 2015, with the developing of a moderate El Niño signal, the WNPSM index and the spatial distributions of the precipitation anomalies in the MLYR region, as well as the Indo–Pacific SST anomalies, were predicted reasonably well by the nine-member ensemble mean, but their magnitudes were substantially underestimated (Figs. 4d, 6, and 8). Given the strong influence of a developing ENSO on the WNPSM (Wu et al., 2009),one possible reason for the underestimations may be that the strong warm SST anomaly in the equatorial eastern Pacific in summer 2015 is not well predicted (Fig. 8). Similarly, in summer 2020, the warm SST anomalies in the tropical Indian Ocean–western Pacific and the Atlantic are predicted reasonably well, but the La Niña condition is missed (Fig. 8,see also Tang et al., 2021). NUIST-CFS1.0 predicts a normal WNPSM index with a higher frequency of positive pentad rainfall events but with a weakened intensity (Figs. 4d and 7e). Therefore, the failure in predicting the rapid phase transition from a moderate El Niño to a La Niña condition may reduce the model’s skill in predicting the extreme floods over the MLYR region (e.g., Pan et al., 2021; Tang et al.,2021). Besides, some extratropical signals, such as snow cover anomalies over Eurasia and Arctic Sea ice (Chen et al., 2019; 2021), and internal variability, such as the East Asian Jet in the upper atmosphere (e.g., Kosaka et al., 2012;Li et al., 2021), may also contribute to MLYR precipitation anomalies, which were still not well represented in NUISTCFS1.0; further improvements to capture these signals in the model are needed.
For the two summers (i.e., 1996 and 1999) for which precipitation anomalies are not predicted well, the causes of the extreme precipitation events over the MLYR are different.In the summer of 1996, no strong warm SST anomalies can be seen in the tropical oceans; therefore, it is difficult to predict the precipitation anomalies and WNPSM. Compared to a typical summer of extreme precipitation, the WNPSM was strong in 1999. However, it co-occurred with an opposite situation in the tropical oceans, with a La Niña event in the Pacific and cold SST anomalies in the NIO. Thus, if the tropical SST anomalies would be the main drivers for the MLYR precipitation in summer 1999, the WNPSM would be predicted as stronger than normal, and the MLYR precipitation would be below normal; the NUIST-CFS1.0 forecasts actually produce this situation. In contrast, the observed seasonal mean precipitation in 1999 is above normal because of the occurrence of an extremely wet synoptic event in late June of 1999 (Fig. 7g). As was shown by the pentad precipitation analysis, we found a similar situation in summer 2016. The seasonal mean precipitation anomalies in summer of both 1999 and 2016 are mostly contributed by one extreme synoptic event (Figs. 7c and 7g); these events are usually difficult(if not impossible) for CGCMs to predict on seasonal time scale.
5.Dynamical downscaling
Previous studies have shown that dynamical downscaling can improve skill in predicting climate extreme precipitation events in China. However, most of these studies focus on one single case, such as the summer of 1998 (e.g., Gao et al.,2011; Ma et al., 2015). In this study, we perform dynamical downscaling hindcast experiments for all seven extreme precipitation summers over the MLYR region since 1982.
To obtain the climatological mean-states of the WRF ensemble hindcasts, we use the NUIST-CFS1.0 nine-member global forecasts from 1 March to 30 September during 2011–20 to drive the WRF model (see section 2 for the detailed description of the downscaling experiments). The differences in the climatological mean precipitation between the WRF downscaling forecasts and the observations from 2011 to 2020 over East China are shown in Fig. 9a. The result shows that the downscaled precipitation climatology is overestimated, especially in southwestern China and the southeast coast of China. In addition, the occurrence frequency of the heavy rainy days is also overestimated by the WRF hindcasts in these areas (Fig. S4 in the ESM). Such a problem has been commonly reported using WRF simulations, since local convection can be more easily triggered in most cumulus schemes over the regions with complex topography (e.g., Ding et al., 2006; Yuan et al., 2012). The spatial distribution of the ACC skill in predicting summer mean precipitation anomalies during 2011–20 over East China based on the WRF-downscaling hindcasts is similar to that based on the NUIST CFS1.0 predictions (cf. Figs. 9b and 9c).Skill in some regions appears to be slightly improved in the WRF downscaling hindcasts, but skill in other areas becomes slightly worse. There is no apparent improvement in predicting the precipitation anomalies over the MLYR region.

Fig. 9. (a) Difference of summer climatological mean precipitation (units: mm d–1) between the WRF downscaling hindcasts and the observation for the period of 2011–20. (b) and (c) Correlation coefficient skill in predicting summer mean precipitation anomalies for the NUIST-CFS1.0 forecasts and the WRF downscaling forecasts during 2011–20.
The WRF downscaling predictions of the seven extreme precipitation events over the MLYR region are shown in Fig. 6 (right panels). For the three extreme precipitation events over the MLYR region that are successfully predicted by NUIST-CFS1.0 (i.e., 1983, 1998, and 2016),WRF displays improved forecast skill in predicting the spatial distribution of the rainfall anomalies with larger magnitudes.For instance, during the summer of 2016, there was an extreme rainfall belt over the Yangtze River area. The WRF hindcast reproduces this pattern, which is not predicted well by NUIST-CFS1.0. Likewise, during the summer of 1998,reproduction of the extreme precipitation in Jiangxi province is significantly improved in the WRF forecasts.The pattern correlation and the RMSE of the predicted JJA mean precipitation anomalies over the MLYR region in 1998 and 2016 are also improved (Table 3). Similarly, in the cases of 2015 and 2020, for which NUIST-CFS1.0 predicts above-normal (but not extreme) conditions, the WRF downscaling also helps improve the predictions of the arealmean intensity and RMSE of the precipitation anomalies over the MLYR region (Fig. 6 and Table 3). However, during the summers of 1996 and 1999, in which NUIST-CFS1.0 falsely predicts below-normal precipitation over the MLYR region, the WRF downscaling fails to correct the sign of the predicted precipitation anomalies and even produces a worse condition (i.e., the falsely alarmed dry condition in the NUIST-CFS1.0 predictions becomes much drier in the WRF downscaling experiments).
The above results suggest that the skill of the WRF downscaling hindcasts largely depends on the performance of the NUIST-CFS1.0 global predictions, since the predicted largescale information from NUIST-CFS1.0 is applied to constrain the WRF simulations. If the global model can correctly predict the sign of the precipitation anomalies, the WRF downscaling will help improve the accuracy in predicting the location and magnitude of the precipitation anomalies, and vice versa. As displayed in Table 3 and Fig. 7, magnitudes of both the 90th percentile of the MLYR daily precipitation anomalies and pentad anomalies during the seven extreme precipitation summers are stronger in the WRF downscaling than in the global model forecasts. This could be expected since the higher resolution WRF model is able to produce stronger precipitation across regional topography and/or along a front under the influence of the same large-scale circulation. The strong performance dependence of the downscaling on the global model predictions suggests that further improvement of global model predictions is crucial to improving regional downscaling forecasts (e.g., Yuan et al., 2012).
6.Summary and discussion
In this study, we have demonstrated that the NUIST CFS1.0 forecasts, initiated from 1 March, display moderate but statistically significant skill in predicting summer mean rainfall anomalies over the MLYR region and the WNPSM.The results also show that NUIST-CFS1.0 has high skill in predicting the tropical SST anomalies, which provides a potential seasonal predictability of the MLYR precipitation and WNPSM. Warm SST anomalies in the tropical Pacific,Atlantic, and Indian Oceans can induce a stronger-than-normal anticyclone over the WNP, which helps transport more warm moisture northward and hence increases the precipitation over the MLYR region. In general, NUIST-CFS1.0 can reproduce the intrinsic relations between the WNPSM and the tropical SST anomalies. However, compared to the observations and individual ensemble member forecasts, the ensemble-mean predictions overestimate the relations between the East Asian climate and the tropical SST anomalies, since internal variability of the atmosphere (i.e., the noise) is largely smoothed out in the ensemble mean forecasts. Our results show a large spread among the individual members in predicting the atmospheric response to the tropical SST forcing.This indicates a great uncertainty and challenge in predicting the East Asian climate.
We compared the NUIST-CFS1.0 forecasts with the forecasts at a four-month lead time of seven other state-of-theart CGCMs, which are provided by the Copernicus Climate Change Service (C3S) Seasonal Forecast datasets (https://cds.climate.copernicus.eu/). All these models’ hindcasts share a common period of 1993–2016 and have at least 10 ensemble members with horizontal resolution varying between 0.5° and 1.5° (i.e., finer than NUIST-CFS1.0).Detailed descriptions of the seven models’ hindcasts can be found in existing literature (e.g., Saha et al., 2014; MacLachlan et al., 2015; Sanna et al., 2017; Takaya et al., 2018). The results suggest that ACC skill in predicting JJA precipitation anomalies over East China vary from model to model (figure not shown). Compared with the averaged skill of the other seven CGCMs’ ensemble-mean hindcasts, the NUISTCFS1.0 ensemble-mean forecasts produce better skill in some areas but worse skill in others over East China (Fig. 10).Over the middle reaches of the Yangtze River, NUISTCFS1.0 produces higher skill that is statistically significant at the 95% confidence level. For the predictions of the MLYR summer precipitation anomalies, only two out of eight CGCMs produce statistically significant skill (Table 4).In contrast, all eight CGCMs can predict the WNPSM index with high skill, and the NUIST-CFS1.0 forecasts are better than most of the other seven CGCMs. This indicates a great challenge in predicting the MLYR summer precipitation anomalies, even if the WNPSM can be predicted well. It is worth noting that the GLoSea5-GC2 with a high-resolution produces the highest skill in predicting the MLYR precipitation (Table 4), indicating the potential benefits of increasing model resolution (e.g., Johnson et al., 2016; Prodhomme et al., 2016). Previous work shows that prediction skill rises rapidly with increasing ensemble size, especially when the number of ensemble members is relatively small (< 20;Scaife et al., 2014; Li et al., 2016). Compared with other large-ensemble hindcast systems, the nine-member hindcasts currently used in NUIST-CFS1.0 are truly insufficient in predicting precipitation over the MLYR, so efforts to add additional members into the seasonal forecasts are ongoing. The effects of large ensemble size on seasonal hindcasts of precipitation warrant future studies.
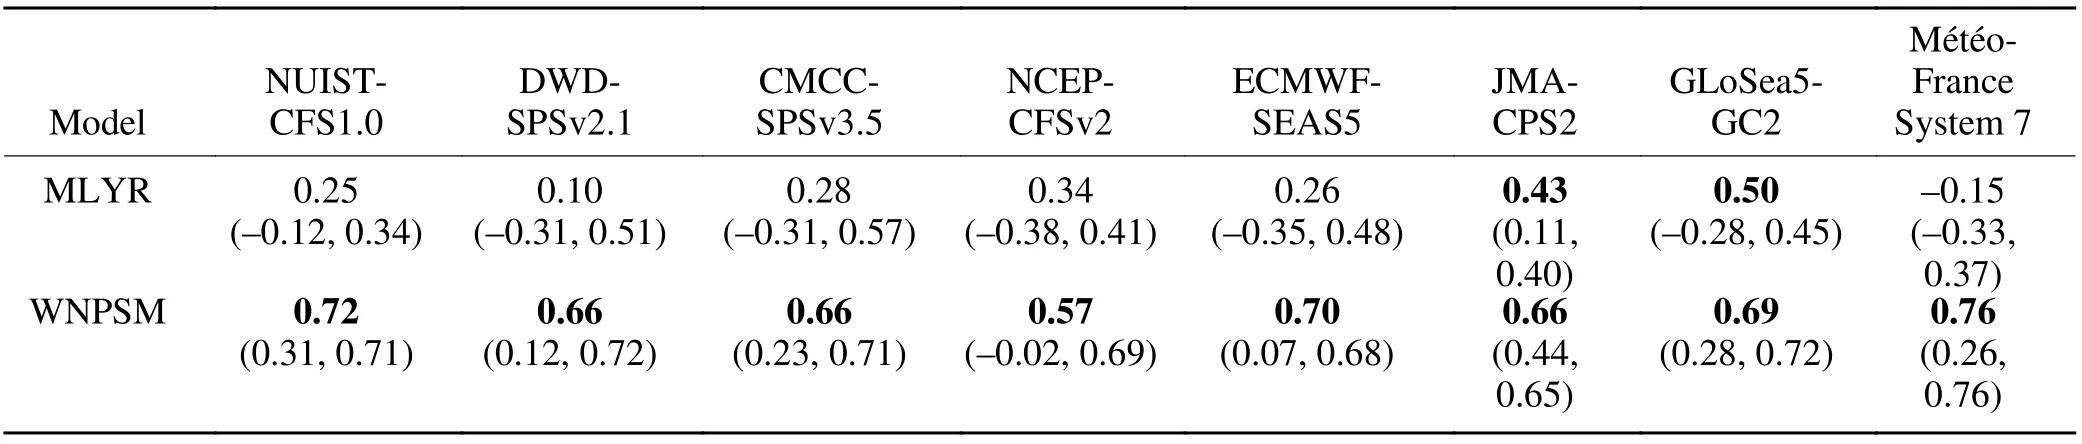
Table 4. ACC skill in predicting the MLYR precipitation anomalies and WNPSM index during JJA 1993–2016 based on the ensemble mean forecasts of NUIST-CFS 1.0 and seven CGCMs from C3S Seasonal Forecast datasets. Numbers in parentheses indicate the (min,max) ACC skill based on the individual member. Statistically significant correlations at the 95% confidence level are indicated in bold.
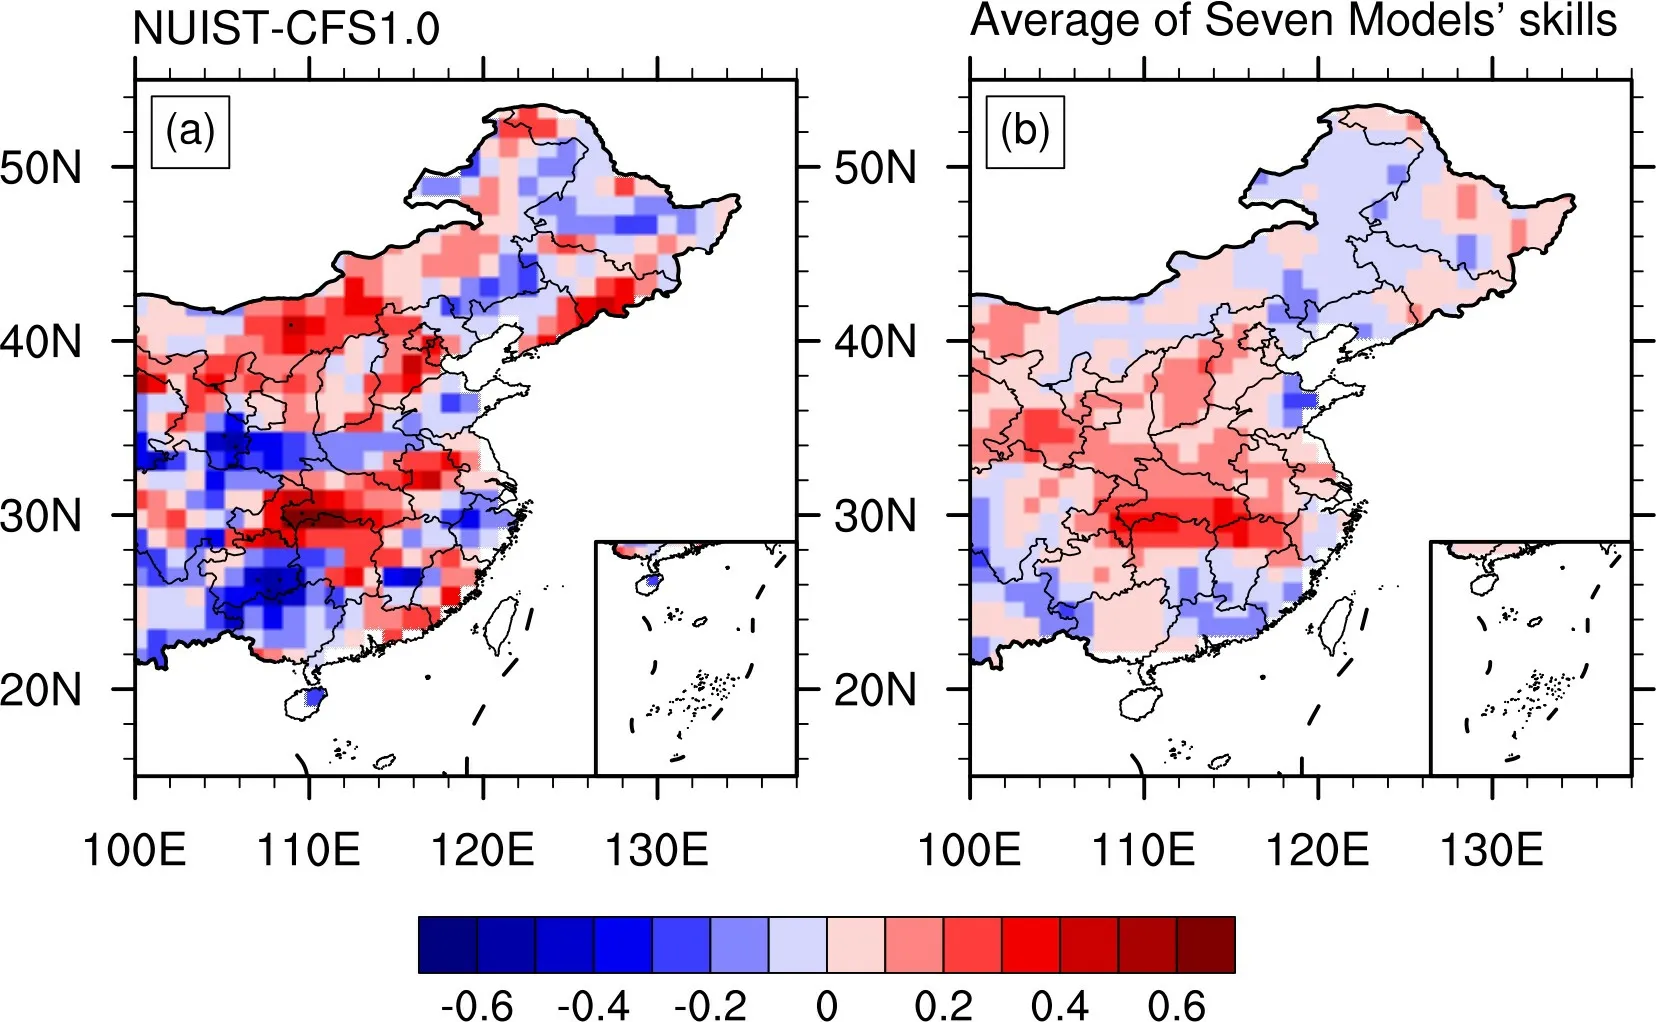
Fig. 10. (a) ACC skill in predicting JJA precipitation anomalies over East China based on the NUISTCFS1.0 nine-member ensemble mean forecasts during 1993–2016. (b) As in (a), but for the averaged skill of the seven CGCMs’ ensemble mean hindcasts (see Table 4). Stippling indicates the correlation exceeds the 95%confidence level.
Concerning the extreme summer mean precipitation events over the past four decades that often brought about huge damages, NUIST-CFS1.0 successfully predicts three of the seven events (i.e., 1983, 1998, and 2016). The wet con-ditions in the summers of 2015 and 2020 are also predicted but with underestimated magnitudes. In all these successfully predicted extreme precipitation cases, significant warm SST anomalies in the tropics can be found, and the WNPSM index and atmospheric response to the tropical SST forcing are also reproduced well. In contrast, in the two failed cases(i.e., 1996 and 1999), either synoptic extreme precipitation events or extratropical forcing appears to be responsible for the seasonal mean extreme precipitation anomalies. The former is difficult to predict on a seasonal time scale, and the latter indicates a deficiency in NUIST-CFS1.0, which may be one issue to be improved in the future. It is worth noting that other factors besides the tropical SST forcing may also affect the MLYR precipitation in summer. For instance, previous studies have suggested that the signals in the middle and high latitudes such as the North Atlantic Oscillation,sea ice cover, and atmosphere blockings may play a role in the interannual variations of the WNPSM and MLYR precipitation (e.g., Liu et al., 2020; Chen et al., 2021). Predictive skill of these factors and their possible impacts on the MLYR precipitation in the seasonal forecast systems warrants future studies.
With a higher spatial resolution, the WRF downscaling helps improve the NUIST-CFS1.0 forecasts of rainfall locations and magnitudes during the extremely wet summers,which can provide useful information in advance of climate disasters, allowing contingency planners to alleviate possible damages. However, it should be acknowledged that the skill of the dynamical downscaling hindcasts appears to be largely dependent on the performance of the global model forecasts. Thus, improvement of the large-scale circulation forecasts, such as bias corrections of the CGCM forecasts and/or improvement of the CGCM’s performance in simulating East Asian climate, may be crucial to obtaining better downscaling forecasts at finer resolutions.
It is worth noting that we used a spectral nudging of the global model forecasts over the downscaling area to constrain the WRF simulations and to reduce possible biases caused by the imperfect RCM. In this study, we chose the nudging coefficient of 3 × 10⁻⁴s–1, which is a default value in WRF.However, previous studies have recommended a weak nudging coefficient, or even no spectral nudging, if the downscaling target is only to improve precipitation simulation (e.g.,Xu and Yang, 2015). Possible influence of different nudging coefficients on the performance of dynamical downscaling predictions of summer precipitation in East China warrants a future study.
In summary, NUIST-CFS1.0 could provide skillful predictions of the tropical SST anomalies and their related WNPSM. The WRF downscaling with a higher resolution over East Asia can improve the predictions of extreme precipitation events over the MLYR region. To further improve the seasonal prediction skill of regional summer precipitation,dynamical downscaling with finer resolutions and updated physics as well as statistical downscaling should be explored in future studies. For instance, the development of coupled regional ocean–atmosphere–land surface models will provide a promising approach to improve the downscaling forecasts (e.g., Ratnam et al., 2013; Yao et al., 2010;Zou et al., 2020). In addition, with the rapid development of machine learning that can better capture the complex nonlinear interactions among different phenomena (Ham et al.,2019; Kim et al., 2021), it will be useful to apply this new method to improving the downscaling forecasts of summer precipitation in East China. Recent studies have also suggested that the machine learning method can be applied to improve the simulations of subgrid scale processes (Gentine et al., 2018; Bolton and Zanna, 2019), which will help improve the global and regional model simulations of East Asian climate.
Acknowledgements.This work is supported by National Natural Science Foundation of China (Grant Nos. 42030605 and 42088101) and National Key R&D Program of China (Grant No.
2020YFA0608004). The model simulation is conducted in the High Performance Computing Center of Nanjing University of Information Science & Technology. The Hadley monthly mean SST data is downloaded from https://www.metoffice.gov.uk/hadobs/hadisst/data/download.html. CMAP precipitation data and NCEP–NCAR Reanalysis-II data provided by the NOAA/OAR/ESRL PSL, Boulder, Colorado, USA, are downloaded from the website at https://psl.noaa.gov/.
Electronic supplementary material:Supplementary material is available in the online version of this article at https://doi.org/10.1007/s00376-022-1389-7.
杂志排行

Advances in Atmospheric Sciences的其它文章
- Erratum to: Stratospheric Ozone-induced Cloud Radiative Effects on Antarctic Sea Ice
- Correction to: Correlation Structures between Satellite All-Sky Infrared Brightness Temperatures and the Atmospheric State at Storm Scales
- Observed Frequent Occurrences of Marine Heatwaves in Most Ocean Regions during the Last Two Decades
- Spatiotemporal Variations of Microwave Land Surface Emissivity(MLSE) over China Derived from Four-Year Recalibrated Fengyun 3B MWRI Data
- Energy Paths that Sustain the Warm-Sector Torrential Rainfall over South China and Their Contrasts to the Frontal Rainfall: A Case Study
- Effects of Drag Coefficients on Surface Heat Flux during Typhoon Kalmaegi (2014)