Mechanical behavior of Ti-6Al-4V lattice-walled tubes under uniaxial compression
2022-07-27GenzhuFengJingWngXinyunLiLijunXioWeidongSong
Gen-zhu Feng , Jing Wng , Xin-yun Li , Li-jun Xio ,**, Wei-dong Song ,*
a State Key Laboratory of Explosion Science and Technology, Beijing Institute of Technology, Beijing,100081, China
b Earthquake Engineering Research Center, China Institute of Water Resources and Hydropower Research, Beijing,100048, PR China
c Beijing Research Institute of Automation for Machinery Industry Co., Ltd, Beijing,100120, China
Keywords:Lattice-walled tubes Plastic hinge theory Numerical simulation Critical velocity
ABSTRACT The compression behavior of the lattice-walled tubes under variable strain rates are investigated by numerical simulation, and the stress-strain relationship of the structure under quasi-static loading is theoretically analyzed.The finite element software LS-DYNA is used to simulate the structure established by the beam element, and the critical impact velocity is obtained when the structure collapses layer by layer. According to the plastic hinge theory and considering the combined action of the beam's bending moment and axial force in the structure,the stress-strain relationship of the structure under quasi-static loading is derived and compared with the experimental results. The numerical simulation results reveal that the structure of the single-layer gradient tube(SGC) does not undergo shear deformation under quasi-static and low-speed impact.The critical speed of the gradient square tube(GS)is higher than that of a cylindrical tube.The theoretical model can correctly reflect the mechanical response of the structure under uniaxial compression.
1. Introduction
Thin-walled metal tubes are widely utilized in impact absorption and vehicle crashworthiness applications because of their lightweight, high strength, excellent energy absorption performance and impact resistance [1-4]. In the aerospace and defense industries, there are also high requirements for the crashworthiness and energy absorption performance of some structural components. As a light-weight, high-efficiency energy-absorbing component, thin-walled tubes also play an important role in the aerospace and defense industries[5-8].The lattice structures have been widely used in missile tails[9],armor[10],thermal controllers of the spacecraft [11] and tank armored protection due to its excellent impact resistance. In order to achieve the lightweight design requirements for the tube absorber, researchers combined lattice structures with conventional tubes to improve the overall mechanical properties of the structure. The lattice-walled structures designed by this method have higher strength and lighter weight, which has great application potential in spacecraft and defense industries. Therefore, the mechanical mechanism and improvement of energy absorption performance of the latticewalled structures have attracted extensive attention [12-15].
The porous materials and lattice structure have attracted the attention of domestic and foreign scholars due to the excellent energy absorption characteristics. For traditional two-dimensional lattice structures such as honeycomb and triangular Grids have been studied in Refs. [16-21]. Lan et al. [22] established the continuous-density graded cellar material based on the 3D Voronoi model, and obtained the energy absorption capacity under different blast loading. For three-dimensional lattice structures,Babaee et al. [23] theoretically analyzed the equivalent elastic modulus of the rhombic dodecahedron structures in different loading directions and the equivalent stress expression of the structure under bending dominance. They found that the stiffness of cellar structure in direction 2 and 3 is twice as high as that of direction 1.However,in theoretical analysis,the effect of axial force on the equivalent yield strength is not considered in the post-yield phase of the structure. Ozdemir [24,25]conducted static and dynamic experiments to explore the deformation and the energyabsorbing properties of cubic and diamond lattices. The experimental results indicate that the lattice structure can reduce the peak impact stress,and the structure deformation has obvious rate dependence. Del et al. [26] studied the mechanical properties of three different lattice structures by quasi-static compression tests,and obtained the effects of different geometric structures, dimensions and relative densities on the compressive strength of the structure. Xiao et al. [27,28] introduced the deformation and mechanical response of typical rhombic dodecahedron lattice structures under different temperatures. In addition, the mechanical properties of the structure under different strain rates have been studied through theoretical analysis, experiments, and numerical simulations. The results indicate that the shear band of the structure occurs along the direction of 45at room temperature and as the temperature increases, the energy absorption efficiency of the structure increases. Singh [29]obtained two graded micro-lattice structures by changing the thickness of the strut, and experimentally studied the deformation and mechanical properties of the structure. Xiao [30,31] studied the deformation and collapse behavior of the graded metal lattice structure through experiments.The results show that the deformation mode of the structure is mainly shear failure in the low-density area of the structure, and the specific energy absorption of the gradient structure is higher than that of the uniform structure. Li et al. [32] analyzed the deformation mechanism of the structure through experiments,and obtained the micro morphology of the strut fracture surface through the micro analysis.The lattice structures of other unit cell types have also received in-depth research[33-36].
For the reason that the mechanical properties of the thin-walled tube in terms of energy absorption need to be improved, Liu et al.[37,38]redesigned the shape of the tube wall and investigated the buckling mode and deformation process of the corrugated tubes and pre-folded tubes through different research methods.Baroutaji et al.[39]reviewed some tube wall forms and designs and gave the deformation characteristics of these tubes under different loading conditions. Subsequently, they summarized some principles and methods for crashworthiness design and optimization.Baykasoglu et al. [40]conducted the axial impact tests of the novel lattice structure filled square thin-walled tubes and optimized the structure by studying its crashworthiness.The results of the study show that the energy absorption performance and impact resistance of a new type of filled square thin-walled tubes can be effectively enhanced. Lan et al. [41] researched the mechanical response of novel cylindrical sandwich panel under air blast loading by the numerical simulation,and optimized the structure design through parametric analysis. The preparation and mechanical properties of carbon fiber reinforced composite sandwich cylinder with Kagome core were studied by Li and Chen et al.[42,43].It was found that the strength and stiffness of the carbon fiber reinforced round tube were significantly improved. Guo et al. [44] studied the deformation and energy absorption performance of negative Poisson's ratio cylindrical structures through experiments and numerical simulation.The results showed that the energy absorption performance of the negative Poisson's ratio cylindrical structures was significantly higher than that of the traditional cylindrical lattice shell. Other types of thin-walled tubes of unit cells such as hexagonal honeycomb, square lattice and diagonal square lattice have also been discussed respectively [45-47]. Chen et al. [48] derived the theoretical formula of the platform stress of the latticed tubes under impact load and the deformation law of the structure is studied by numerical simulation. Li et al. [49] experimentally studied the deformation and mechanical response of lattice-walled tubes under different impact loads,and the results of the study revealed that the initial peak stress of square tubes under low-velocity impact is higher than that of cylindrical tubes, and the structure type of the gradient square tube has the best energy absorption performance.Nevertheless, the research on metal lattice-walled tubes are not extensive,especially in the establishment of theoretical models and numerical simulations.In summary,there have been more in-depth studies on two-dimensional lattice thin-walled tubes,but the thinwalled tubes designed by the three-dimensional lattice structures need further research in mechanical behavior and other aspects.
In this work, the plastic yield behavior of the lattice-walled tubes was studied, the stress-strain relationship of the tubes under quasi-static compressive load was obtained and compared with the experimental results. According to the results of previous experiments, the mechanical response and deformation of the Ti-6Al-4V lattice-walled tubes under different loading speeds were investigated by the numerical simulation. Experimental results verify the accuracy of the numerical simulation results, and further explored the relationship between the mechanical response and deformation of the structure. Finally, the critical values of the impact velocities when the structure collapses layer by layer were obtained.
2. Theoretical analysis
2.1. Elastic performance analysis
Based on the previous work involving rhombic dodecahedron structures [23,27,28,31,49], the Ti-6Al-4V lattice-walled tubes were analyzed in this work.Fig.1 shows the process of forming the structural unite cell by the internal strut. For a rhombic dodecahedron unit cell,when the volume of the repeating part of the strut is ignored,the relative density ρ* can be expressed as:

By considering the elastic deformation at small deformation stage, the deformation of point A under axial force and the combined action of bending moment and shear force can be expressed as:
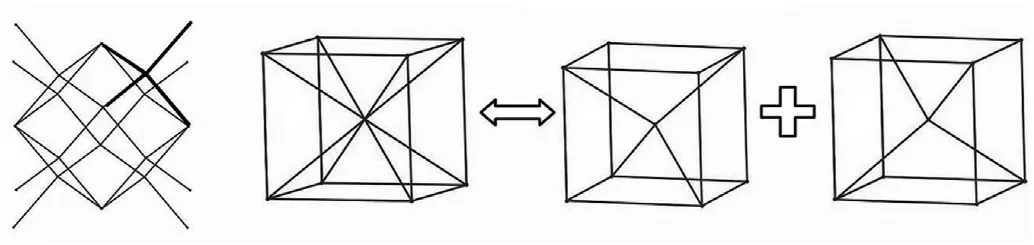
Fig.1. The sketch of the rhombic dodecahedron.

Fig. 2. The deformation analysis of smallest repeated cell: (a) the smallest repeated cell; (b) the force diagram of the strut.

2.2. Post-collapse behavior analysis
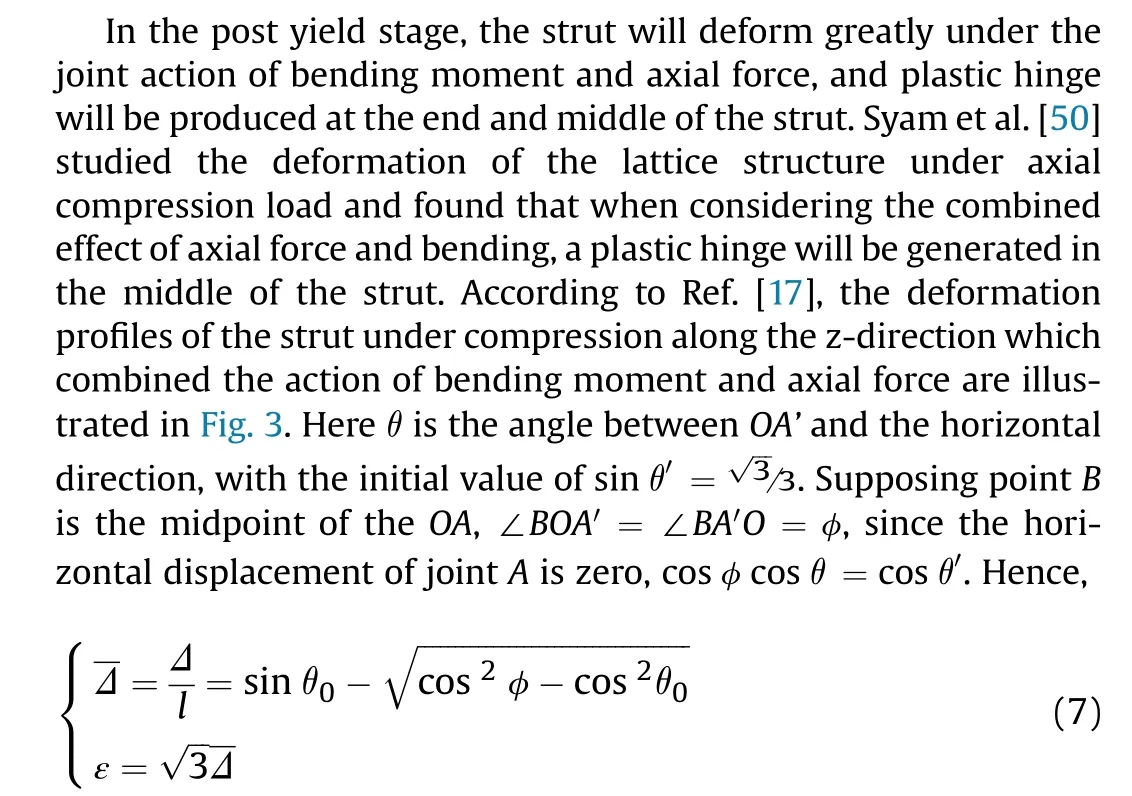
In the light of plastic hinge theory and yield conditions of beam under the action of bending moment and axial force,the equation is given as:
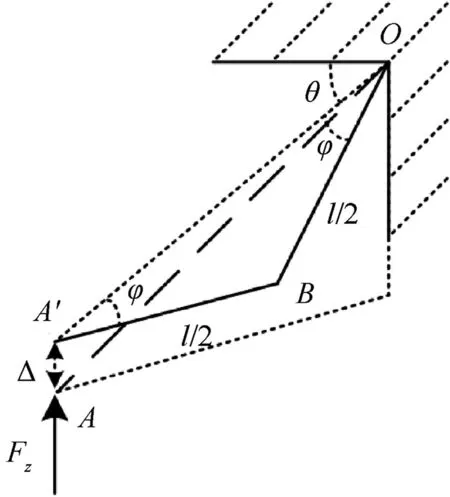
Fig. 3. Collapse mechanisms of the strut under z uniaxial compression.
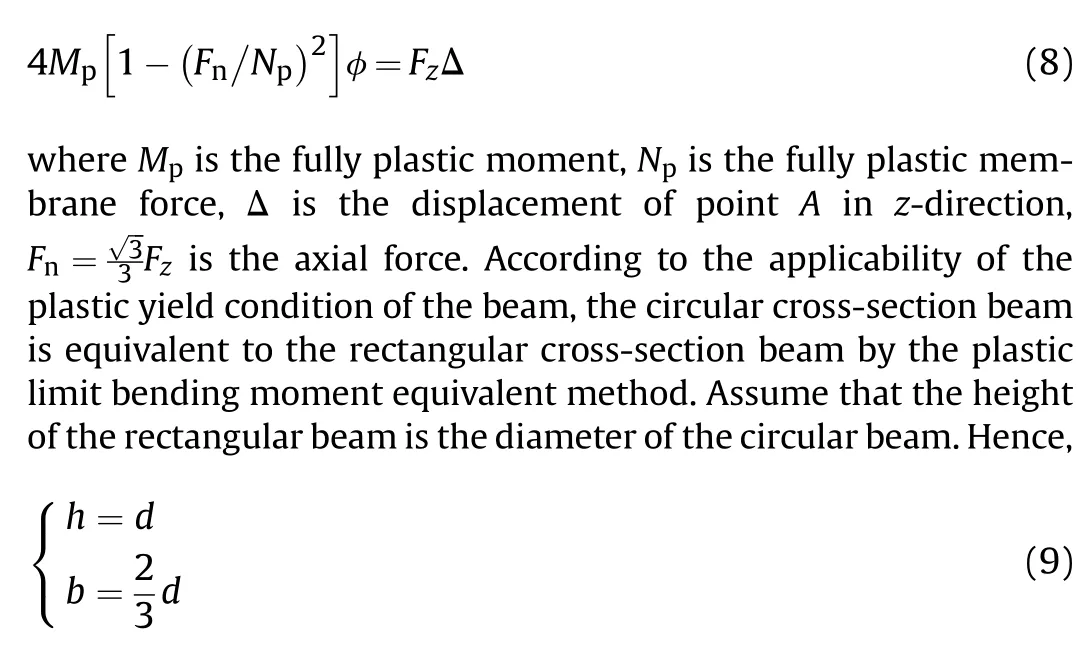
where h is the height of the rectangular beam,b is the weight of the rectangular beam.
The relative density of the structure after equivalence can be written as:
where Vis the volume of tube wall, V is the volume of tube.
3. Numerical simulation results
3.1. Structure fabrication and experimental details
All specimens used in the experiment are prepared by SLM printing technology on BLT-S200 3D metal printer of the cooperation of Xi'an Bright Laser Technologies LTD.The maximum printing size of BLT-S200 is 105×105×200 mm.The 3D printer is equipped with a laser with a maximum power of 500 W, the maximum scanning speed is 7 m/s and the laser spot diameter is 0.1 mm. In the printing process,spherical Ti-6Al-4V powder with a diameter of 50 μm is used for printing.The thickness of the printing layer is 50 μm,the average scanning speed of laser is 1.5 m/s,and the fastest laying time of metal powder layer is 5 s.At the same time,the MCS software inside the printer can record and analyze the printing process to ensure the overall quality of printing. The specimens obtained by SLM printing are shown in Fig. 4.
In reference [49], we have explored the mechanical performance of 3D printing Ti-6Al-4V lattice-walled tubes,under quasistatic,low-speed impact and high-speed impact loading.The quasistatic tests are carried out by using an electronic universal testing machine,and the dynamic impact tests are performed on the drop hammer and direct impact Hopkinson pressure bar,respectively.In order to explore the influence of the lattice-walled tube section shape, gradient and the number of lattice structure layers on the mechanical properties,experiment specimens with different lattice structures are prepared. Through experiments, the deformation mode of the 3D printing Ti-6Al-4V lattice-walled tubes under different strain rate loads is obtained, and the energy absorption performance of the structures are analyzed.
The quasi-static compression test is carried out on WDW-300 electronic universal testing machine which had the maximum range of 300 kN. The specimen is placed in the middle of the universal testing machine experimental platform and coated with vaseline to reduce the influence of friction on the experimental results.In the experiment,the strain rate of the whole specimen is 0.001 s, the photoelectric encoder installed on the indenter can accurately obtain the displacement of the indenter, and the displacement accuracy can reach 10mm.

Fig. 4. The SLM fabricated specimen.
The low speed dynamic experiment is carried out on the DHR940 drop hammer test machine of Taiyuan University of Technology and the maximum height of the drop hammer test machine is 13 m and the maximum weight of the drop hammer head is 270 kg,as shown in Fig.5.In the low speed impact test,the total weight of hammer head and counterweight which is made of high strength steel is 37.69 kg, and the height of hammer head is calculated according to the preset impact speed. The force-time data are recorded by a mechanical sensor with a range of 2000 kN,and the deformation process of the specimen is recorded by a high-speed camera with a recording frequency of 1000 fps/s.
The high speed impact test is carried out on the direct-impact Hopkinson pressure bar test equipment. The sketch of the directimpact Hopkinson pressure bar is shown in Fig. 6. Different from the split Hopkinson pressure bar, the direct impact Hopkinson pressure bar can obtain higher impact velocity because the bullet directly impacts the specimen. The diameter of the direct-impact Hopkinson pressure bar used in the experiment is 74 mm, and the length of the test bar is 2730 mm. In order to obtain higher velocity of the bullet, the bullet is designed to be hollow, and the initial velocity of the bullet in the experiment is about 100 m/s.High speed camera is also used to record the whole deformation process of the specimen.
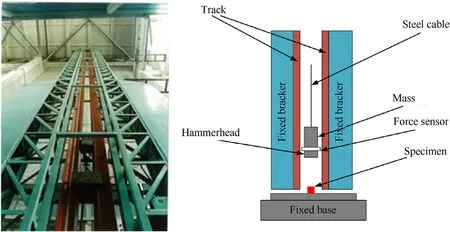
Fig. 5. DHR940 drop hammer test machine and sketch.
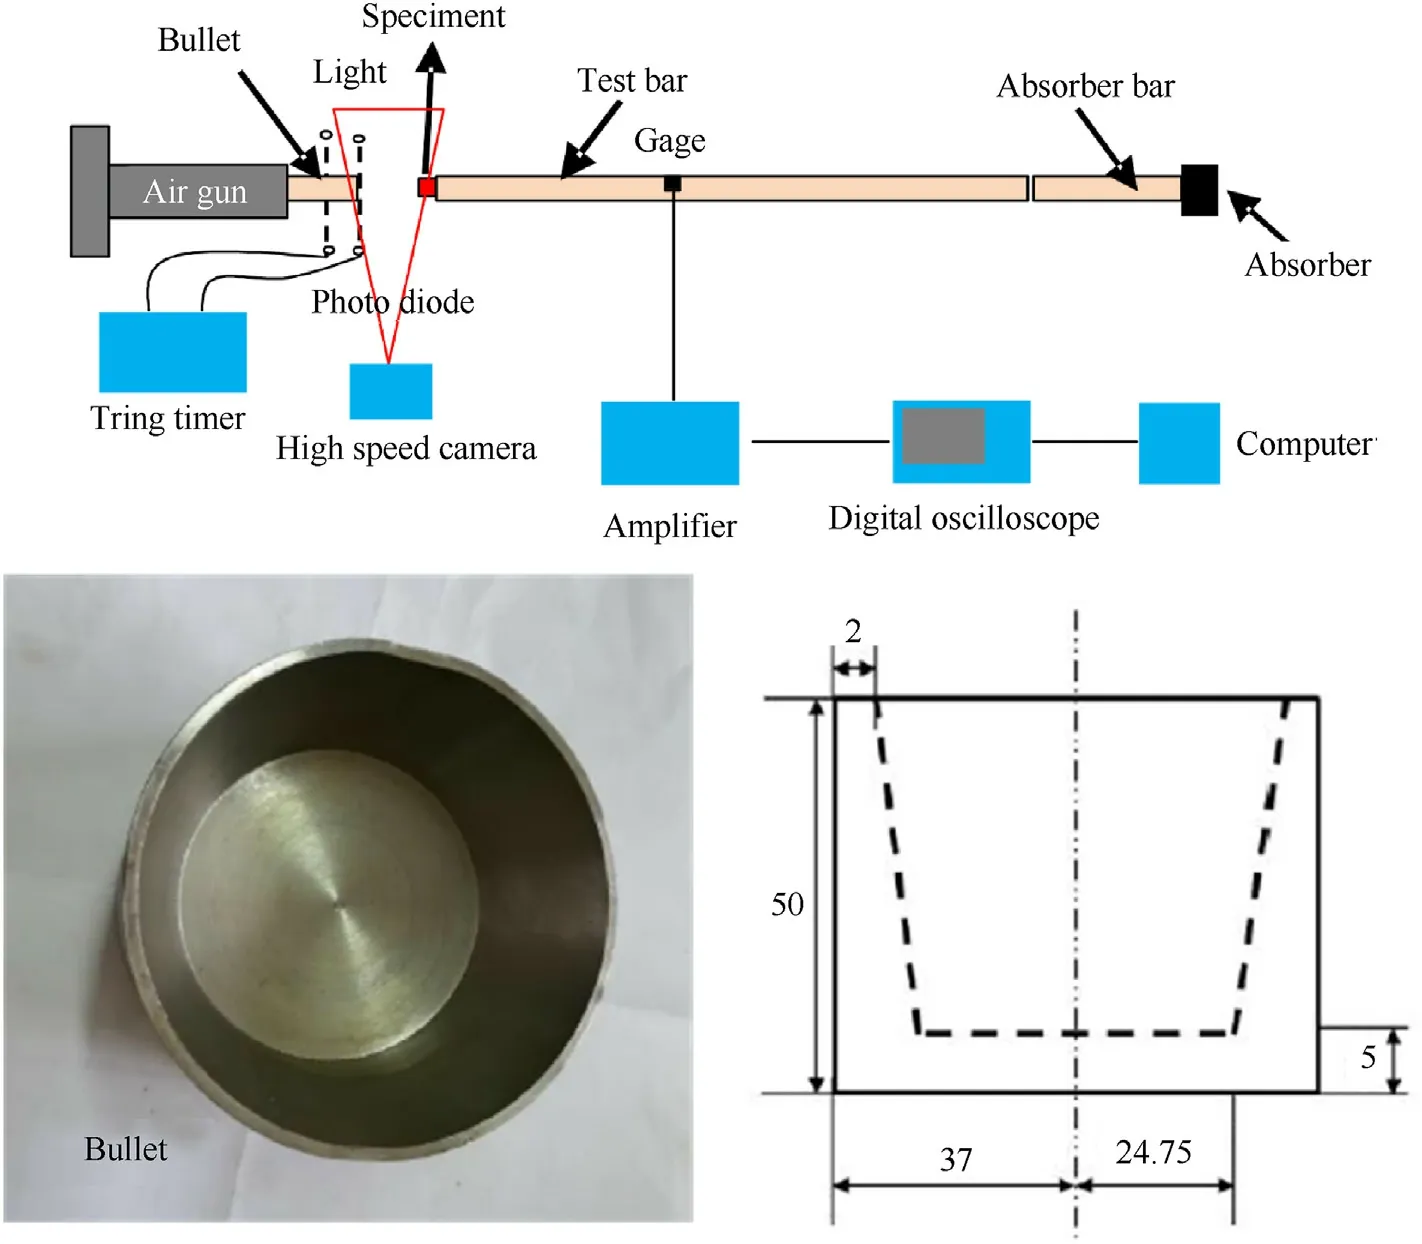
Fig. 6. Sketch of direct-impact Hopkinson pressure bar and the bullet.
3.2. FE modeling and material parameters
The beam element in the LS-DYNA finite element software can be used to accurately obtain the mechanical properties and deformation mode of the lattice structure under different strain rates.Referring to the CAD models designed in Solidworks,the numerical models were established by LS-DYNA to simulate the mechanical behavior of the SLM fabricated Ti-6Al-4V lattice thin-walled samples [49]. The 3D model of the structural unit cell is shown in Fig. 7. By changing the unit cell array pattern and unit cell size,several different lattice-walled tube structures are obtained. All kinds of structures contained gradient square tube (GS), singlelayer tube (SC), single-layer gradient tube (SGC), double-layer tube (DC) and double-layer gradient tube (DGC). Here,the symbol“G” represented that density gradient was designed in the structure. For the structure of GS, in order to introduce the concept of gradient,the unit cell size of each layer from the bottom to the top of the tube was uniformly increased from 3 × 3 × 2 mm to 3 × 3 × 4 mm, and the height difference between adjacent layers was 0.25 mm. Fig. 8 shows the geometric model of the gradient square tube.
For the establishment of tube model,the smallest repeating unit cell of the tube is established in a sector area with a central angle of 9, and a unit cell with both axial and radial lengths of 4 mm is obtained by mirroring(Fig.9(a)).The inner radius and outer radius of the fan-shaped area are 13 mm and 17 mm, respectively. Using the same method,the unit cell of the double-layer cylindrical tube can be obtained as shown in Fig. 9(b). As shown in Fig. 10, the structure of SC and DC can be obtained by arraying the unit cells in the circumferential and axial directions. For graded cylindrical tubes,it is obtained by changing the height of the unit cell along the axial direction. Along the positive gradient direction of SGC and DGC,the unit cell's height changes from 3.25 mm to 5.25 mm with a total of 9 layers and the height difference of each layer is 0.25 mm.The structure models of two graded cylindrical tubes are shown in Fig.11.
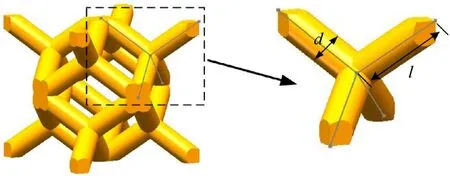
Fig. 7. 3D model of structural unit cell.

Fig. 8. Gradient square tube (GS).
The loading system for quasi-static and low/high velocity impact tests can be simplified as one fixed rigid wall, one moving rigid wall and a lattice-walled tube, as shown in Fig. 12. For the moving rigid wall, the loading speed v in numerical simulation is exactly the same as that in the experiment.Considering the mass of the moving rigid wall, RIGIDWALL-PLANAR-FINITE MOVING was adopted, while the keyword RIGIDWALL-GEOMETRIC-FLAT was used for the fixed one. In order to determine the diameter of the support in the numerical simulation, the microscopic features of the structure were observed through a scanning electron microscope. The SEM images are exhibited in Fig.13. By measuring the diameter of different positions of the strut, the calculated average diameter of the strut is about 440 μm and it was found that the relative density of the structure obtained by using the average diameter was basically consistent with the actual relative density.By comparing the numerical predictions with the experimental results, it was found that the numerical predictions were in good agreement with the experimental results. Therefore, in the numerical simulation, the beam element was used and the strut diameter was determined to be 0.44 mm. The influence of the initial defects on the mechanical behavior can be considered to a certain extent by using this method.Ozdemir[25]reported similar results by using beam elements and also obtained relatively accurate results.Through the mesh sensitivity analysis,it was found that the numerical simulation results converge well once the mesh size is 0.1 mm. In the FE simulations, CONTACT-AUTOMATIC-SINGLESURFACE was employed to define the self-contact algorithm.
In the numerical simulation,the Ti-6Al-4V material model was defined by the MAT_PIECEWISE-LINEAR-PLASTICITY keyword which can use the effective plastic stress-strain curve at different strain rates to define the elastic-plastic behavior.In order to obtain the base material parameters under different strain rates, the stress-strain curves of 3D printed Ti-6Al-4V material were obtained by carrying out experimental studies at different strain rates.The true stress-true strain curves under different strain rates were shown in Fig.14. Based on the experimental results and reference[25], we choose 0.3 as the failure strain of the base material and found that the numerical simulation results were in good agreement with the experimental results, and similar results were also reported by Ozdemir[25], which further verified the rationality of the failure strain parameters. Therefore, in the numerical simulation, we set the value of the failure strain to 0.3. The relevant parameters of the piecewise linear plastic material model were shown in Table 1, and the basic unit system was kg-mm-s.
3.3. Loading response
3.3.1. Quasi-static loading
Numerical and experiment quasi-static[49]force-time response of SGC,DC and DGC which are compressed at a strain rate of 0.001 sis superimposed in Fig.15, respectively. For quasi-static finite element simulation, so as to reduce the amount of calculation and control the calculation time,the mass scaling artificial control time step is used.In order to ensure the calculation accuracy,the general mass increase should be controlled within 5%, and the ratio of kinetic energy to internal energy cannot exceed 0.1.
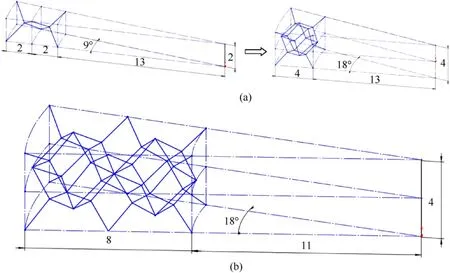
Fig. 9. The schematic diagram of the unit cell for circular tubes: (a)single-layer; (b) double-layer.

Fig.10. The model diagram of two uniform cylindrical tubes: (a) SC; (b) DC.
Fig.11. The model diagram of two graded cylindrical tubes: (a) SGC; (b) DGC.
As shown in Fig. 15, the curve trend of the finite element simulation results is basically consistent with the experimental results. The numerical simulation results only show the front part of the curve, this is because when large deformation occurs, the struts of the structure break,which makes the deformation process of the structure more complicated and the contact of the structure more complicated in the numerical simulation.Due to the influence of the above factors, the numerical calculation was difficult to continue when the calculation reaches a certain level. Therefore,only the first half of the curve of the numerical simulation was selected to compare with the experimental results. The force-time curve of the structure is mainly divided into three parts: elastic stage,plateau stage,compaction.Because of the non-uniformity of SGC and DGC during 3D printing,the simulation curves of SGC and DGC slow down as it approaches the initial peak force, which causes the time to reach the initial peak force to be delayed.Due to the contact between the beam and the beam in the structure during the experiment, the experimental curve platform part is higher than the numerical simulation result.
3.3.2. Low speed impact
The experimental [49]and numerical force-time histories of all the configurations are portrayed in Fig. 16. According to the experiments setting, the loading velocity of the structure is listed in Table 2.
It can be observed from Fig. 16(a), the slope of the elastic segment of the numerical simulation curve is greater than the experimental results, and the initial peak force is lower than the experimental results.The second peak of the first half of the curve in the experimental results is close to the height of the initial peak,and the simulation results also have two peaks of similar height.

Fig.12. FE model of lattice-walled tube subject to uniaxial compression loading.
For the simulation results of cylindrical tube,it can be concluded from Fig.16(b)-16(e), the phase of the elastic segment of the numerical simulation curve is comparable analogous to the experimental results. In the numerical simulation, the beam element is automatically deleted after it reaches the failure strain, which causes the structural bearing capacity to decrease after the collapse.Therefore,the initial peak forces of numerical simulation curves are lower than the experimental results. In the post-yield stage, the numerical simulation curve is flatter than the experimental curve,and the value is lower than the experimental result.
3.3.3. High speed impact
The DHPB tests doled out with bullet on SC and DC were delineated in detail in Ref. [49]. In the numerical simulation, in order to facilitate the calculation, the bullet is simplified as a rigid plate,and the loading speed of the rigid plate is 100 m/s, which is the same as that in the experiment. Fig.17 depicts the force-time curves of the two structures and there is no obvious plateau in the curve. Due to the influence of gravity, the test specimen is not completely flush with the end face of the rod during the high-speed impact test, so the fall time and rise time of the numerical simulation curve are not exactly the same as the experimental results.
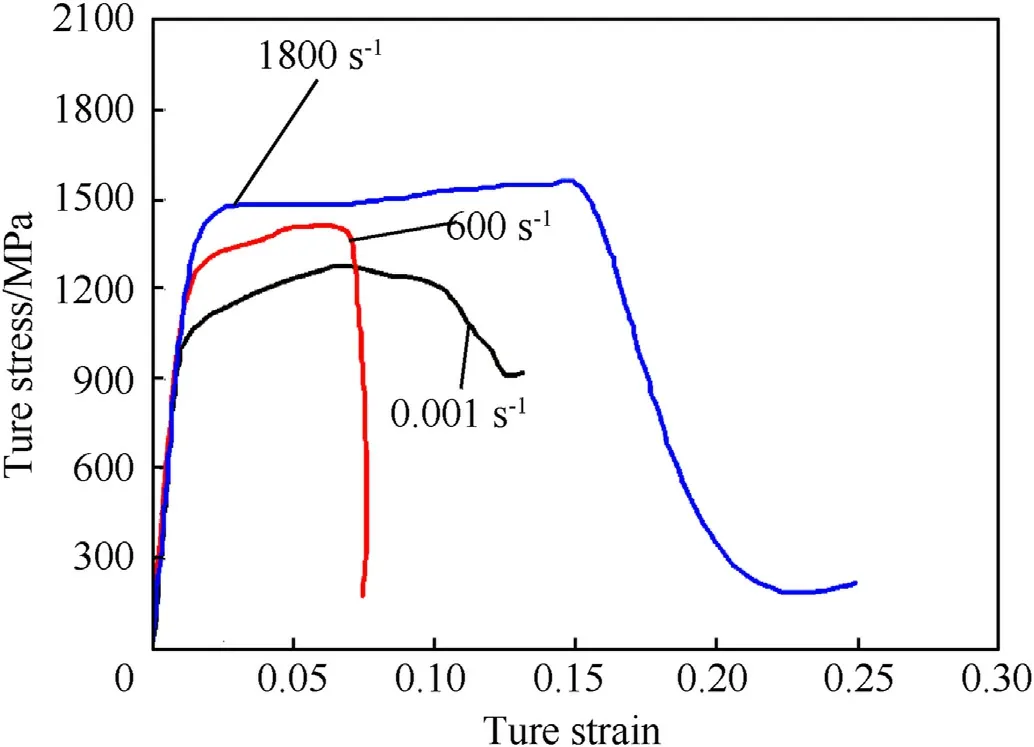
Fig.14. Stress-strain curves under different strain rates of the Ti-6Al-4V material.

Table 1 Piecewise linear plastic material model parameters.
3.4. Deformation and failure mode
3.4.1. Structural deformation modes in numerical simulations and experiments

Fig.13. SEM observation of the strut [49].
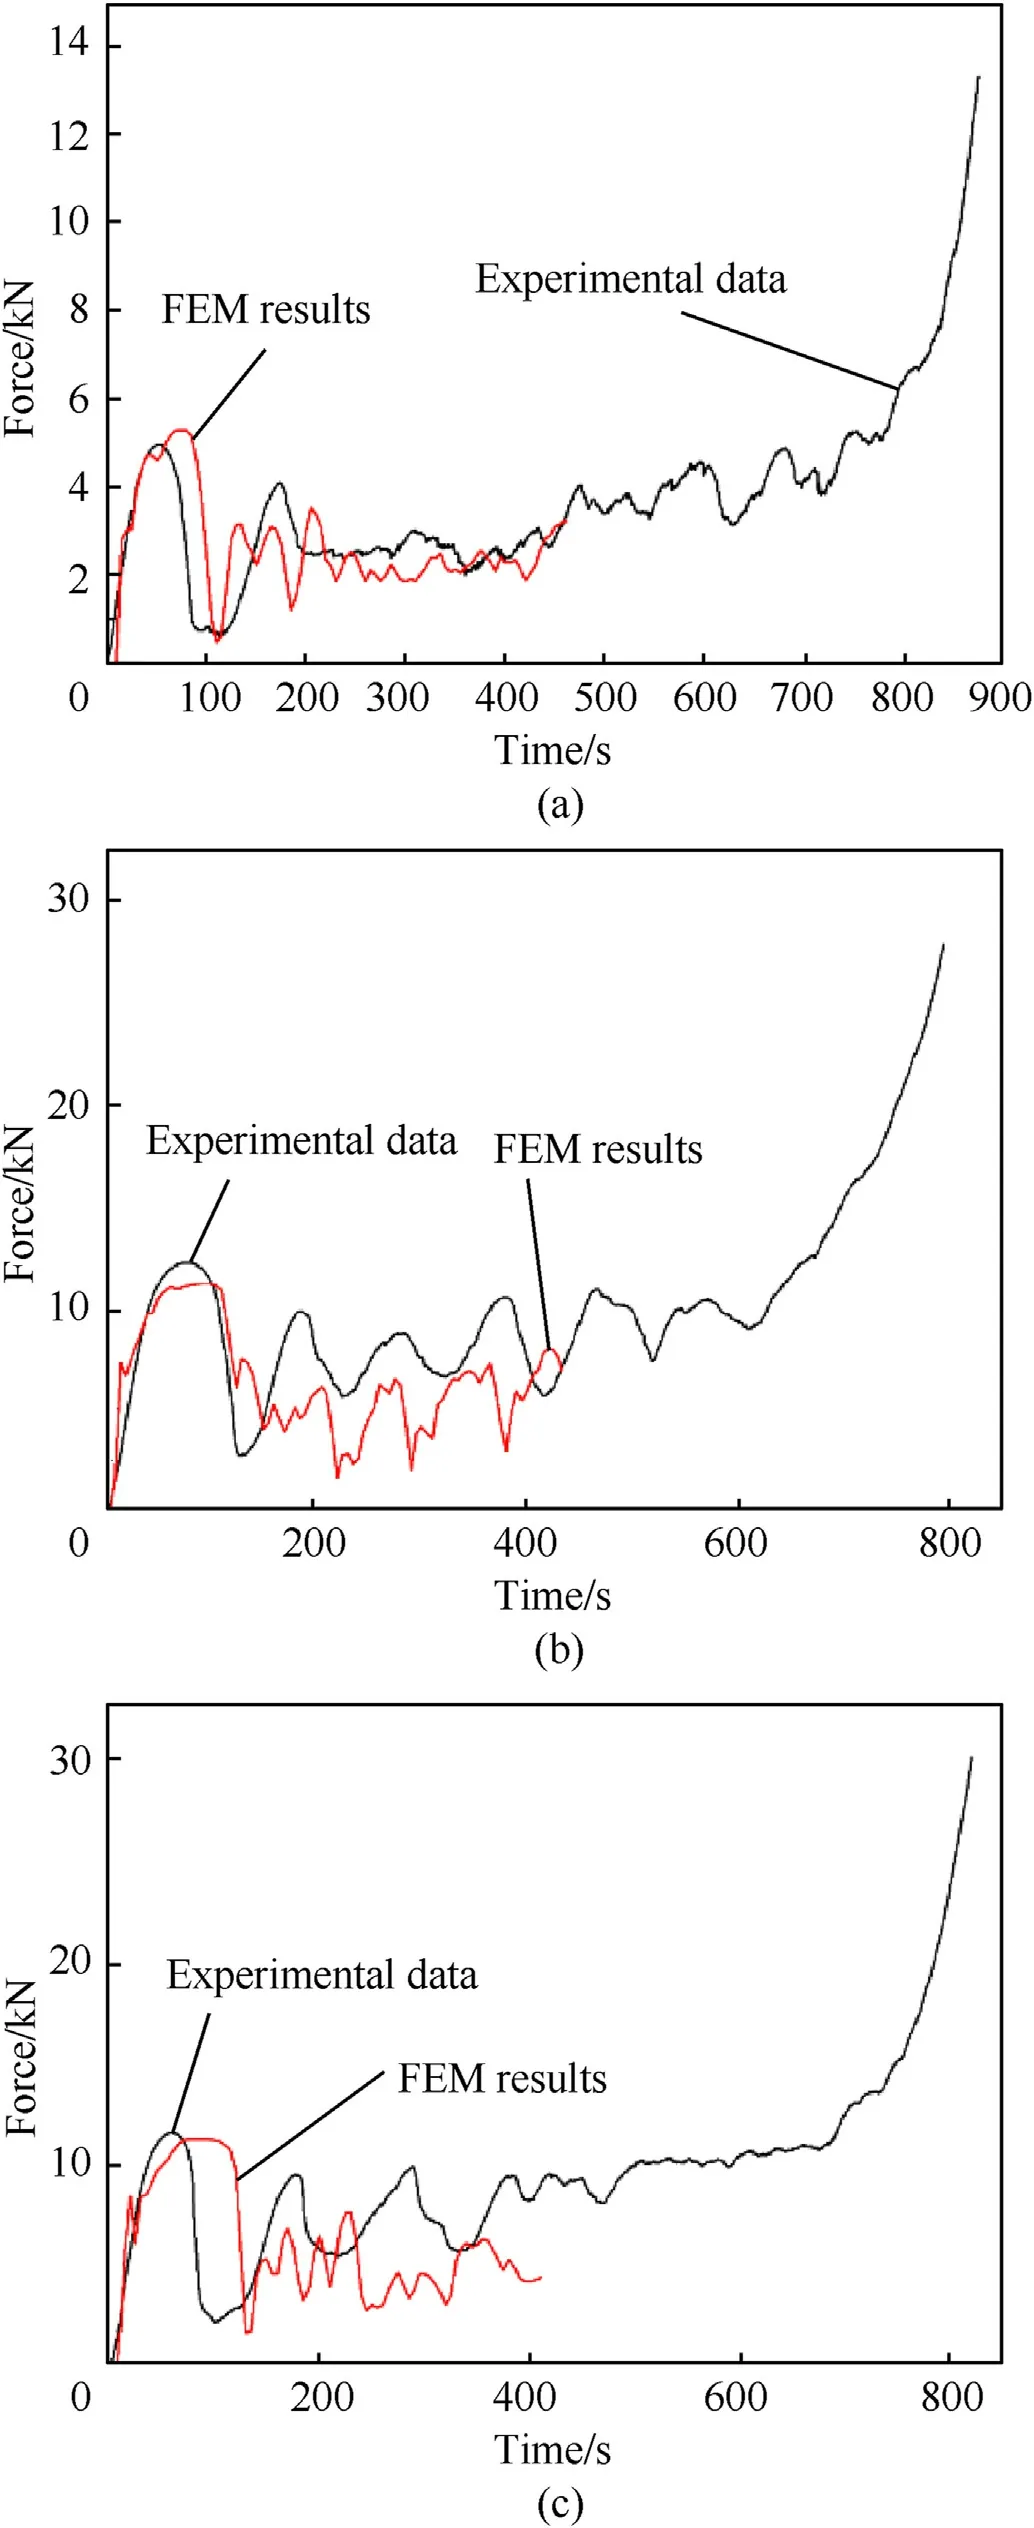
Fig. 15. Force-time curves of experiments and numerical simulations under quasistatic loading: (a) SGC; (b) DC; (c) DGC.
In order to verify the reliability of the structural deformation mode obtained by the finite element simulation, several typical deformation modes of the structure appearing in the experiment are numerically simulated.The deformation of SGC and DGC under quasi-static loading conditions are shown in Fig.18. We can know from Fig.18 that the finite element simulation results are basically consistent with the experimental results and the structure collapses layer by layer near the upper part of the structure. For the DGC, because the experimental model has random defects during the 3D printing process,the finite element model is more uniform than the 3D printing model. Therefore, the shear effect of deformation in the numerical simulation results is not obvious.
Under low-speed impact load,the deformation modes of GS and SC are shown in Fig. 19. The superstructure of GS has obvious deformation and is consistent with the test results. SC has no obvious shear failure in the numerical simulation and experimental results. Under high-speed impact load, the deformation of SC and DC is collapsed layer by layer(Fig.20),and the numerical simulation and experimental results [49] are in good agreement.
3.4.2. Deformation mode of the structure under different impact velocity
In the previous content, the mechanical response and deformation modes of different structural models under different loading speeds are studied. From the results of experiments and numerical simulations, it can be known that the deformation modes of the structure under different loading speeds are different.It has been proved that the deformation mode of porous materials will be changed with the loading speed,which can be divided into three categories and some scholars have conducted in-depth research on this phenomenon[51-53].
In order to obtain the critical speed,some numerical simulation studies on these structures with different impact speeds were conducted. As shown in Fig. 19 (b), during low-speed impact(v = 2.82 m/s), the structure of SC mainly collapses layerby-layer deformation mode, and the phenomenon of layer-bylayer collapse deformation mode occurs during low-speed impact, which may be related to the forming direction in the 3D printing process. At low impact speed, the deformation of DC(Fig.21)occurs in the middle of the structure.As the loading speed increases to a certain value, the structural deformation mode gradually changes from the shear deformation in the middle of the structure to the layer-by-layer collapse at the top of the structure.When the structure is completely collapsed layer by layer, the impact velocity is 45 m/s.
Fig. 22 exhibits the deformation modes of three different gradient structures at different impact speeds. For graded latticewalled square tube (GS), when the speed is low, the structure undergoes obvious shear deformation. As the speed increases, the shear deformation effect gradually weakens. When the impact speed is 75 m/s, the top of the structure collapses layer by layer.However,the structure of SGC did not undergo shear failure during low-speed impact(Fig.19(c))and we can know from Fig.22(b)that when the impact velocity is 37.5 m/s, the structure collapses layer by layer at the top. For the structure of DGC, when the impact velocity is 45 m/s, the structure collapses layer by layer.
4. Results and discussion
4.1. Theoretical analysis results
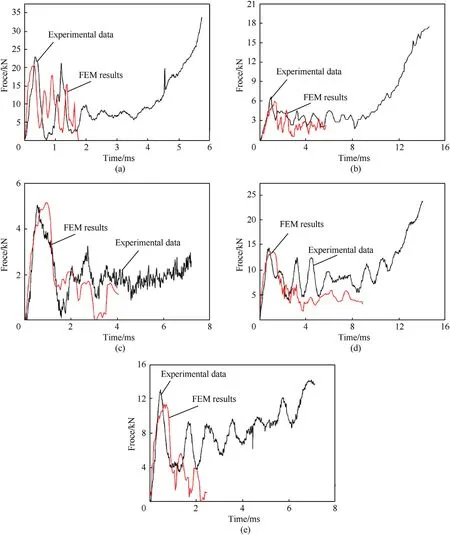
Fig.16. Force-time curves of experiments and numerical simulations under low speed dynamic loading: (a) GS; (b) SC; (c) SGC; (d) DC; (e) DGC.
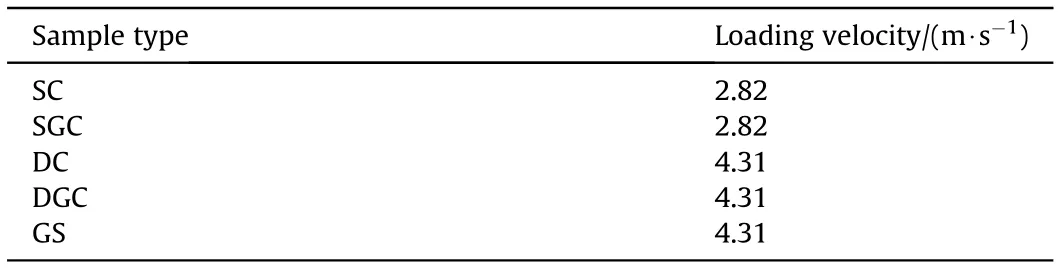
Table 2 The loading velocity of the low speed impact test.
From the static analysis, as represented in Fig. 23, the curve of OAB and CAD represents the equivalent stress-strain relation and the stress-strain relationship in the post-stage [17], respectively.Based on the theoretical analysis proposed in Ref. [17], the curve OAD means the real stress-strain relationship.According to Fig.23,the actual stress-strain curve σ(ε) can be expressed by Eq. (6) and Eq. (14).In previous work, we found through SEM images that the strut surface of the structure was not completely uniform and the average diameter of the strut was 0.44 mm [49]. In the process of structural deformation,the thinnest part of the strut is most likely to deform and fail. Therefore, within a reasonable error range, the diameter of the strut was selected as 0.352 mm in the theoretical calculation. The nominal stress and nominal strain are defined to reflect the mechanical response of the structure [54,55]. The nominal stress in the experimental curve was obtained by dividing the compressive force by the sample cross-sectional area and the nominal strain was defined as the ratio of the deformation length to the initial length of the structure. Fig. 24 shows the theoretical analysis and experimental nominal stress-nominal strain curves of the single-layer cylindrical tube(SC).It can be seen from Fig.24 that the theoretical results of the elastic section are found to be identical to the experimental results. In the post-yield stage, the beam will break obviously during the deformation process. Therefore, the experimental curve fluctuates more than the theoretical curve,but the platform part of the experimental curve basically coincides with the theoretical curve and the process of structural stress variation can be better described by theoretical models.
4.2. Analysis of numerical simulation results
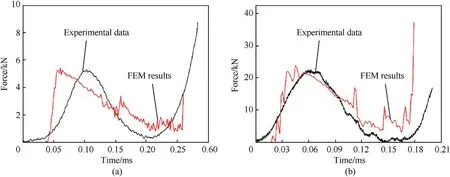
Fig.17. Force-time curves of experiments and numerical simulations under high speed impact: (a) SC; (b) DC.
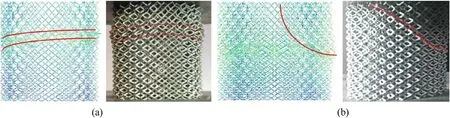
Fig.18. Structural deformation mechanism under quasi-static loading; (a) SGC; (b) DGC.
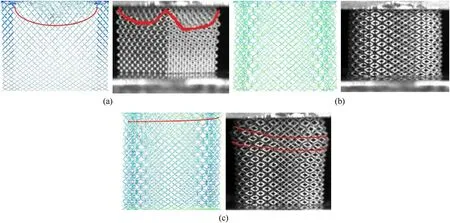
Fig.19. Structural deformation mechanism under low speed impact: (a) GS; (b) SC; (b) SGC.

Fig. 20. Structural deformation mechanism under high speed impact: (a) SC; (b) DC.

Fig. 21. Deformation mode of uniform structure under different impact velocities.

Fig. 22. Deformation mode of gradient structure under different impact velocities: (a) GS; (b) SGC; (c) DGC.

Fig. 23. Equivalent stress-strain curve [17].

Fig. 24. Theoretical and experimental results of SC under quasi-static loading.

Fig. 25. Numerical simulation and experimental results of the structure under different loads: (a) Quasi-static; (b) Low velocity impact; (c) High velocity impact.

Table 3 The critical velocity when the structure collapses layer by layer.
Under quasi-static and low-speed loads, the force-time curve can be divided into three parts. Firstly, the force increases linearly with time.When the force reaches the initial peak,the curve drops sharply,and then a plateau appears in the curve.Finally,the curve continues to rise due to the gradual compaction of the structure.However,there is no obvious platform part in the force-time curve under high velocity impact.In the numerical simulation,in order to simplify the calculation and improve the calculation efficiency,the supports in the structure are simplified as beam elements.Since the actual structural model has original defects in the 3D printing process and the diameter of the small support is not uniform, the deformation of the structure is more complicated and random when subjected to force. However, the finite element model is an idealized uniform model, so the force-time curve obtained by the numerical simulation cannot completely coincide with the experimental curve in the large deformation stage.
Fig. 25 shows the experimental and numerical simulation results of the initial peak force of the structure under different impact loads and the peak force of the double-layer cylindrical tube is significantly higher than that of the single-layer cylindrical tube.Under quasi-static and low-speed impact loads,the peak force of a single-layer graded cylindrical tube is higher than that of a singlelayer non-gradient cylindrical tube, and the same results are obtained for a double-layer cylindrical tube.The relative error formula is used to analyze the initial peak force which is obtained from experiments and numerical simulations. The formula can be written as:

where m is the initial peak force of experimental data,n is the initial peak force of numerical simulation results. It is calculated by formula(15)that the relative errors between numerical simulation results and the experimental results are below 15%.
4.3. Critical velocity
Figs. 21 and 22 exhibit the results obtained from numerical simulation.As the impact velocity increases,the deformation mode of the structure changes. When the impact velocity reaches a certain value,the structural deformation mode basically no longer changes. Table 3 shows the critical impact velocity when these thin-walled tubes collapse layer by layer.For SC,it can be seen from the results of experiment and numerical simulation(Fig.18(b))that the structure has collapsed layer by layer during low-velocity impact,so the critical velocity of SC is lower than other structures.
5. Conclusions
The stress-strain relationship of the lattice-walled structure under compressive loading is derived through theoretical analysis.The LS-DYNA finite element software is used to calculate the mechanical response and deformation of the structure under different strain rates and the results are compared with the experimental data.By analyzing the deformation of the structure under different impact velocity,the critical velocity is obtained when the structure collapse layer by layer. Some conclusions are summed up as follows:
(1) According to the theory of plastic hinge, the theoretical model regarding the stress response of the lattice-walled structure under quasi-static axial compression is established. Compared with the experimental results, the theoretical model can accurately describe the mechanical response of the structure and the relative error between the theoretical and the experimental results of the initial peak value is only 5.2%.
(2) In the numerical simulation, relatively accurate results can be obtained when the beam element is used to establish the finite element model, and the numerical simulation results are in good agreement with the experimental results. The relative error between numerical simulation and experimental results is basically within 10%.The shear deformation mode is absent in the structure of SGC during the loading processes at different speeds, while the structure of SC has already collapsed layer by layer under low-speed impact.
(3) The critical velocity of GS is significantly higher than that of the cylindrical tube. The structure of SC has the lowest critical velocity(2.82 m/s) because it collapses layer by layer under the low-speed impact. The structure of DC and DGC have the same critical velocity.
The authors declare that they have no known competing financial interests or personal relationships that could have appeared to influence the work reported in this paper.
The authors acknowledge the financial support of the National Natural Science Foundation of China (11972092, 12002049,11802028) and the Project of State Key Laboratory of Explosion Science and Technology (YBKT18-07, KFJJ19-12M).
杂志排行

Defence Technology的其它文章
- A new model for the expansion tube considering the stress coupling:Theory, experiments and simulations
- Experimental and analytical assessment of the hypervelocity impact damage of GLAss fiber REinforced aluminum
- Effect of the microporous structure of ammonium perchlorate on thermal behaviour and combustion characteristics
- Modeling of bistatic scattering from an underwater non-penetrable target using a Kirchhoff approximation method
- 3,6-bis (2,2,2-trinitroethylnitramino)-1,2,4,5-tetrazine. Structure and energy abilities as a component of solid composite propellants
- Rapid preparation of size-tunable nano-TATB by microfluidics