Highly transparent and super-wettable nanocoatings hybridized with isocyanate-silane modified surfactant for multifunctional applications
2022-07-26ManKwanLawYingZhaoWeibinZhangRuiWangMingchengShiYunxiaoZhangShushengChenJingleiYang
Man Kwan Law,Ying Zhao,Weibin Zhang,Rui Wang,Mingcheng Shi,Yunxiao Zhang,Shusheng Chen,Jinglei Yang
Department of Mechanical and Aerospace Engineering,The Hong Kong University of Science and Technology,Clear Water Bay,Hong Kong SAR,China
Keywords:Nanocoating Sol-gel approach Multifunctionality High transparency Superwetting Durability
ABSTRACT Highly transparent and super-wettable nanocoatings for multifunctional applications with outstanding physical properties are in high demanded.However,such nanocoatings resistant to water invasion and Ultraviolet (UV)weathering remain a significant challenge.In this work,physically durable coatings based on inorganic nanoparticles(NPs)and an organic segment(isocyanate-silane modified surfactant)have been synthesized via a sol-gel approach.It is noteworthy the isocyanate-silane with–NH–C––O-functional group creates a strong bonding between the highly hydrophilic surfactant and the inorganic NPs.This in-house synthesized organic segment can render the coating long-lasting wetting properties and resist to be washed away by water,while the inorganic NPs can form sturdy covalent bonds with the nano-scale hierarchical structure on the glazing substrate to improve the durability.This nanocoating demonstrates high transparency with superwetting property (water contact angle,WCA=4.4±0.3°),effective de-frosting performance.Water invasion or UV accelerated weathering tests do not significantly affect the self-cleaning performance of nanocoating.Physical properties,including coating adhesion,hardness,Young's modulus,and abrasion resistance are systematically investigated.Interestingly,this clear coating shows prominent infrared shielding property attributed to Antimony-doped tin oxide (Sb-doped SnO2)NPs.The developed nanocoating process is easy to scale up for larger areas that require multipurpose self-cleaning functions.
1.Introduction
Maintaining the building envelopes' clean appearance is of critical importance for modern architecture design.Traditional manual wiping is straightforward[1],[[,2]but it wastes water,labor,and energy for their restoration.Superhydrophobic materials with anti-stain performance and frequent utilization attracted enormous interest in selective self-cleaning applications in the past decade.In contrast to normal smooth surfaces such as glass,rolling water drops compile dust particles from superhydrophobic surfaces WCA(>150°)to display a self-cleaning efficiency.Currently,numerous studies attributed the superhydrophobic performance to a combination of surface roughness on nano/micro-scales and surface chemistry.For example,Kumar et al.[3]reported a facile and durable superhydrophobic coating with anti-SARS-CoV-2 (COVID-19)virus function for stain resistance application,which was fabricated based on aloe vera and hexadecyltrimethoxysilane(HDTMS)and showed good reusability after multiple times water washing;Pandit et al.[4]reported that through the process of simple immersion modification by using titanium dioxide (TiO2) nanoparticles and perfluorooctyltriethoxysilane(PFOTS),the hydrophilic wood changed its wetting property into superhydrophobicity,which had outstanding mechanical stability under harsh condition for self-cleaning.However,by changing the nano-topography with a low surface energy of the material surface to make the coating superhydrophobic,the oleophobicity is not good.Many dust and pollutants in the urban surroundings contain oily substances from industries or transportation,which easily adhere to the building surface.At the same time,since the surface of the coating is hydrophobic,it is difficult for water to meet a large area of oily substance and take it away when it rains or is washed.Therefore,the hydrophobic film layer generally has a limitation for self-cleaning ability.Hydrophilic materials with oleophobicity have drawn a lot of attention and have been studied extensively as self-cleaning properties for both wall and fenestration systems[5–10].The primary mechanism of self-cleaning is to generate a wetting surface on which water droplets can naturally spread and form an almost continuous water film on the glazing and cement-based materials'surface(<90°of WCA)so that the water film easily washed away the specks of dirt including oil contaminants from the surface [11].Although a huge amount of strategies have been developed,for instance,inorganic materials such as TiO2[12,13]and Zinc oxide(ZnO)[14,15]as were used at self-cleaning applications,the hydrophilic properties only appeared under UV light.Besides,the other fabrication techniques of super wetting(<5°of WCA)surface were created by roughening surface morphology without any nanoparticles(NPs)via ion[16],electrons[17],beams,and plasma [18],electrochemical polymerizations [19,20],and photocatalytic lithography [21] treatment.However,they often had complicated preparation processes,high costs and challenges to these approaches severely limit their practice.
Besides self-cleaning properties,researchers also found that hydrophilic coating possessed other favorable properties on transparent surfaces,especially anti-fogging [10,22–25].The reason was that the moisture vapor absorbed by hydrophilic functional groups on the surface was generated,and the light then could directly pass through tiny water microdroplets without interference[5,26].Generally,the deposition of a thin film of polymers or monomers containing hydrophilic functional groups,e.g.,carboxyl groups (COOH,COOR),hydroxyl (OH),and sulfonyl (RSO3H) on the substrate is a common way to obtain a wetting surface.For instance,poly (ethylene glycol),poly (vinyl alcohol),and polyurethane resin with pending hydroxyl or carboxyl groups have been used to synthesize hydrophilic coatings.However,due to high hydrophilicity,these anti-fogging coatings are soluble in water,causing short service life and poor stability.To tackles these problems,reticulation agents are usually used to provide coatings with intricately cross-linked networks induced by UV irradiation or heating.These cross-linked agents can be either organic compounds (polyisocyanate,acrylamide,and epoxy resins),inorganic compounds (aluminum derivatives),or a mixture of both.Although those coatings are cohesive,their adhesion to the substrate is the physical interaction only,which leads to poor durability in bad environmental conditions.
Our strategy incorporates the in-house synthesized organic segment(isocyanate-silane modified surfactant) with ultrahigh surface energy into the inorganic hierarchical molecular structure to prepare a transparent multifunctional nanocoating with long-term stability.Emphatically,the good adhesion between the highly hydrophilic surfactant segment and the inorganic NPs by the–NH–C––O-bonding group from isocyanate-silane as is generated,this novel organic segment can render the coating excellent hydrophilic performances since they can lead water droplets to spread over on the surface and resist to be washed away by water.On the other hand,as reported by Qu′er′e and Wenzel,the higher the surface roughness of a hydrophilic material,the higher wettability it is[27,28].With this in mind,it is necessary to increase the roughness of a surface for enhancing its hydrophilicity.Although there are many promising methods for achieving this goal,such as femtosecond laser irradiation,layer-by-layer (LBL) assembly [29],and electrochemical anodization[30],they are too time-consuming and costly to realize large production.The sol-gel approach's accumulation of inorganic NPs is deemed an ideal technique to construct the hierarchical surface on a substrate [31].In this work,it is composed of two or more different particle sizes that are interlaced at robust covalent bonds with the nano-scale hierarchical structure on glazing substrate to enhance durability.Notably,this synthesis approach of organic-inorganic hybrid nanocoating is highly feasible to control the full gelation and low cost[32,33].More interestingly,this novel nanocoating containing Antimony-doped tin oxide (Sb-doped SnO2) NPs appears the ability to thermal insulation property,achieving an effective IR shielding performance with above 900 nm thickness on the glazing surface.These findings are considered as a good strategy for the fabrication of state-of-the-art super wetting nanocoating with excellent resistance to water invasion and UV weathering,which enables a further step for the development of an energy-saving building.
2.Experimental details
2.1.Materials
Hydrochloric acid (HCl,37%,w/v) was purchased from Wako Pure Chemical Industries,Ltd.(Japan).Anhydrous 2-propanol was obtained from VWR Chemicals Limited. Tin chloride dihydrate(SnCl2·2H2O,>98%),tetraethyl orthosilicate (TEOS),3-isocyanatopropyltrimethoxysilane (ICPTMS),and antimony(III) chloride (SbCl3,>99%) were purchased from Sigma-Aldrich.Dibutyltin dilaurate(DBTDL) and Sorbian monolaurate (Tween 20,Mw=1227.5) were achieved from Alfa Co.,Ltd.Sodium hydroxide (NaOH,>98%) and hydrogen peroxide (H2O2,33 wt%) were purchased from Adamas.Hybrid-fiber reinforced cement plates(90 mm×90 mm×10 mm,0.75%polypropylene fibers and 0.25% steel fibers),glass/mirror sheets(75 mm×50 mm×3 mm or 150 mm×200 mm×3 mm)were fabricated as application substrates,artificial ash (<100 μm in size,GSB 08-2992-2013) was supply from the Shanghai Research Institute of Building Sciences Co.,Ltd and used as dirt.All chemicals were used without further purification unless otherwise specified.
2.2.Preparation of hybrid nanocoating
2.2.1.Pre-treatment of glazing substrate
As shown in Scheme 1,the glazing substrates were sonicated in ethanol for 20 min each before they suffered from etching by surface treatment solution (NaOH:H2O2=1:25,w/v) at room temperature for 30 min to hydroxylate glass/mirror surface.After that,the hydroxylated glass/mirror sheets were cleaned using deionized water and ethanol successively,and then they were dried under a nitrogen atmosphere for further use.
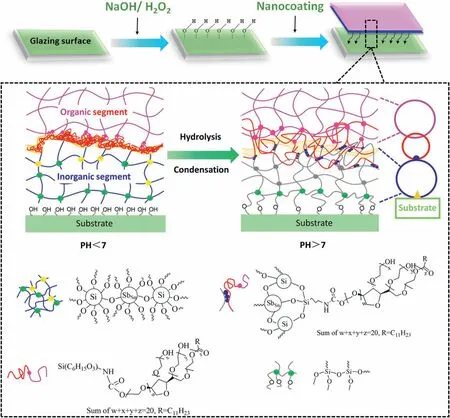
Scheme 1.Schematic illustration for fabricating super wetting isocyanate silane-modified surfactant/Sb-doped SnO2–SiO2 hybrid nanocoating process.
2.2.2.Synthesis of super wetting isocyanate silane-modified surfactant(Tween 20)
The organic hydrophilic agent was synthesized firstly.The surfactant,Tween 20,was modified by a reaction with the ICPTMS.The 8 g ICPTMS and 47.8 g Tween 20 were stirred in a temperature-controlled glass reactor.DBTDL(0.1%of the total weight of ICPTMS and Tween 20)was added as the catalyst once the temperature arrived 70°C,and the reaction was allowed to proceed for 7 h under N2atmosphere.To monitor the reaction progress periodically,aliquots of the solution were regularly withdrawn and characterized by Fourier Transform Infrared(FT-IR).The prepared hydrophilic agent (isocyanate silane-modified Tween 20) was abbreviated as M-T20,hereinafter.
2.2.3.Synthesis of inorganic Sb-doped SnO2–SiO2 sol
To obtain a wide-ranging size distribution in the colloid while keeping stable,the hydrochloric acid concentration and synthesis temperature were systematically varied in the different experimentations(Table 1).Firstly,the TEOS and SnCl2·2H2O (molar ratio=1:1) were mixed with methanol to form a homogeneous colloidal dispersion.Then,the catalyst HCl(aq.)(pH <1,20°C)and H2O were slowly dropped into the above solution to initiate the hydrolysis-condensation reactions of TEOS and Sn2+.The molar ratio of H2O to TEOS was set to be 0.4,while HCl's molar ratio to TEOS was 0.34,0.25,0.17 and 0.09,respectively.After that,the SnO2–SiO2network was doped by adding a fixed amount of SbCl3.The mixture was stirred for 48 h under different temperatures to yield inorganic sols with various size distributions.The four kinds of inorganic sols prepared under the same temperature were uniformly dispersed in one glass bottle by the sonication technique.The 750 W ultrasonic homogenizer attached with a tapered 5 mm tip sonication horn(Cole-Parmer)was used to disperse the solution for 20 min at 35%intensity(3.0 KJ of input energy).Finally,the uniform sol underwent an aging process at room temperature for one week to obtain the Sb-doped SnO2–SiO2sol.
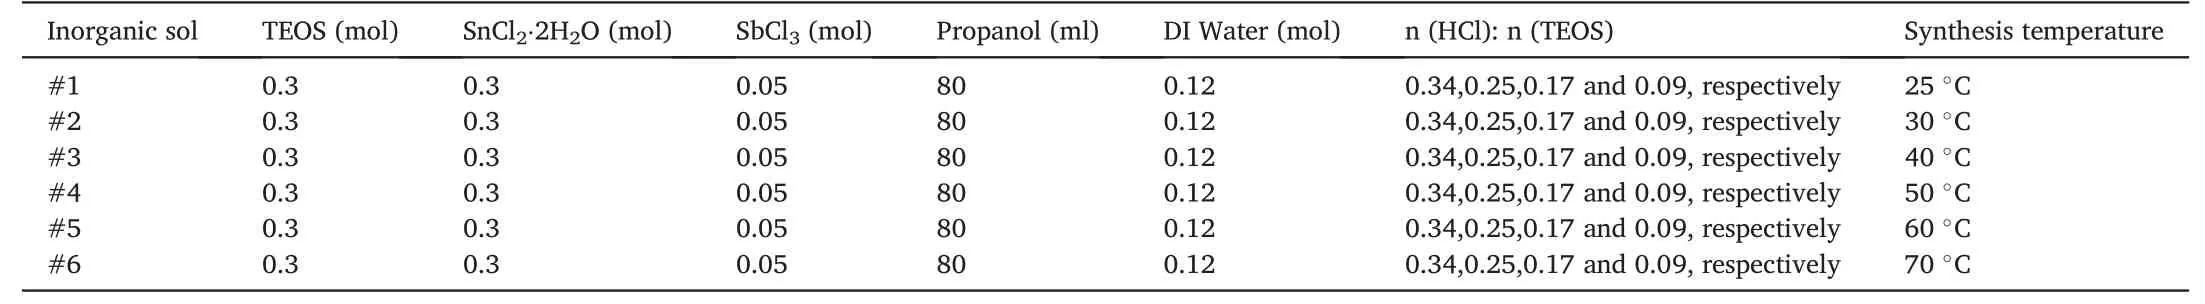
Table 1 Formulations for synthesizing inorganic Sb-doped SnO2–SiO2 sol.
2.2.4.Synthesis of hydrophilic organic-inorganic hybrid nanocoating
The M-T20/inorganic sol was prepared by mixing 30 g Sb-doped SnO2–SiO2sol with different content of M-T20,as shown in Table 2.These solutions were separated into glass bottles and closed tightly with Teflon tape under continuous magnetic stirring at 400 rpm at room temperature for 3 h before applying to the substrates.
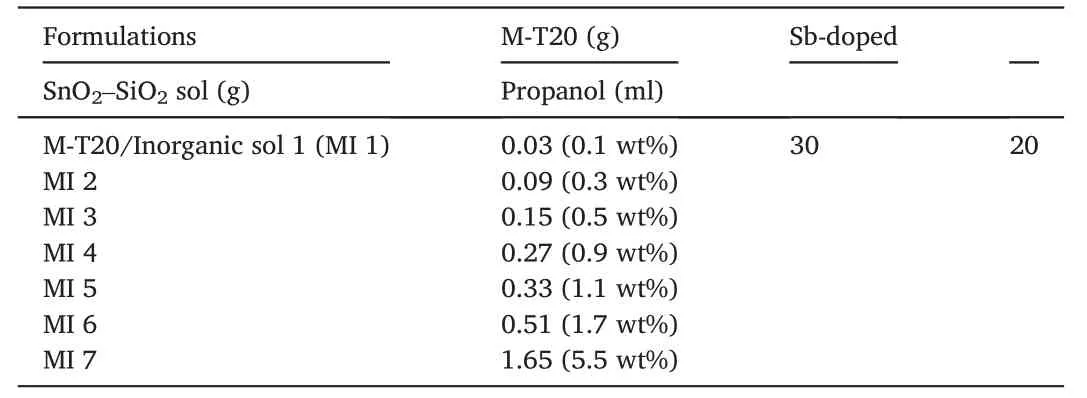
Table 2 Formulations for fabricating organic-inorganic hybrid nanocoating.
2.2.5.Application of organic-inorganic hybrid nanocoating on substrates
The well-dispersed hybrid nanocoating was used to depose a thin film on the glass/mirror sheet and cement substrate via dip-coating at a 720 mm/min withdrawal rate.The transparent thin film was formed on the substrate surface after the entire evaporation of the solvent a roomtemperature for two days.
2.3.Characterization of synthesized nanocoating containing Sb-doped SnO2–SiO2
The1H NMR spectrum of M-T20 using CDCl3as the solvent was recorded on a Bruker DRX-600 instrument,and the1H chemical shift was internally referenced to δ=7.260 ppm.The nano morphology of inorganic NPs was observed by transmission electron microscopy (TEM)(JCM-6000PLUS NeoScope,JEOL,USA).The micro morphologies of nanocoating surfaces and cross-section were characterized by field emission scanning electron microscopy (SEM)(JEOL-6700F).
The sizes of inorganic NPs were investigated by dynamic light scattering (DLS) using an LS13 320 MW from Beckman Coulter.The inorganic NPs sample was dispersed in water (0.56 mg/mL) before being sonicated for 30 min.Then,3 mL of the inorganic dispersion was dropped into a quartz cuvette (optical path of 1 cm),and scattered light measurements were operated at 25°C.FTIR spectra of hybrid nanocoating synthesis progress were measured on an attenuated total reflection accessory (ATR) coupled to the Nicolet iS50 FT-IR spectrometer.The chemical bonds and components on the surface coated with nanocoating specimens were analyzed by X-ray photoelectron spectroscopy (XPS).The topographies of the pure glass,coated glass surfaces in the dry state were imaged by Atomic Force Microscope(AFM)using a Dimension Icon(Bruker,USA)under scanasyst mode with the scan rate of 2 Hz and the scan size of 5 μm×5 μm and optical profilometry(Brucker NPFLEX)with the scan size of 640 μm×480 μm at different locations.The coating film thickness was measured using a film thickness analyzer(Alpha-Step®D-300,KLA).The WCA was measured by the sessile drop method using an optical CA goniometer(Biolin Theta Contact Angle Meter)at 25°C.Three water droplets of 5 μL were dropped onto samples equidistantly by a microsyringe,and the WCA measurements were performed at the corresponding positions to assess the average wettability of the coatings.A cross-cut adhesion test was carried out using a standard method (ISO 2409)to acquire a qualitative impression of the deposited nanocoating's adhesion on the etching glass surface after UV aging.To facilitate the possible breakdown of the coating,the coated glass substrates were scratched into form small squares (1×1 mm2) to characterize the exfoliation behaviors.The surface of the nanocoating was affixed with adhesive tape,which was hauled virtually continually.The margins of the squares disintegrated,causing a portion of the squared surface to crumble.The amount of flaking indicates the quality of the nanocoating.A microscope (Leica DM2700 M) with objectives of 4×,10×,and 40×was used.According to ISO 2409,adhesion quality is classified on a scale of 0(excellent)to 5(poor)(very poor).A nanoindenter was used to test the hardness and Young's modulus of the coatings over a depth range of 40 nm.Wear abrasion test was performed using a linear abrader(ZHIJIA®-Model ZJ-339-GSR)with a CS-17 calibrase abrasion cylinder tip with a 6 cm stroke length and a 30 cycle/min stroke speed under constant pressure of 16 kPa according to ASTM D6279.By conducting a back-and-forth linear periodic motion,the abradant reached a distance of 7 cm every cycle under 200 g loading.After every 20 linear abrasion cycles,WCA measurements were taken.
2.4.Durable wetting properties test
The durability of hydrophilic hybrid nanocoating was evaluated by the ultraviolet(UV)aging test[34].The UV aging resistance performance was investigated by QUV®Accelerated weathering testers(Q-Lab,USA)with lamp(UVA 340)in the critical wavelength range from 365 nm down to the solar cut-off of 295 nm.Regarding ASTM G154 Cycle 7(12 h=1 cycle),the UV photodegradation experiments were carried out under 8 h irradiance (1.55 W/m2,60 (±3)°C of black panel temperature),0.25 h water spray,and 3.75 h condensation at 50(±3)°C(humidity:~85%)of black panel temperature.Tests for hydrophilicity were conducted every 2 cycles,while contact angle measurements were taken once a week.
2.5.Self-cleaning performance test
The mixture of artificial ash and water(1:0.9,w/w)was used as the model contaminant on the coated cement plates with hybrid nanocoating.Firstly,the coated cement plates were dipped into the mixture suspension for 5 s and placed for 2 h under a temperature of 23°C and humidity of 50%.Secondly,the plates were rinsed uniformly for 1 min under specified flushing apparatus and dried the flushed the specimen for 24 h under 23°C and relative humidity of 50%.Finally,the abovedescribed dipping,rinsing,and drying processes should be repeated for 5 cycles (Fig.1).In addition,contact angle measurements were conducted prior to contamination in every cycle for investigating the wettability.The change of reflection coefficient was continuously monitored to evaluate the stain-resistant stability by the reflectance meter according to GB/T 9780-2013 standard and it could be calculated simplify by the equation as follows:

where Reflectance reduction rate % is the decrease rate of reflection coefficient about the testing specimen.A is the testing specimen's initial average reflection coefficient;B is the average reflection coefficient of the specimens after the anti-stains test.
2.6.De-frosting and anti-fogging test
Initially,frost was grown in ambient humidity conditions,horizontally placing samples of 75 mm×50 mm×3 mm onto a precooled stage(-40±2°C)in a chamber(relative humidity,RH=85±6%)for 10 min,a cold nitrogen recirculation stream maintained dry conditions.After the above condensation frosting progress was completed,we transferred the frosted samples out of the chamber.These samples were naturally warmed to room temperature of 22±1°C or by 250 W infrared lamp(Wavelength range 760–3000 nm) radiation (distance:15 cm).A digital camera was positioned to capture the de-frosting performances,which were then recorded at 30 frames per second (fps) until the frost had entirely melted into water droplets and all dynamic activities had been eliminated.A digital microscope was used to record the frost's microdynamic melting performance (Leica DM2700 M) with objectives of 100×,and the recording framerate was 1 fps.The transient thermal response of the pure and coated glass was detected through a thermal camera(FLIR E8-XT,7.5–13 μm),which had an f=6.5 mm lens,within 320×240 pixels and calculated average surface temperature by FLIR software.Totally five cycles of frosting and de-frosting process for each sample were carried out to verify the de-frosting performances.The antifogging property of the glass sheet was determined by the steam test,in which the samples were held 4 cm above a bath filled with 100°C water for 300 s (the ambient condition was temperature 22±1°C,RH=55±2%).
2.7.Thermal insulation performance test
The obtained hybrid nanocoating was coated on a glass surface(200 mm×120 mm×2 mm)for the thermal resistive test(according to JG/T 338-2011standard) with different thicknesses.The thermal insulation performances of the hybrid nanocoating were investigated by the in-house-made test apparatus (Fig.2a and b).It consisted of a 250 W infrared lamp(Wavelength range of 760–3000 nm),a thermal insulating chamber with two windows covered by changeable glasses,and temperature data loggers.The Vis-NIR transmittance spectra of the films were carried out by Hitachi UH4150.Using an integrating sphere detecting mechanism,the wavelength of the Vis-NIR Spectrophotometer was in the range of 400–3000 nm.

Fig.1.(a)Water flushing test apparatus(GB/T 9780–2013);(b)Schematic illustration of the anti-stains test and characterization process for both coated cement and glass with hybrid nanocoating.
3.Results and discussion
3.1.Preparation and characterization of organic-inorganic hybrid nanocoating
This highly transparent hybrid nanocoating mainly comprised nanoparticulate Sb-doped SnO2,SiO2,and isocyanate silane-modified surfactant(M-T20)(Scheme 1).A strong adhesion property will be presented 1)between the organic segment (M-T20) with the inorganic sol matrix;Furthermore,2) the inorganic matrix can be increasing the bonding of the whole hybrid nanocoating on the etched glass surface tightly by the Si–O–Si cross-linked layer.After the curing time increased,the organicinorganic hybrid nanocoating with durable functions was developed successfully.The mechanism of these two main approaches will be demonstrated in Scheme 2.
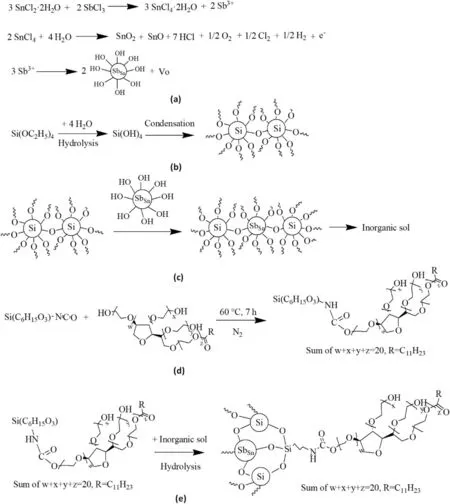
Scheme 2.(a) Preparation of Sb-doped SnO2 sol in the process;(b) Simplified representation of the hydrolysis of TEOS;(c) Simplified representation of the condensation of TEOS and Sb-doped SnO2;(d) Schematic illustration of the isocyanate of 3-isocyanatopropyltrimethoxysilane (ICPTMS) was reactive toward the terminating alcohol of the surfactant (Tween 20);(e) Schematic illustration of the isocyanate silane-modified surfactant was formed on inorganic sol.
The time-dependent FT-IR spectra of M-T20 synthesis were demonstrated in Fig.3a.During this reaction,in the FTIR spectra,an appeared band of–NH peak originating from the urethane bond was discovered at 1539 cm-1,whose strength grew gradually up to 7 h before leveling out.In contrast,the–NCO signal at 2269 cm-1decreased with time and virtually vanished after 7 h of reaction,indicating that ICPTMS and T20 were initially reacted at an equal molar amount,and the reaction was thought to approach completion in about 7 h.The1H NMR spectrum of ICPTMS modified Tween 20 was shown in Fig.3b.The chemical shifts at δ=3.5(a),3.2(b),1.6(c),0.8(d),3.8(e),and 1.4(f)of the ICPTMS moiety can be identified,which correspond to the resonance of hydrogen in CH2NCO,(=N)CH2(CH2-),(–CH2)CH2(CH2–),(CH2-)CH2(Si-),(-Si)(O)CH2-,and (–O)(CH2–)CH3groups [35].On the other hand,There were five characteristic peaks (δ 4.1,3.7,2.4,1.3 and 0.9) of the Tween 20 moiety can be identified,which correspond to the resonance of O––COCH2,(CH2CH2O)n,CH2CH2C––O,(CH2)nand CH3,respectively.The synthesized M-T20 presented the change of absorption peak δ 3.5 in pure ICPTMS(CH2NC––O) and occurred a new chemical shift at δ 4.27,which signified from the–NH on the urethane bond of Tween 20 [36].Therefore,it could be assured the urethane linkage was generated by the reaction between ICPTMS and Tween 20.Obviously,1H NMR results were in accordance with FT-IR-ATR analysis.
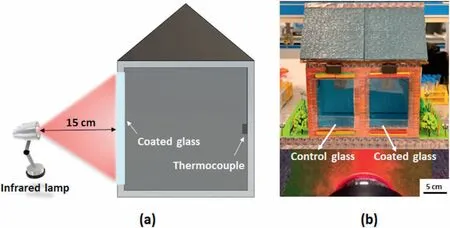
Fig.2.(a) In-house-made simulating thermal insulation test apparatus;(b) The real-designed model for thermal insulation test,the radiation distance is 15 cm.
For the synthesis process of inorganic Sb-doped SnO2–SiO2sol,it is shown that the particle diameter decreased with the increasing reaction temperature from 25°C to 70°C under a constant concentration of HCl catalyst(Fig.S1).Similar results were also observed by other researchers[37,38],which indicated the nucleation rate was higher than the growth rate at an elevated temperature,thus producing smaller particles.The related CAs (e.g.,Water,Ethylene glycol (EG),and Soybean oil (SO))were displayed in Table S1.The average CAs of specimens made of these sols were below 20°,showing a hydrophilic tendency from pure inorganic particles [39].It could be achieved the lowest value 12.5±2.5°(Water),9.7±2.3°(EG)and 4.4±1.7°(SO)by inorganic sol#5 under 60°C.To study the formation mechanism of the wetting nanocoating on substrates,the surface fabricated with inorganic sol #5 was selected for further study.Secondly,it was evident that lower concentrations of catalysis in the same temperature will decrease the particle diameter.Fig.3c illustrated the particle size of inorganic sol#5 increased with catalysis concentration,ranging from 0.09 to 0.34 mol while the synthesis temperature was fixed (60°C).The particle size distribution was relatively narrow with percent standard deviations in the 2.5%–9.3% range (Table 3).Generally,the catalyst could accelerate the hydrolysis and condensation reactions of TEOS and Sn2+,producing more oligomers to form large particles further.However,when the catalyst concentration increased,the condensation rate of precursors was more significant than the hydrolysis rate[40],and the intermediate increased quickly because of the high rate of a hydrolysis reaction.When the hydrolysis reaction reached the supersaturation state,the consumption rate of the intermediate in the condensation reaction was also rapid [41],which possibly shortened the period time of the nucleation process.Therefore,the total amount of produced nuclei was reduced,and the particle size of the prepared inorganic colloid was relatively bigger[42].Therefore,the particle size decreased with less catalysis concentration(0.09 mol) and reached the minimum value at around 10 ± 6 nm with 79.6% intensity of size distribution.The SEM morphologies for the surface of inorganic sol#5 containing Sb-doped SnO2–SiO2NPs had been shown in Fig.3d and e,and it demonstrated Sb-doped SnO2–SiO2NPs showed the state of NPs agglomeration with~20–30 nm and~100 nm particle size,respectively.Four kinds of particles under the microscope view could be observed,it demonstrated that the influence of catalysis concentration on the particle size,confirming that particle size decreased as catalysis concentration reduced,which was in accordance with the results of DLS measurement.The chemical composition analysis was quantified by X-ray energy dispersive spectrometry(EDX)in Fig.3f.The EDX results demonstrated the effectiveness of the inorganic sol #5,which revealed a decrease in the silicon feature while increasing the carbon surface content compared to the pure substrate (Fig.S2).In addition,1.1%tin and 0.4% Sb were detected following the test.
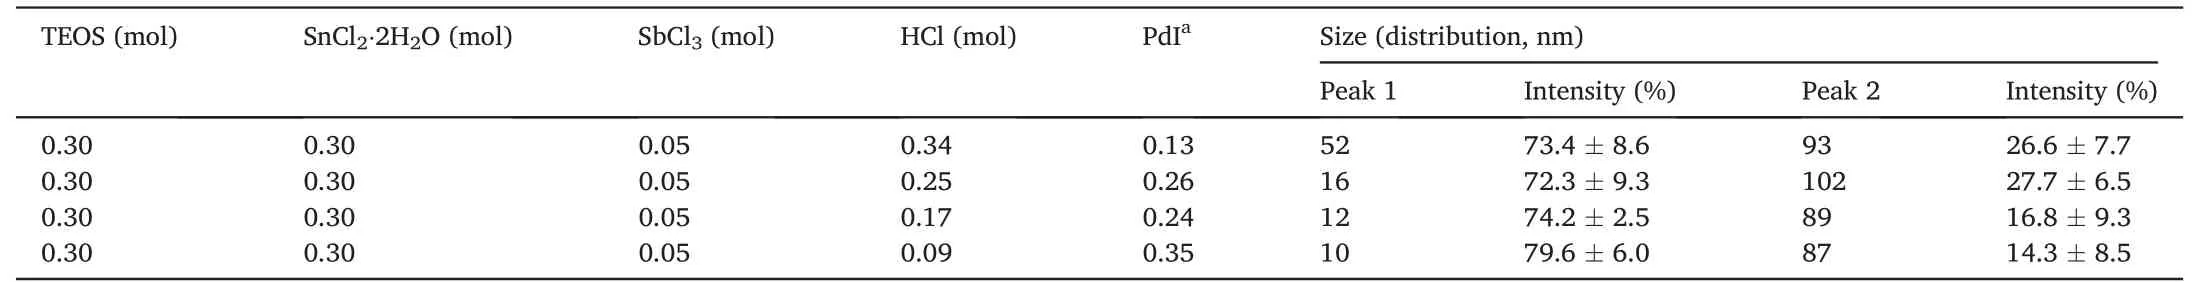
Table 3 Parameters about the particle size distribution of inorganic NPs(Specimen:inorganic sol #5).
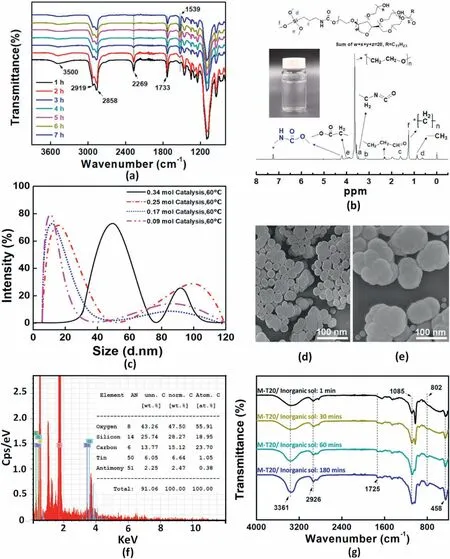
Fig.3.(a) FTIR spectra of the modified Tween 20 at different reaction times during synthesis;(b) NMR spectra of T20 synthesized from 1:1 M ratio of ICPTMS and Tween-20;(c) The particle size distribution of prepared inorganic sol #5 with different catalysis concentrations (e.g.,0.34/0.25/0.17/0.09 mol) under a constant temperature 60 °C,obtained by DLS measurement;SEM images of inorganic sol#5 containing(d)~20–30 nm and(e)~100 nm Sb-doped SnO2–SiO2 NPs;(f)The EDX spectrum and elemental content of inorganic sol#5 containing Sb-doped SnO2 and SiO2 NPs;(g)FTIR spectra at different times during synthesis of organic-inorganic hybrid nanocoating.
The hydroxyl groups present in the appearance of inorganic NPs were named "silanols" because they could be attached to the SiO2surface(Scheme 2c) [43].These silanols imparted functionality to the particlesas hydroxyl groups can complex M-T20,and this reaction was investigated by FT-IR and the spectra were illustrated in Fig.3g,the infrared spectrum of nanocoating revealed extremely strong characteristic absorption peaks at 1085,802,and 458 cm-1when the reaction time reached at 180 min,due to the asymmetry stretching,symmetric stretching,and bending vibrations of Si–O–Si,respectively,confirming the condensation reaction between Si–OH and M-T20 to form cross-linked structure onto the inorganic nanoparticles.Moreover,The intensities of these absorptions also increased during the reaction.The C––O at 1725 cm-1and CH3at 2926 cm-1signified the presence of M-T20 on inorganic nanoparticles successfully.The transmittance in the visible region(λmax(ε)400–800 nm)of the hybrid nanocoating(MI 1–7)on the surface of the glass was detected by UV–vis spectrophotometry.Most of the specimens showed above 85%of visible light transmittance as good as pure glass,such as the MI 4 sample(Fig.S3).
The SEM morphologies for the surface and cross-section of MI 4 nanocoating had been shown in Fig.4b–d.XPS measurements had been used to investigate each reaction step of the nanocoating application process.To disrupt the Si–O–Si bonds in Si–OH,surface treatment with etching solution was applied in the first stage and hydroxy groups were substituted on the surface for the newly acquired hydrophilic capabilities(Scheme 1).The XPS results confirmed the effectiveness of surface treatment,as the etching solution treatment led to a 10.7% decrease in carbon and a 7.9% increase in the oxygen relative surface concentration.Furthermore,the concentration of Si 2p was detected to rise 8.6%(Fig.4e and f).These newly Si–OH bonds were thus used to graft the organicinorganic hybrid nanocoating.The XPS results demonstrated the effectiveness of the nanocoating,which revealed a decline in the Si 2p XPS characteristic along with a rise up in the carbon content on the surface,it was attributed that most of the silicon on the glass substrate had been hydrolyzed with the nanocoating to form Si–O–Si bonds.In addition,1.0%tin,3.6% nitrogen,and 0.3% antimony were detected following the coated process,with a concomitant growth in the C1s XPS characteristic,an unequivocal indication of a successful nanocoating(Fig.4g).Indeed,the binding energy shifts in the HR C1s XPS spectra clearly distinguished the various chemical bonding.(Fig.4h).The nanocoating showed a band at 285.0 eV feature of C–C/C–H with 21.4% highest than pure glass and etched glass.Following this nanocoating,The HR C1s spectra also revealed a significantly different band structure,with the appearance of a peak at 286.3 eV attributed to the organic segment's C–OH band(M-T20).Moreover,the reaction of the isocyanate-silane with the–NH–C––Ofunctional group led to the formation of the O–C––O bond from T20,clearly proved by the appearance of the band at 288.3 eV(Scheme 2e).
3.2.Durable wetting properties of organic-inorganic hybrid nanocoating
All of the formulation nanocoatings of static contact angle measurements with observation days under the room temperature were summarized in Fig.5a.Glass surfaces with 16 days observed times with most formulation coatings exhibited traditional wetting responses.The WCAs value of flat surface inorganic sol was measured from 12.5 ± 2.5°to 22.1±2.3°during 16 days without the M-T20 addition.By contrast,the WCAs of MI 1 was recorded from 11.2±0.2°to 12.1±1.2°in the same manner when M-T20 content was 0.1 wt%,and it illustrated that M-T20 in the inorganic sol bring down the WCAs and enhance stable hydrophilicity.Besides,the lower WCAs results of all the hybrid surfaces depended on the higher M-T20 content.On every first observed day,the WCAs value of MI 2,MI 4,and MI 6 decreased linearly as the content of M-T20 increased from 0.3 wt%to 1.7 wt%.The specimen MI 7 eventually showed the lowest super wetting (WCA=2.9 ± 1.8°) of all the nanocoatings.Most importantly,the WCAs of hybrid nanocoatings(e.g.,MI 4,MI 5,MI 6,and MI 7)were lower than 5°,it was confirmed that a super wetting surface could be achieved due to a combination of high-surfaceenergy surfactant M-T20 according to the Wenzel's equation.
The microstructure of a surface is crucial to its wettability[44].It is well known that increasing the roughness of a hydrophilic surface will make it more hydrophilic according to Wenzel's equation [45].AFM characterization was used to reveal the surface morphology and the distribution of M-T20 within the surface region of various synthesized nanocoatings.The topography profiles of pure glass and etched glass with nanocoating surfaces were illustrated in corresponding three-and two-dimensional diagrams,as shown in Fig.S4.The surface of the pure glass was relatively rough,the root-mean-square (RMS) was 0.22 nm(Figs.S4a and b).After surface treatment,the morphologies of MI 4,nanocoating surface on etched glass were changed,and the macroaggregates silica-SnO2induced many small mountain-like protuberances on the surface,causing a significant increase of RMS to 2.48 nm (Figs.S4c and d).Besides,the relatively low RMS was delivered to the surface of nanocoating on the etched glass due to the presence of the soft superwetting agent,M-T20.Other typical cases were discussed in Fig.S5 for comparison,the M-T20 dosages of these nanocoatings were 0.3 wt%,0.5 wt%,and 5.5 wt%,respectively.From the topographic diagrams,with a great increase of the addition amount of M-T20 from 0.3 wt%to 5.5 wt%,the average surface roughness decreased considerably from 1.74 to 2.77 nm.The above results were following a larger scan area by optical profilometry analysis in Figs.S6 and S7.This extraordinary and rougher topography will facilitate enhanced hydrophilicity of the nanocoating surface,as suggested by the Wenzel equation[46].
The durability of a super wetting coating,which relied on its capability to withstand water invasion,abrasion,and its adhesion was a major concern in practice [10,25].In this regard,as-prepared super wetting nanocoatings(e.g.,MI 4,MI 5,MI 6,and MI 7)were washed out by water flowing for an extended period to investigate their stability against water damaging (velocity of flow:0.6 m/s under 0.4 Mpa,5 min/time).The results were summarized in Fig.5b.Apparently,MI 4 with 0.9 wt% M-T20 retained its outstanding super wetting and WCAs were from 4.4±0.2°to 5.1±0.2°.Furthermore,in order to evaluate water invasion resistance performances in practical applications,the six commercial coating products which had outstanding durable anti-fogging performances were used to benchmark against MI 4 nanocoating,the results also verified the MI 4 nanocoating still kept superior hydrophilic effect even after water invasion for 30 times(Fig.5c).Comparatively,coatings(e.g.,MI 5,MI 6,and MI 7)with M-T20 content higher than 1.1% could not withstand long-term water flowing,and the reason was that the excessive presence of super wetting surfactant implied that these coatings contained free unreacted M-T20 molecules prone to migrating from the coating during the flowing process.The results of the water flowing test and WCA characterization demonstrated that the super wetting MI 4 nanocoating was suitable for further study.
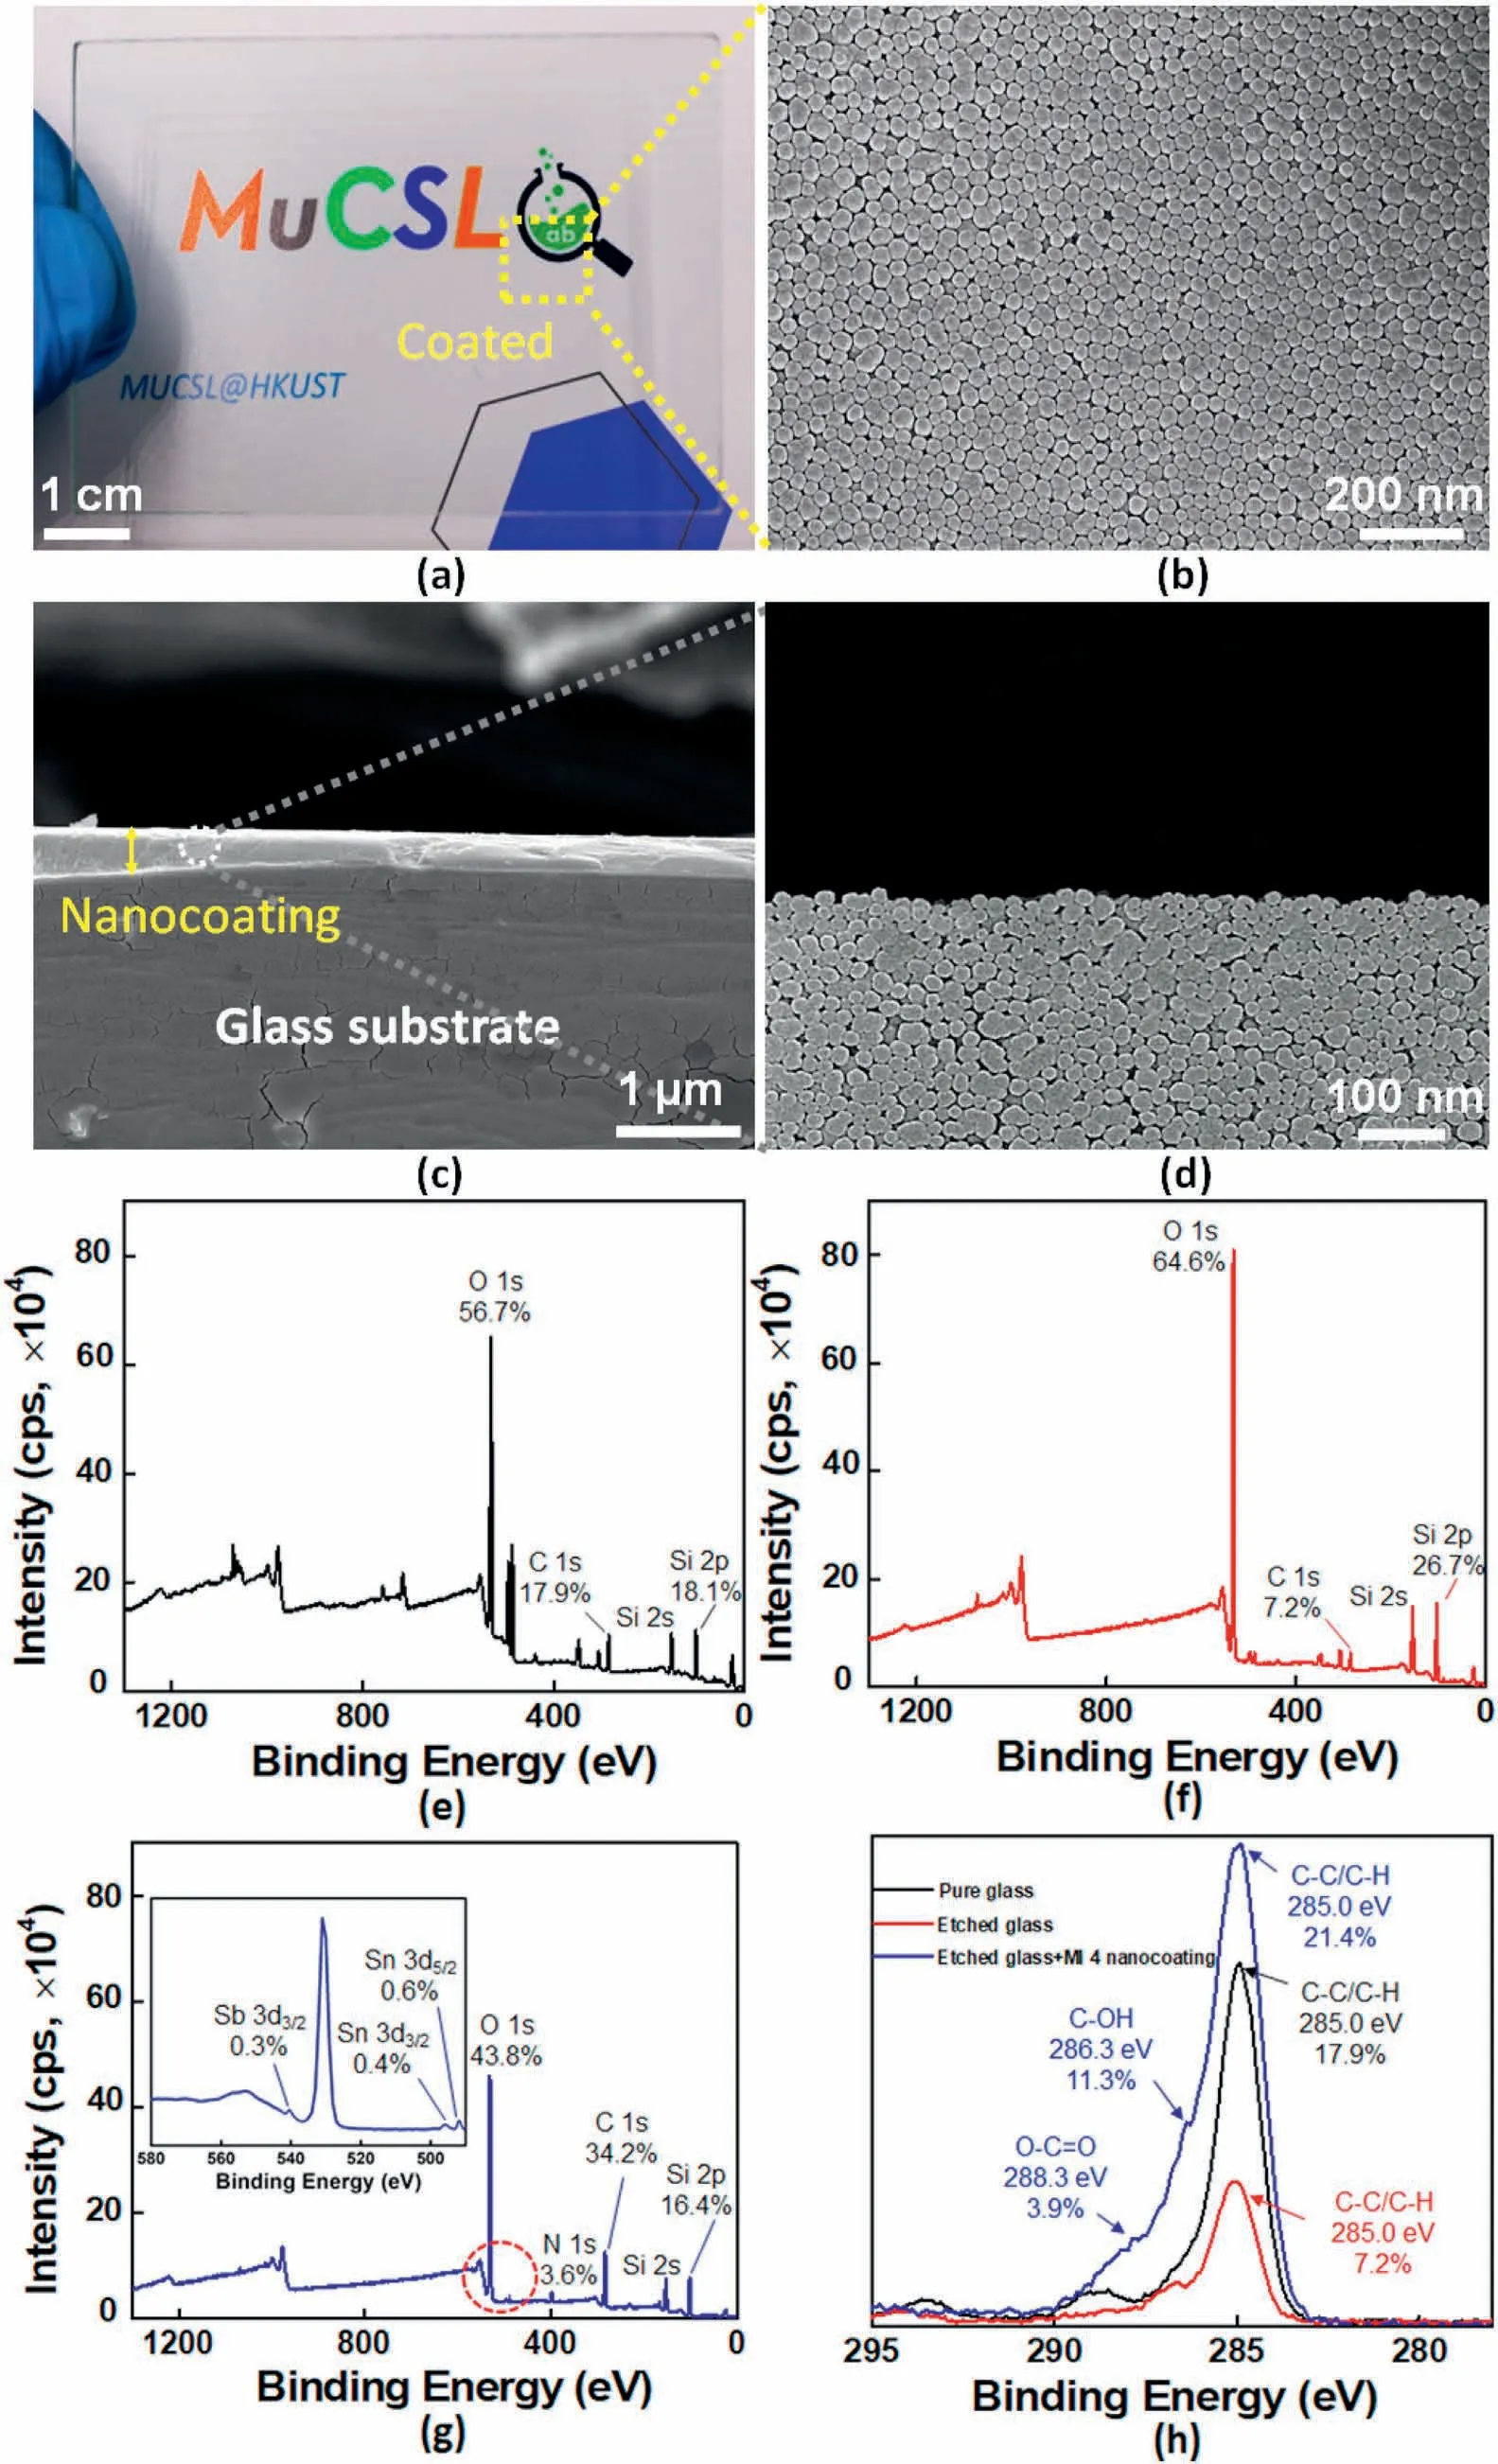
Fig.4.(a) Visual images of pure glass and glass coated with MI 4 nanocoating;The SEM morphologies for the surface of MI 4 nanocoating:(b) overview of nanocoating;(c) cross-section of MI 4 nanocoating containing organic segment and inorganic NPs and(d)enlarged images of nanocoating showing the state of the organic segment and NPs accumulation densely on the glass substrate;XPS spectra analysis of every stage when the nanocoating reacted with glass:(e) pure glass,(f) etched glass by etching solution(NaOH:H2O2=1:25,w/v),and (g)etched glass with MI 4 nanocoating;(h)The C 1s high-resolution (HR) XPS spectra of different specimens.
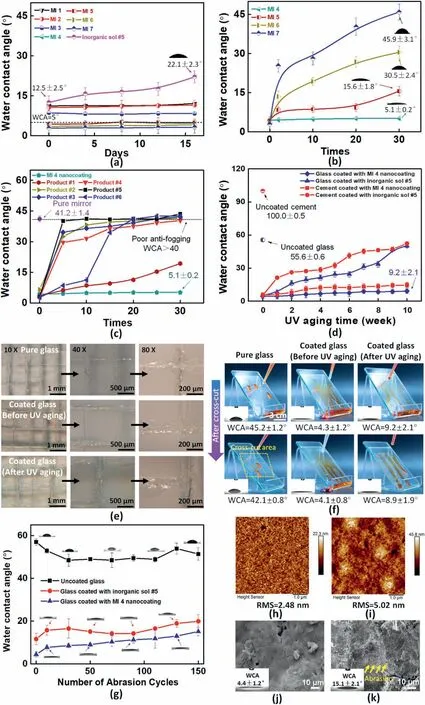
Fig.5.(a)WCAs of inorganic sol#5 with/without M-T20 nanocoatings in an ambient environment at 16 days;(b)Changes in the WCAs of super wetting nanocoatings (e.g.,MI 4,MI 5,MI 6,and MI 7) after 30 times of water flowing test;(c) Changes in the WCAs of commercial coatings(product 1:Solmomt®,product 2:Sinograce®,product 3:Zixilai®,product 4:Huzheng®,product 5:YSD®,product 6:Biran®) and MI 4 nanocoating after 30 times of water invasion test;(d) The relationship of the coated different surfaces'(e.g.,glass and cement plates) wetting properties between UV aging time and WCAs;(e) The cross-cut adhesion test was performed manually to acquire a qualitative impression of the deposited MI 4 nanocoating's adhesion to the etching glass surface,before and after 10 weeks UV aging,the responding results of WCAs test were shown at (f) (water dyed with orange-color);(g) Changes in the WCAs of uncoated glass,glass coated with inorganic sol #5 and glass coated with MI 4 nanocoating after 150 cycles of wear abrasion tests;AFM 2D surface image diagrams of the glass coated with MI 4 nanocoating specimens (h) before 150 abrasion cycles and (i) after 150 abrasion cycles;The SEM images of the glass coated with MI 4 nanocoating specimens (j) before 150 abrasion cycles and (k) after 150 abrasion cycles.
Not only glass but cement-based material was also one of the main materials for building construction.Besides,nanocoatings initial appealing wetting properties changed rapidly after a pretty short period due to UV photo-oxidation processes.To comprehend the mechanism of hydrophilic performance of MI 4 nanocoating on cement plate and glass substrates under UV exposure,it was noticeable that the WCA test was carried out after the specimens were taken from UV aging tester.Obviously,the surface of the uncoated cement specimen was hydrophobic with a WCA of 100.0±0.5°(Fig.5d).Comparison of wetting properties between cement specimens coated with inorganic sol#5 and MI 4 hybrid nanocoating without the UV aging test,both of the surfaces were super wetting with the WCAs of 5.2 ± 1.3°and 4.6 ± 2.2°,respectively.The thickness of MI 4 nanocoating on cement substrates had been measured in Fig.S8.When they suffered from UV aging over the period from 0 to 10 weeks,the trend was towards a larger increase to 52.3 ± 1.7°in the WCAs of inorganic sol #5 specimen,which illustrated that the super wetting effect was lost while there appeared a slightly upward trend after 10 weeks with MI 4 hybrid nanocoating reaching almost 14.7 ± 2.3°.More interestingly,the WCAs of glass-coated specimens were lower than that of cement-coated specimens during the UV aging,it was attributed that the glass surface etched by etching solution was beneficial to improve stronger adhesion properties for MI 4 hybrid nanocoating,which realized lower WCAs on the glass surface.Furthermore,the values of glass coated with inorganic sol#5 also had a significantly raised from 5.3 ± 1.1°to 50.3 ± 1.6°while that of glass coated with MI 4 hybrid nanocoating remained a stable fluctuation from 4.3±1.2°to 9.2±2.1°in the same manner.
Fig.5e and f showed the adhesion of nanocoating before/after 10 weeks of UV aging was estimated quantitatively.According to the standard,the quality of MI 4 nanocoating interlayer was ranked as 0(excellent) before/after UV aging.Furthermore,the wetting properties also used to verify adhesion performances of the nanocoating after the crosscut test(Fig.5f),the values of glass coated with nanocoating(before UV aging)had slight changes from 4.3±1.2°to 4.1±0.8°.In contrast,that of the specimen (after UV aging) remained a stable fluctuation from 9.2 ± 2.1°to 8.9 ± 1.9°in the same manner.It presented outstanding adhesion properties on the glazing substrate.The influence of abrasion was also investigated by detecting the roughness and WCAs before/after the abrasion behaviors.Fig.5g showed the relationship of the pure glass and coated different coatings'wetting properties between abrasion cycles and WCAs.Afterward,the glass coated with MI 4 nanocoating specimen presented the rougher surface from 2.48 nm to 5.02 nm(Fig.5 h and i),the WCAs demonstrated an upward trend from 4.4±1.2°to 15.1±2.1°since the modified organic surfactant was possible to be destroyed.It wasobserved that the roughness was increased due to the abrasive removal of the nanocoating(Fig.5j and k).Compared to the results in terms of the physical properties(such as anti-UV aging,water invasion,and abrasion)results from previous methodologies for fabricating super wetting coatings as summarized in Table 4,the developed special structure of the MI 4 nanocoating was compared with other materials(such as PEMA+PVA,TiO2–ZnO+SiO2,and TEOS+SIA0078)reported in the previous literature,which showed a significant superiority.
The different thicknesses of coated MI 4 nanocoatings had been measured,and the results were listed in Table 5.Nanoindentations tests were conducted on the film-substrate system using a Berkovich tip with a constant indentation depth of 40 nm(less than 10%of the thickness of MI 4 nanocoating).The Young's modulus and hardness of pure glass substrate were 69.1±3.4 GPa,7.4±0.2 GPa,respectively,while the values of MI 4 (S5:368±15 nm) specimen began to stabilize and showed 17.4±0.4 GPa,0.6±0.1 Gpa,respectively(Fig.6).For a system with a thinner coating,the increasing contribution of the hard substrate results in obtained rising material modulus and hardness,approaching that of the pure glass[47,48].
3.3.Durable self-cleaning performances of organic-inorganic hybrid nanocoating
This MI 4 organic-inorganic hybrid nanocoating can fulfill the selfcleaning ability of the building walls/glazing systems and keep them clean and shining.According to the above results,the 10 weeks UV exposure of MI 4 hybrid nanocoating on the cement and glass surfaces can yield lower water contact angles and be quite hydrophilic,with no affinity to the dust stains that were hydrophobic and could be easilywashed away by the water flowing.It was ascribed to the presence of sufficient water-absorber hydroxyl groups from M-T20,which remained on the coating surface for an extended time.This behavior could be evident in the stain-resistance test subjected to UV aging,where the durable self-cleaning performances were observed.

Fig.6.Hardness and Young's modulus were measured by nanoindentation for pure glass (3 ± 0.9 mm) and different thicknesses of MI 4 nanocoating on the glass substrate.
The surface reflectance reduction rate was characterized by selfcleaning performance in the stain-resistance test,the lower value the fewer stains on the testing surface.Fig.7a demonstrated stability with the stain contamination on the uncoated cement specimen surface after 10 weeks of UV aging from 6.7±0.5% to 7.8±0.5%,which displayed poor stain-resistant performance(Fig.7b).It also was showed a dramatic rise of reflectivity value for inorganic sol#5 specimen from 1.4±0.8%to 5.6±0.4%,which exhibited that this nanocoating could be decomposed to lose hydrophilic self-cleaning performance and more stains were found on the surface (Fig.7c).By contrast,the reduction value of coated with MI 4 nanocoating surface presented a slight fluctuation of reflective values from 0.8 ± 0.3% to 2.9 ± 0.7% during 10 weeks UV aging test,accompanying the presence of good adhesion on the surface (Fig.7d).Moreover,this dense clustering of different inorganic NPs from the organic-inorganic hybrids coating in the microholes was leading to decrease cement substrate porosity and be beneficial to prevent the accumulation of dirt/particles,it was an inescapable fact that this hydrophilic building wall presented strong wetting properties towards muddy water,whereas the untreated wall eventually got dirty.
Compared to the glass specimens in Fig.7e,it can be observed that the surface reflectance reduction rate of coated with MI 4 nanocoating sample was lowest than that of pure glass,pure cement board and coated with inorganic sol#5 samples,the visual test results also were following above analysis (Fig.7f–h),it was attributed that surface treatment can provide hydroxylation effectively to enhance adhesion of nanocoating,and organic segment(M-T20)had successfully grafted onto the inorganic layer.Interestingly,the super wetting self-cleaning performance was also related to the surface free energy (SFE) of a solid substrate.Fig.7f showed that the stains on the glass surface accompanied by 130 times water flowing were significantly more than pure cement board since SFE of the glass(83.4 mJ/m2)was lower than cement board(914.69 mJ/m2)[56],the surface tension of water liquid did not change,but rather the surface energy of the cement surface was stronger than the liquid's surface tension and overpowered it,causing more liquid to spread out over the contaminated cement surface.
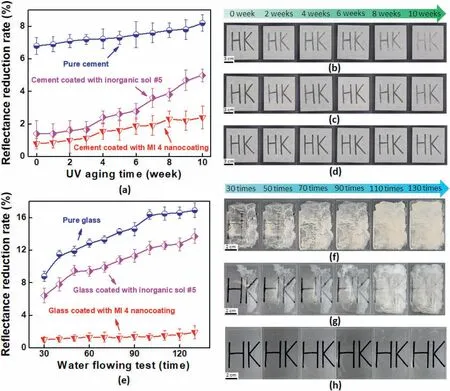
Fig.7.(a)The relationship of the coated cement between UV aging time and reflectance reduction rate;The visual morphologies of the(b)pure cement,(c)cement coated with inorganic sol#5,(d)cement coated with MI 4 nanocoating surfaces after stain-resistance test during 10 weeks UV aging;(e)The relationship of the coated glass between water flowing time and reflectance reduction rate;The visual morphologies of the(f)pure glass,(g)glass coated with inorganic sol#5,(h)glass coated with MI 4 nanocoating surfaces after stain-resistance test during 130 times water flowing tests.
3.4.De-frosting and anti-fogging performances of organic-inorganic hybrid nanocoating
The dynamic de-frosting behavior was investigated to elucidate the underlying mechanism by which super wetting nanocoating can speed the melting process from a frozen state.After 10 min of freezing in the-40°C cooling chamber,we were conscious that all the cooled pure mirror surface was covered by a thick uniform white layer as well as on the hierarchical surface of the coated mirror,due to the condensation frost generation and growth(Figs.8a and 10).The de-frosting began once the temperature of the surfaces was beyond 0°C,and the melting process was recorded regularly.On the pure mirror surface,the ice pieces crumbled in a domino-like way as time passed,resulting in the generation of a lamination structure and lower frost density as shown in Fig.8a at 25–55 s.Eventually,a part of frost was melted at 66 s.
In contrast,the coated mirror with MI 4 nanocoating exhibited a relatively low density of ice fragments,and the mirror vision became more apparent.After the ice had melted into the water at 66 s,the coated surface was almost completely covered with a thin water film with no spherical droplets.Apparently,the MI 4 nanocoating showed superior defrosting efficiency with higher coverage of water-thin film(Movie M1 in the Supporting Information).Transient thermal response images were following the above results,and it can be concluded that at the same observation time,the average temperature of the coated surface was higher than that of the ordinary surface,which meant that the de-frosting speed was better than that of the ordinary surface(Fig.8a).Microscopic examed dynamic de-frosting behaviors on both surfaces.Fig.8c showed the representative frozen fragments with <5 μm diameters within the field of vision (yellow dashed line),and they were distributed on the surfaces in the form of irregular ice pieces before melting (0 s).During the melting process,ice pieces gradually increased their size in the form of water droplets with~10–30 μm diameters(from 0 s to 17 s).However,these droplets could not be actively bridged with each other,eventually forming a "droplet area" on the surface at 17 s.Interestingly,Fig.8 e demonstrated the upper layer frost melted on the coated mirror within a faster time(7 s),preserving continuous liquid phase with tiny ice pieces,then on coated surface we could observe any visible bulk shape fragments shrinking in the de-frosting stage,implying that a lubricating laminar existed between the ice piece and the underlying substrate(Movie M2 in the Supporting Information).
To illustrate how the frost on the covered surface was removed efficiently compared to the pure mirror,the schematic drawing was shown the de-frost morphology evolution on these two surfaces during the melting process (Fig.8b and d).Boreyko et al.reported when the condensate drops became frozen during the frosting process,nearby liquid-phase drops began to evaporate almost instantly,the evaporative water vapor formed an ice bridge with the neighboring frozen drop.If the evaporating liquid drop was close enough to the frozen drop,this ice bridge played a role in extending the road to the water liquid,freezing it when they came into contact and keeping the ripple effect until the whole surface was frozen.It was verified that frost spread via interdrop ice bridge.Besides,between the frozen droplets,there were several types of ice bridges[57].However,some ice bridges easily were broke during the melting process,causing melted droplets to adhere on the surface.A strong ice bridge could transform into a strong liquid water bridge during the melting process,rapidly merging micro-droplets into a larger shape.Maintaining an ultrathin water bridge was challenging since the weak ice bridge may break during the melting process.As a result,the frost show more water droplets may remain stuck on the surface,as shown in Fig.8b.Accordingly,the frozen droplets in the yellow dash line did not show any movements on the pure mirror in the de-frosting process.Among two samples studied,the more roughness with a high surface energy of coated mirror displayed the little ice fragments density after the de-frosting progress.Owing to two main reasons,one is changing the state of metastable Cassie-Baxter wetting into etched Wenzel wetting state before de-frosting process,which resulted in the low water liquid viscidity on the surface after frost melted.The other is based on the development of lubricant-induced surfaces.In particular,a large amount of highly hydrophilic functionalities such as hydroxyl(-OH)in the super wetting coating were crucial to its de-frosting performance.The organic segment (M-T20) in the nanocoating could substantially accelerate the de-frosting rate due to its ability to hydrogen-bond melted water molecules.The more M-T20 content in nanocoating corresponded to faster de-frosting behaviors,as shown in Fig.S9.These hydrogen bonds had attractive intermolecular forces in which partially positive hydrogen atoms were attracted to the highly electronegative oxygen atom of a nearby melted water molecule(Fig.8d).The polar hydrogen bonds were powerful compared to other dipole interactions,and they could serve as a self-lubricating interfacial layer during the melting progress,rapidly merging larger water droplets into a water film.When the de-frosting process during 0–7 s,the rough surface of the coated specimen (MI 4 nanocoating) had a significant affinity for ice and melting droplet,and hence the ice and melting droplet were tightly attached with strong adhesion to the bottom surface (Figs.8e and 7s).In contrast,the upper layers of frost have a relatively weakened interaction.Accordingly,the polar hydrogen bonding at the nanostructured surface acted like a liquid lubricant,speeding up the frost layer removal process and melting into water film(WCA=4.4±0.3°) as described 7–17s.
To explain the efficient de-frosting behaviors on the coated surface indepth,we quantified the variation of average surface temperature over time under ambient conditions and infrared radiation in Fig.9.In the ambient condition(24°C,40%R.H.)test,the coated glass completed the de-frosting process in the 66 s.During this process,the average surface temperature was higher than the pure mirror temperature,and it was due to most of the ice had melted into the water while higher coverage of residual ice crystals remained on the pure surface.Given that under practical conditions of low temperature and high humidity,the super wetting surface would eventually be coated with a frost layer,it was essential further to discuss the de-frosting behavior throughout the heating process.Both two samples of de-frosting behaviors during the infrared radiation process had also been investigated in Fig.S10.When infrared radiation was introduced,the de-frosting time of the coated surface was shortened to 36 S.During this process,the temperature difference between the coated surface and pure surface was as high as 7°C,which was greater than the temperature difference(4.1°C) under ambient temperature test conditions.Fig.S11 presented the temperature of the coated surface was slightly higher than that of the ordinary mirror under the same infrared irradiation.It was confirmed that increasing temperature promoted the progress of de-frosting in the short period(36 s) since Sb-doped SnO2NPs effectively could absorb more infrared radiation in the 760–3000 nm range,causing the surface temperature to be higher than normal temperature,which accelerated the de-frosting process faster.
In addition,since the static water contact angles of these hydrophilic surfaces were less than 40°,they could avoid fogging so long by condensing moisture to a continuous thin film [58,59].Superb anti-fogging performance of the hybrid nanocoatings was evidenced by the hot steam test as shown in Fig.S12.It could be seen how to influence the anti-fogging performance of the coated surfaces relying on observed time and M-T20 content.
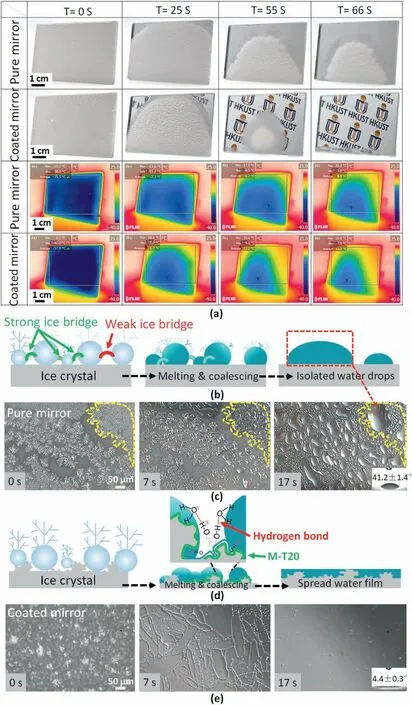
Fig.8.(a) Snapshots of de-frosting behaviors from the freezer (-40 °C) into ambient conditions (24 °C,40% R.H.) on two kinds of surfaces as a function of time and theirs transient thermal response images,the calculated average pure surface temperatures are-35.5 °C,-7.3 °C,0.2 °C,9.4 °C,respectively during 66 s,the calculated average coated surface (MI 4 nanocoating) temperatures are-37.9 °C,1.7 °C,11.2 °C,13.5 °C,respectively during 66 s;(b) Schematic drawing illustrating the mechanism of de-frosting behaviors on the pure mirror;(c) Microscopy visualization of dynamic de-frosting behaviors on the pure mirror surface,scale bar is 50 μm;(d) Schematic drawing illustrating the mechanism of de-frosting behaviors on the coated mirror (MI 4 nanocoating);(e) Microscopy visualization of dynamic de-frosting behaviors without infrared radiation on the coated mirror surface (MI 4 nanocoating).
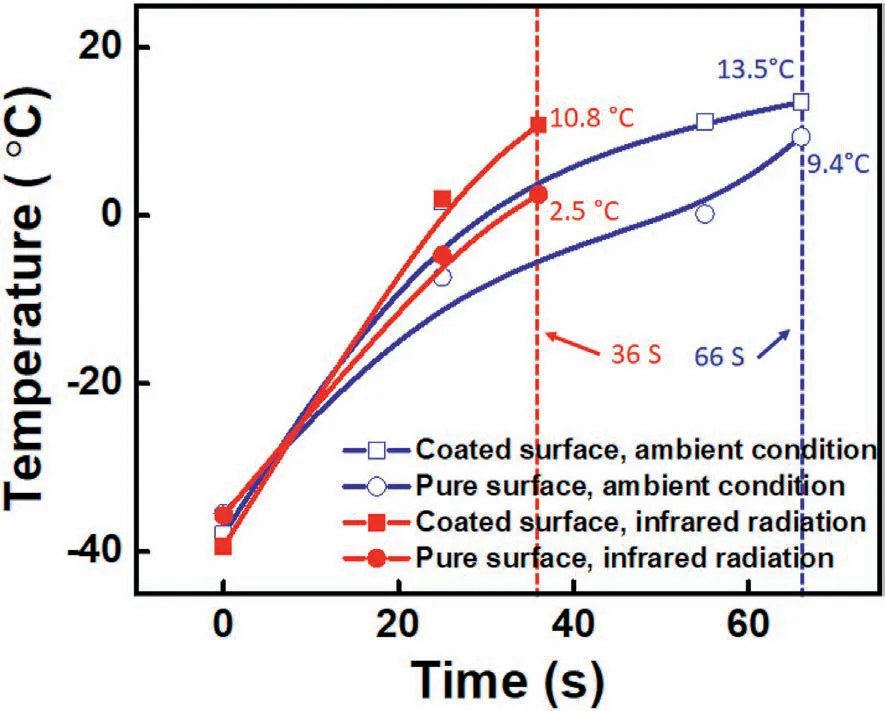
Fig.9.The average temperature variation on different surfaces and observed time under ambient conditions and infrared radiation(The 250 W infrared lamp had a wavelength range of 760–3000 nm,and the radiation distance was kept 15 cm).The average surface temperatures were calculated by FLIR tools software based on thermal response images.The de-frosting behavior of the coated surface was completed in 36 S when infrared radiation was introduced,while the de-frosting process of the coated surface was completed in 66 S under the ambient test condition.
3.5.Thermal insulation properties of organic-inorganic hybrid nanocoating
According to the energy band theory and Fineyl formula [60],materials with low thermal conductivity,forbidden bandgap energy of Eg <0.5 eV or Eg >3.1 eV,and a large refractive index should be considered for heat insulation.Such properties help avoid the absorption of solar energy and the energy level transition of valence electrons.The refractive index of MI 4 containing Sb-doping SnO2of 1.7–3.4,and forbidden bandwidth of 3.26–3.55 eV satisfies the above requirements[61].
Light in the visible and infrared regions contributes to above 90%of total solar heat[62],the wavelength range for Vis-NIR characterization was set to be from 400 to 2500 nm.Fig.10a showed the transmittance spectra of MI 4 nanocoating with different thickness containing Sb-doping SnO2microspheres.The corresponding calculated transmittance is shown in Table 6.It could be seen that the pure glass without MI 4 nanocoating showed the highest transmittance in visible (87.0%)and NIR (81.3%) light region,and the increased thickness of MI 4 nanocoating led to decreases in the transmittance of not only visible light but also NIR.According to the results,the coated with 900 nm thickness had the best NIR shielding property,it could insulate as much as 52.0%NIR while maintained as high as 83.5%visible light transmittance,which could be used as NIR insulating coating for application in the field of building energy conservation.There were several possible reasons for the above results.First,with the thickness of nanocoating increased,the thermal conductivity of Sb-doping SnO2particle insulation increased gradually(Table 6).Second,After the Sb-doping SnO2NPs were doped,the heat insulation effect can be enhanced by absorption,diffuse reflection.Drude theory can interpret the optical properties,which are closely related to the electrical performance of an Sb-doping SnO2.
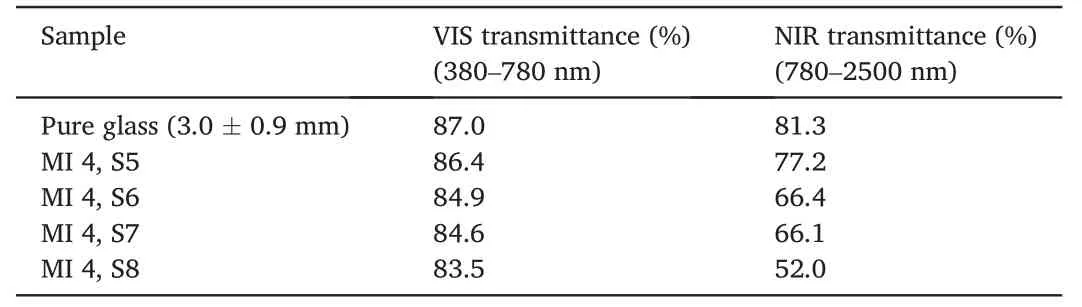
Table 6 The calculated transmittance in visible light and NIR light of different MI 4 nanocoating different thicknesses.
The details of the computation are given as follows[63].
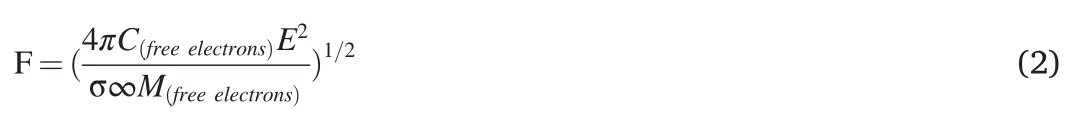
where F is the plasma frequency,C is the concentration of free electrons,σ∞is the high-frequency dielectric constant,M is the effective mass of free electrons,and E is the electronic charge.Sb-doping SnO2possesses a strongly polarized free electron gas and has different electromagnetic shielding effects in radiation with different frequencies.In the visible light range,the F of the electrons can not keep up with the highfrequency change of the radiation,so absorption and reflection are reduced to allow light transmission.In the low-frequency region,the F of the electrons and radiation are consistent,while in the high-frequency region,intrinsic absorption occurs.Therefore,the electromagnetic shielding of the radiation is vital in the ultraviolet and infrared range.However,the electromagnetic shielding effect of submicron particles is relatively weak.The excellent heat insulation performance of the MI 4 nanocoating primarily depends on high absorption and low thermal conduction.Moreover,the roughness structure built by different sizes of inorganic particles could lead to multi-level reflection on the exterior surface,resulting in a reduction in diffuse reflectance and a decrease in transmittance.
The thermal insulation performance of MI 4 nanocoating coated glass was investigated using an in-house-made thermal insulation setup.The measured temperature curves were presented in Fig.10b.The temperatures of the chambers increased with illumination time increasing.MI 4 nanocoating application reduced the temperature rise rate.After being illuminated for 60 min,the glass coated with 900 nm thickness even showed the lowest chamber temperature rise rate than that of glass coated with other thickness nanocoatings.The temperature of the chamber was dramatically dropped from 44.5°C to 41.4°C over the illumination time.Fig.10c showed the thermal reduction ratio increased with the increasing thickness of nanocoating on the glass surface.A possible explanation for the temperature-raised rate increasing when the thickness of nanocoating was above 900 nm was that more Sb-doping SnO2particles would absorb more heat,which would counterbalance the insulation effect resulting from multi-level reflection.
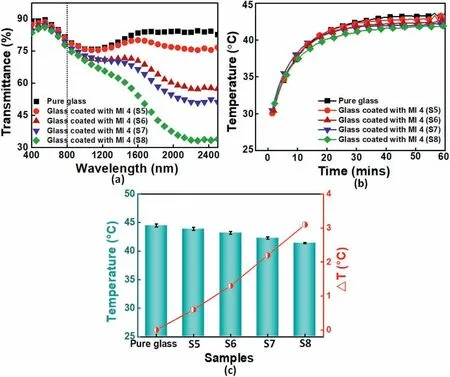
Fig.10.(a)Schematic illustration of the infrared thermography of pure glass and glass coated with different thickness MI 4 nanocoating (S5:368 ± 15 nm,S6:562 ± 22 nm,S7:763 ± 21 nm,S8:998 ± 13 nm) over near-infrared wavelength region;(b) Chamber temperature dependence on irradiation time for pure glass,glass coated with different thickness MI 4 nanocoating;(c) The relationship between the thickness of MI 4 nanocoating,the temperature of the chambers and reduction of the temperature difference (△T).
4.Conclusions
In summary,we reported a versatile strategy for developing a super wetting multifunctional nanocoating based on Sb-doping SnO2sol with incorporating an isocyanate silane-modified surfactant for the glazing and cement-based surfaces with the following characteristics:
●The formed nanocoating was highly transparent (Vis transmittance above 85%) as same as pure glass,extremely super wetting(WCA=4.4±0.3°),and demonstrated superb de-frosting and antifogging performances,respectively;
●This hybrid nanocoating presented an assertive adhesion behavior by cross-cut test (Excellent:0 grade),better abrasion resistance,and remained the lowest WCA=5.1 ± 0.2°on the glass after 0.6 m/s water flowing for 30 times(150 min)under 0.4 Mpa;
●It also exhibited excellent resistance to 10 weeks of UV aging on the glass and cement substrates with WCA=9.2±2.1°and 14.7±2.3°,respectively.After the test,it demonstrated the durable self-cleaning performance on the cement and glass surfaces with a low 2.9±0.7% and 1.9±0.8% reflectance reduction rate,respectively;
●Moreover,this novel nanocoating containing Sb-doping SnO2particles showed significant abilities to thermal insulation property,achieving an effective IR shielding performance with above 900 nm thickness on the glass surface.
Therefore,this nanocoating could integrate durable self-cleaning,defrosting,anti-fogging,and thermal insulation properties.This strategy would be valuable for the development of building construction applications,such as cement curtain walls,mirrors,windows,etc.
5.Associated content
Supporting Information.The particle size distribution of prepared various inorganic sols under different synthesis temperatures:25°C;30°C;40°C;50°C;70°C,obtained by DLS measurement;The EDX spectrum and elemental content of pure glass surface;Static contact angles of the hybrids in the different formulation of inorganic sols to Water,Ethylene Glycol,and Soybean Oil;Comparison of transparency properties between the pure glass and different formulas of hybrid nanocoatings with~360 nm thickness;AFM 2D surface image and 3D topographic diagrams of the specimens.Pure glass,Etched glass with nanocoating(MI 4,S5).Scan area size was 5 μm × 5 μm;AFM 2D surface image and 3D topographic diagrams of the etched glass with nanocoatings.MI 2,MI 3 and MI 7.Scan area size was 5 μm × 5 μm;Optical profilometry 2D surface image and 3D topographic diagrams of the specimens:Pure glass,Etched glass with nanocoating (MI 4,S5).Scan area size was 640 μm × 480 μm;Optical profilometry 2D surface image and 3D diagrams of the etched glass with nanocoatings.MI 2,MI 3 and MI 7.Scan area size was 640 μm×480 μm;The thickness measurements of coated with MI 4 nanocoating on cement substrate(thickness:396±23 nm)by an Alpha-Step D500 Stylus Profiler;After 66 s removed MI 2,MI 3,and MI 7 hybrid nanocoatings from the freezer (-40°C) into ambient conditions (24°C,40% R.H.);Snapshots of de-frosting behaviors with infrared radiation on different surfaces as a function of time and theirs transient thermal response images,the calculated average pure surface temperatures were -35.7°C,-4.7°C,2.5°C,10.5°C,respectively during 55 s,the calculated average coated surface temperatures were-39.4°C,2.0°C,10.8°C,16.9°C,respectively during 55 s;Microscopy visualization of dynamic de-frosting behaviors with infrared radiation on different surfaces.The 250 W infrared lamp had a wavelength range of 760–3000 nm,and the radiation distance was kept 15 cm;The thermal response images with infrared radiation on different surfaces as a function of time,the calculated average pure surface temperatures were 26.4°C,26.9°C,26.9°C,27.2°C,respectively during 55 s,the calculated average coated surface temperatures were 27.0°C,27.3°C,27.8°C,27.8°C,respectively during 55 s;Steam anti-fogging tests of MI 2,MI 3,MI 4,and MI 7 hybrid nanocoatings after 300 s in service(PDF).
Notes
The authors declare no competing financial interest.
Acknowledgment
The authors are grateful for the support from The Hong Kong University of Science and Technology(Grants#:R9365,F0776,and F0782).The authors are also thankful to the staff in the Electronic Packaging Laboratory (EPACK) of the HKUST for the film thickness measurement and the Materials Characterization and Preparation Facility (MCPF) of HKUST for their generous help,primarily many thanks to Nick K HO in MCPF for offering practical XPS test assistance.
Appendix A.Supplementary data
Supplementary data to this article can be found online at https://doi.org/10.1016/j.nanoms.2021.09.001.
杂志排行
Namo Materials Science的其它文章
- Drop casting based superhydrophobic and electrically conductive coating for high performance strain sensing
- Preparation of porous polyamide 6(PA6)membrane with copper oxide(CuO) nanoparticles selectively localized at the wall of the pores via reactive extrusion
- Significantly enhancing fracture toughness of epoxy composite with promising γ-FeOOH@Fe2O3 hybrid nanoparticles by magnetic field assistance
- Enhanced thermal conductivity and microwave dielectric properties by mesostructural design of multiphase nanocomposite
- Core-shell structured silk Fibroin/PVDF piezoelectric nanofibers for energy harvesting and self-powered sensing
- Molecular dynamics study on mechanical behaviors of Ti/Ni nanolaminate with a pre-existing void