Active tectonics of the eastern java based on a decade of recent continuous geodetic observation
2022-07-15RetnoEkYuniPurwningsihAdeliSekrsriTikWidySriCeepPrtmSidikTriWibowo
Retno Ek Yuni Purwningsih , Adeli Sekrsri , Tik Widy Sri , Ceep Prtm ,Sidik Tri Wibowo
a Graduate School of Geodetic Engineering, Universitas Gadjah Mada, Yogyakarta, Indonesia
b Department of Geodetic Engineering, Universitas Gadjah Mada, Yogyakarta, Indonesia
c Geospatial Information Agency, Cibinong, Indonesia
Keywords:GPS Fault Deformation Strain Java Active tectonics
ABSTRACT The eastern part of Java Island is transversed by major faults such as Cepu, Blumbang, Surabaya, and Waru Segment,part of the Kendeng Fault,Wonsorejo Fault,Pasuruan Fault,and Probolinggo Fault.Due to the major fault, we used decomposition of identified fault from the Global Navigation Satellite System(GNSS)observation data to identify the potential of local deformation.We analyzed surface deformation due to the effect of major fault using scaling law and elastic half-space method. We investigated the possibility of unidentified fault using strain rates based on velocity vector data before and after correcting the effect of a major fault.We found that strain calculation for principal strain value in the eastern part of Java Island is less than one microstrain/year and the dominant one with a compression pattern due to the Sunda subduction zone.The maximum shear strain rate value goes from 0.002 to 0.094 microstrain/year,and the dilatation rate value ranges from -0.141 to 0.038 microstrain/year, which correlates with the reverse of the Kendeng Fault. A higher compression pattern outside the major fault in a differential maximum shear strain rate might indicate a local fault.
1. Introduction
Active tectonic activity is the main source of an earthquake.The M7.6 earthquake that occurred in a subduction zone in 1994 [1] triggered many shallow earthquakes with M<3.7 in East Java [2]. East Java is located near the subduction zone and transversed with many major faults, making these regions have high-risk earthquakes [3,4]. Increased seismic activities far from major faults may indicate a new local fault that has not been identified. These seismic activities are shown in Fig. 1. The previous studies have investigated the major faults such as Kendeng,Wonsorejo, Pasuruan, and Probolinggo faults [2]. We investigate active tectonic deformation in Java,focusing on identifying active fault using geodetic strain rate analysis [5] and reduce the surface deformation value of each major fault to identify new local faults.
We model surface deformation of tectonic fault by assuming proper fault geometry definition and possible sources of stress distribution from earthquakes. We calculate surface deformation using elastic half-space theory [6] and characteristics of tectonic fault using scaling law [7]. Previous studies aim for surface deformation using the inverse method to estimate fault geometry [8]and finite rectangular sources [9]. Meanwhile, in this study, we estimate surface deformation with point source from parameters fault geometry, using the forward method.
In this study, we calculate GNSS velocity data from 24 stations between 2010 and 2019 to estimate strain rates that can provide information to an identified new local fault.This study is significant because, in previous studies, the strain rate map did not use the latest GNSS observation and were still associated with major faults[5]. We estimate GNSS velocity considering seasonal, co-seismic,and post-seismic offsets due to earthquake activities. We remove surface deformation of major faults in order to estimate velocity and use that velocity in strain rate estimation.
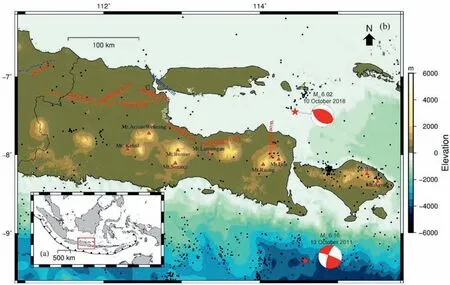
Fig.1. (a)Map of Indonesia archipelago with Sunda trench indicated by triangle solid black line.The red square indicates the area of interest.(b)Seismic activities in the eastern part of Java from 2010 to 2019 recorded by the BMKG network are indicated by solid black circles(depth less than 50 km).Solid red lines represent the proposed faults in this study while dashed blue lines represent faults that have not been considered in this study.Red triangles indicate volcanoes.The focal mechanism represents the 2018 MW 6.02 and 2011 MW 6.16 earthquakes.
2. Data and methods
2.1. GNSS observation
We used the GNSS stations in the eastern part of java,and those stations are included in the Indonesian Continuous Operating Reference Station (Ina-CORS) network operated by the Geospatial Information Agency of Indonesia (BIG) [10]. We obtained daily solutions between 2010 and 2019 tied to International Terrestrial Reference Frame 2008(ITRF2008)[11].The data were processed by GAMIT/GLOBK 10.6 software [12], and we included the 15 International GNSS Service(IGS)stations in the processing along with all observation sites. That IGS stations around Indonesia in the processing, namely COCO, XMIS, KARR, YARR, DARW, ALIC, TOW2,KOUC, PIMO, TNML, WUHN, LHAZ, HYDE, DGAR, and BAN2. We used ocean loading correction (FES2004) [13], pole tide and solid earth tide correction (IERS2003) [14]. These corrections are intended to ensure accurate results obtained to meet the standard of accuracy set.The chosen GNSS station span is to estimate strain rate in the East Java region fully.
In order to represent the local deformation, we translated the GNSS daily solution into Sundaland block reference frame using the Euler Pole angular velocity (ϖ) 0.336/Myr and its position(49.0N, -94.2E) tied to ITRF 2000 [15]. Based on that, we transformed our GNSS daily solution from ITRF2008 to ITRF2000[16]. After obtaining the daily solution with respect to the Sundaland block, we estimated the velocity of each GNSS stations using a combination of several mathematical expressions regarding the geophysical signal.Finally,we decompose the GNSS daily solution considering seasonal, co-seismic, and post-seismic offsets due to earthquake activity to get secular motion [17,18].Thus, the equation can be written as follows:
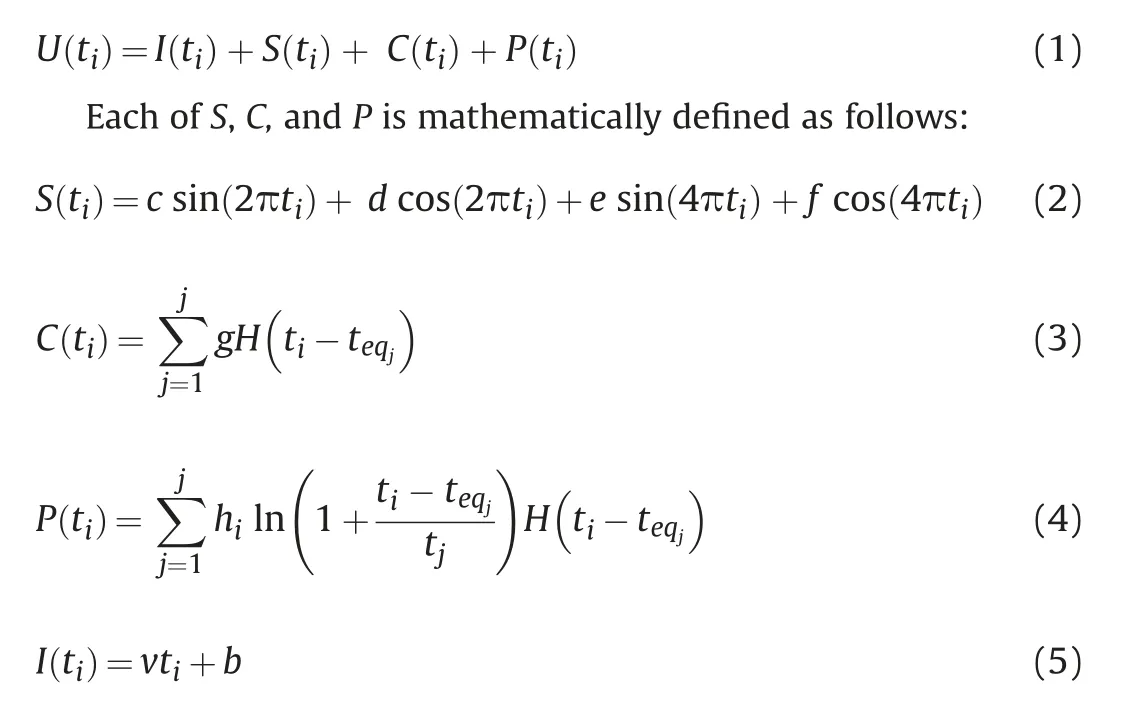
Post-seismic and co-seismic deformation were assumed by logarithmic[17]and step functions[16],respectively.In the case of the seasonal signal represented by a sinusoidal function. v represents secular motion, tis observation date, and U is the daily solution. H represents step function and tis earthquake date. On the other hand, b denotes intercept, c, d, e, f represent the seasonal amplitude, and g, h indicate the co-seismic deformation and amplitude of the post-seismic decay term, respectively. We used the United States of Geological Survey (USGS) earthquake catalog that occurred in this study area and at the time of this study to estimate the co-seismic and post-seismic effects.
In this study, we used earthquakes with Mlarger than 6.These earthquakes are shown in Fig.1, consisting of the 2011 M6.16 and the 2018 M6.02 earthquakes. We calculated the secular trend and coseismic offset parameters, including its uncertainty, using the least square method as shown in Table 1 and Table 2, respectively. The coseismic offset affected the nearest site,such as the CBRN station for the 2018 M6.02 earthquake or CPES station for the 2011 M6.16 earthquake (Table 2). In addition, we tested with several decay time of logarithmic function but the estimated secular motion did not change significantly. Hence, we conclude that the coseismic of the two earthquakes influence the nearest observation site but do not produce significant post-seismic deformation. The trend and GNSS dataset span are shown in Fig. 2.
2.2. Strain rate
We utilized strain rate to identify active tectonics in eastern Java. Since the strain rate analysis does not depend on the reference frame, it is acceptable for tectonic discussion [19]. We calculated the principal strain with two kinds of velocity data.The first is secular motion considering seasonal,co-seismic,and postseismic offsets due to earthquake activities. The second data is secular motion after correcting the effect of a major fault.This data is calculated with velocity interpolation for strain rate (VISR) algorithm. The method is an optimally horizontal strain rate field based on least square and spatial weighting[20]. This study used distance-dependent weighting that can be optimally achieved by employing a Gaussian weighting scheme to estimate principal strain. The equation of these methods can be written below.

The eigenvalue of the strain tensor gives us the principal strain rate consisting of maximum and minimum strain rates denoted by λand λ, respectively. Based on that, we can determine the dilatation rate and the maximum strain rate. The dilatation rate can identify and is related to the dip-slip faulting mechanism [19].Meanwhile,the maximum strain rate corresponds to the strike-slip faulting mechanism [5,19,21].
2.3. Fault parameters
The fault parameters consist of the size of the fault, namely length, width, and depth of the fault. In addition, there are displacement distance, seismic moments, as well as the source process of breaking rocks during an earthquake. Strike is the direction of the fault measured clockwise from the north point.Dip is the fault angle of the footwall measured from the horizontal plane.Rake is the direction of movement from the strike direction to which the slip moves [16,17,22]. Based on the direction of movement and the angle of dip, the fault mechanism is divided into 3 basic movements,that is,strike-slip fault,normal fault and reverse fault [22-24].
We get information related to the fault plane parameters from geological research that have been done previously. From that information, we can calculate surface deformation due to the possibility of earthquakes occurring in the fault area in the co-seismic and inter-seismic phases. All the information on the fault plane parameters are shown in Table 3.

Table 1 A detailed estimate of secular motion with two sigma standard deviation concerning the Sundaland block.The secular motion considers seasonal,co-seismic,and post-seismic offsets (s.c.p).
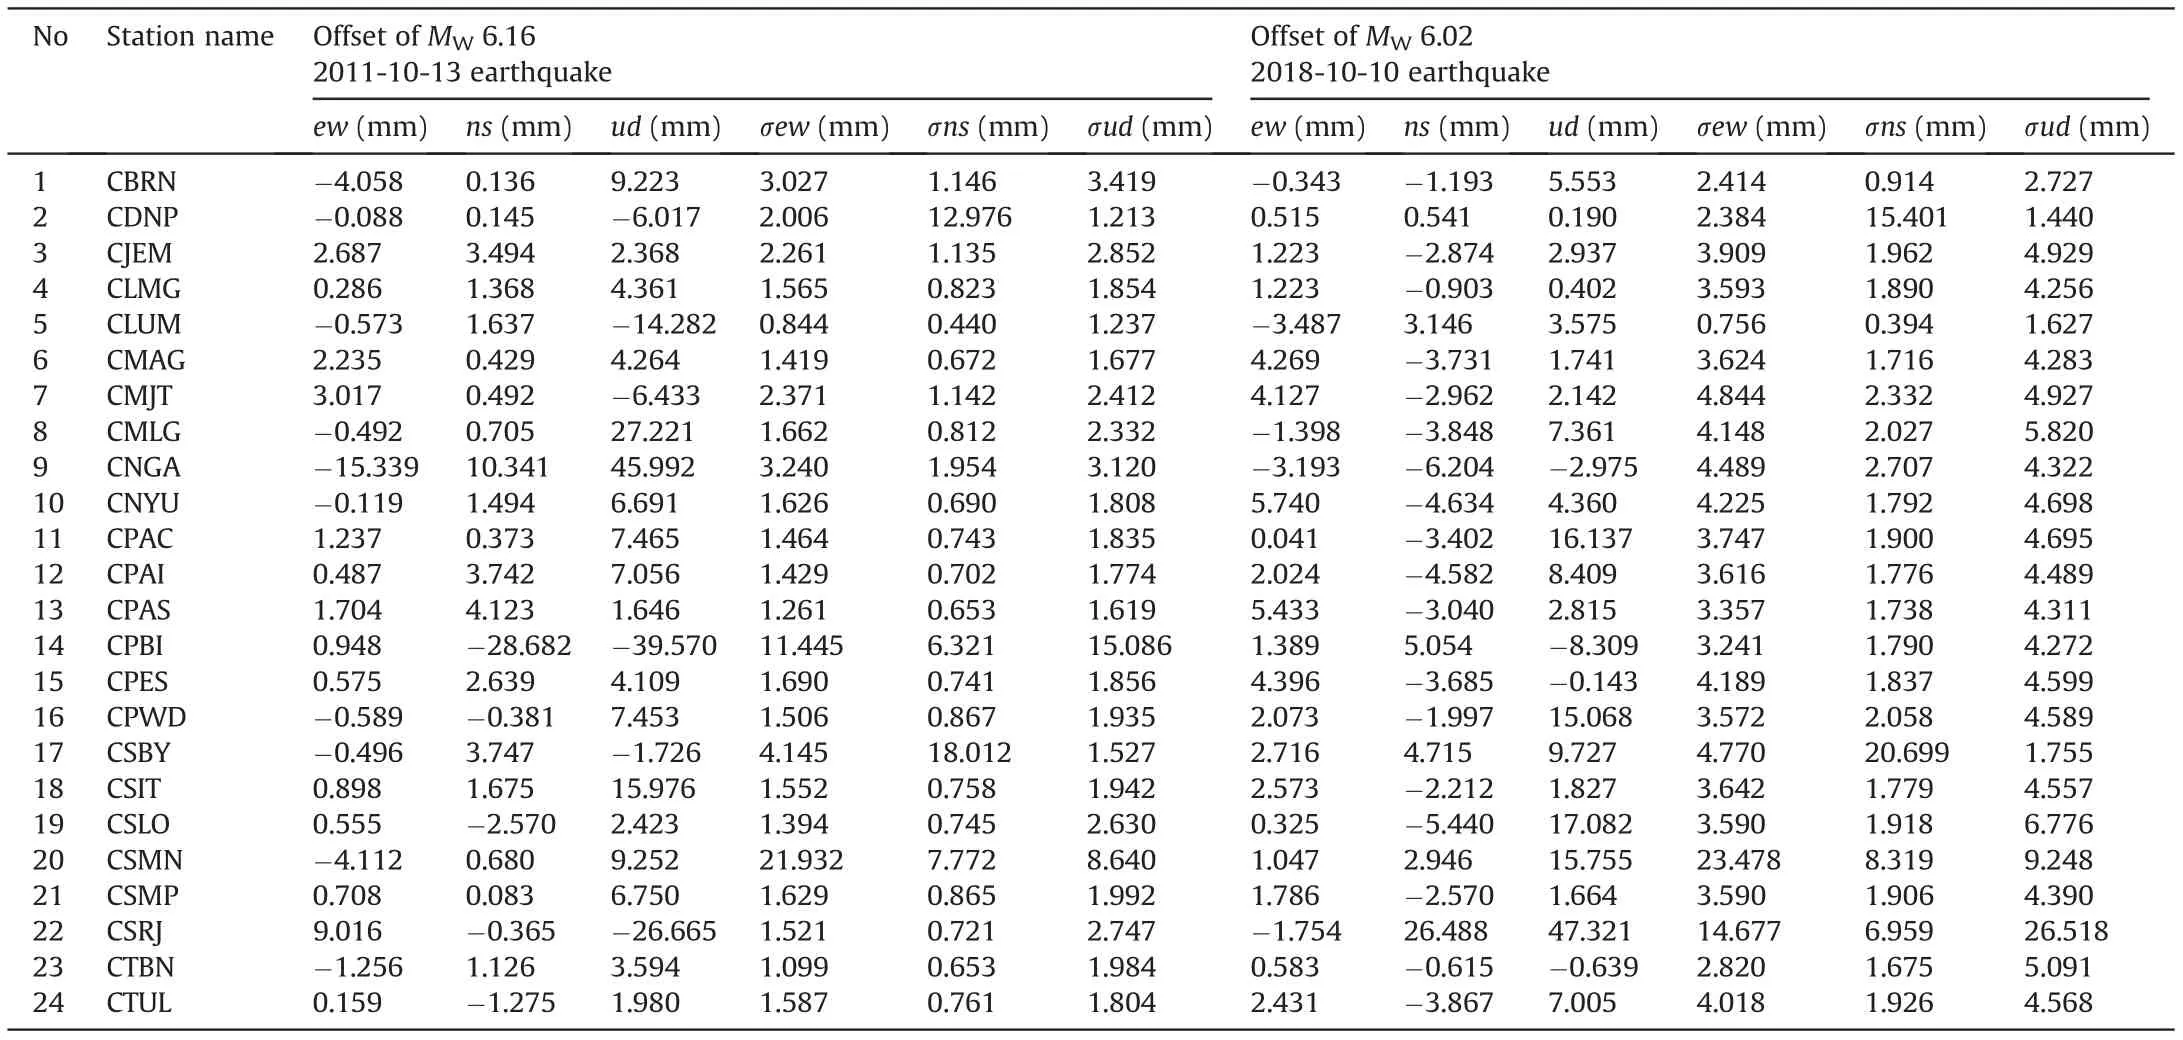
Table 2 Detailed site profile and its expected co-seismic and post-seismic displacement accumulation during January 1, 2010 to December 31, 2019 associated with the two earthquakes.

Fig. 2. Observed surface displacement at GNSS stations in the eastern part of Java. Colored dots represent GNSS daily solutions from 2010 to 2019. Colored lines indicate fitted displacement model consisting of linear, sinusoidal, logarithmic, and step features.

Table 3 Fault parameters of active faults in East Java.
2.4. Surface deformation
We calculated surface deformation using assumed possible sources of stress distribution from an earthquake in the fault plane[2] represented by the elastic half-space model [6]. Characteristics of tectonic fault such as rupture length and width using scaling law[7,17]. Mathematical processes on how to slip by force on the fault plane to generate deformation on the surface can be written below.
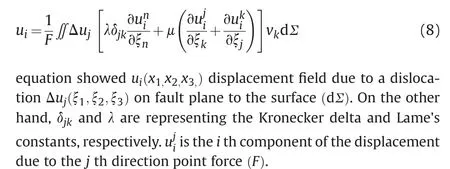
We introduce fault decomposition in this study to obtain actual strain anomaly in the strain maps. We modeled total deformation from all major identified faults based on previous report [2]. In order to obtain interseismic deformation, we divide the total deformation assuming the earthquake return period. To simplify the calculation,we assumed the earthquakes period is homogenous within a 180-year period based on the average return period in previous study [2]. Therefore, we removed interseismic surface deformation of major faults from all GNSS stations in order to estimate secular GNSS velocities and used those velocities in strain rate estimation. Hence, we estimated velocity considering the deformation surface of major fault using displacement and earthquake period [7,25].
3. Result and discussion
3.1. Displacement rate
The estimated secular motion on the GNSS stations in the eastern part of java from 2010 to 2019 is shown in Fig. 3. We obtained secular motion with respect to the Sundaland block showing dominant counterclockwise rotation, increasing towards the east.The magnitude of the velocities varies from 0.9 mm/yr to 12.4 mm/yr in the east. The detailed magnitude of the secular motion is shown in Table 4.
Our estimated secular motion for the vertical component exhibits various rates and trends shown in Fig.3.GNSS stations such as CMAG, CNGA, CMLG, CLUM, CSIT, CPES, CNYU, CPBI show uplift trends while other stations exhibit subsidence. Groundwater exploitation activity in East Java causes subsidence trends in many areas[9,26].
Distance between GNSS station and major fault contributes to the magnitude of secular motion considering surface deformation of a major fault. However, in this study, the minimum distance between GNSS stations and major faults has not been determined due to heterogeneous fault characteristic information.Therefore,to identify local deformation, we focused on the horizontal component to generate the principal strain rate, dilatation rate, and maximum shear strain rate based on the magnitude of secular motion shown in Table 4.
3.2. Principal strain rate
Our results of the secular motion gridding are used to calculate principal strain rate and rotation parameters in the East Java region using the VISR algorithm. Fig. 4 and Fig. 5 show a visualization of the estimated principal axes of the strain rates. The interpolation results show that the East Java region is dominated by compression values with different rotation directions. The dominant compression strain pattern indicates the accumulation of energy from the accumulated pressure due to the Sunda subduction zone,which is consistent with previous studies [4,5,27]. In addition, the higher compression pattern occurs in the central to the eastern part of East Java near CTUL, CSBY, CMLG, and CNYU stations.
A larger compressional strain in the Surabaya to Madura Strait might also be influenced by the tectonic activity of the Kendeng Fault [5,26]. Meanwhile, the eastern part of East Java, near CLUM experience a small strain rate from -0.05 microstrain/yr to -0.01 microstrain/yr(<1 microstrain/yr).The larger extensional strain up to 0.05 microstrain/yr in the eastern part of East Java is near the CTBN station.
3.3. Maximum shear strain rate
We obtain the maximum shear strain rate in the regions shown in Fig.4.Our result shows a higher maximum shear strain rate region represented by the blue,yellow,and green boxes.The maximum strain rate in the blue box range from 0.024 microstrain/yr to 0.04 microstrain/yr. The maximum shear strain rate in this region might be influenced due to the effect of the Pati Fault that has not been considered in this study. The higher maximum shear strain rate coincides with Pati Fault, which is considered a strike-slip faulting mechanism [2]. On the other hand, in the yellow box, the higher maximum strain rate coincides with the increase of Bromo volcano activity in 2010 and 2015 [28,29].
The maximum strain rate in the green box range from 0.015 microstrain/yr to 0.94 microstrain/yr. The region is far from the major fault but gives us the maximum magnitude.The compression of the maximum shear strain can be affected due to a fault activity with a strike-slip mechanism[5].Along this maximum shear strain rate region, we might find another unmapped fault since a M 4.2 earthquake with slightly damaging has occurred at the same location on June 25, 2015 [30].
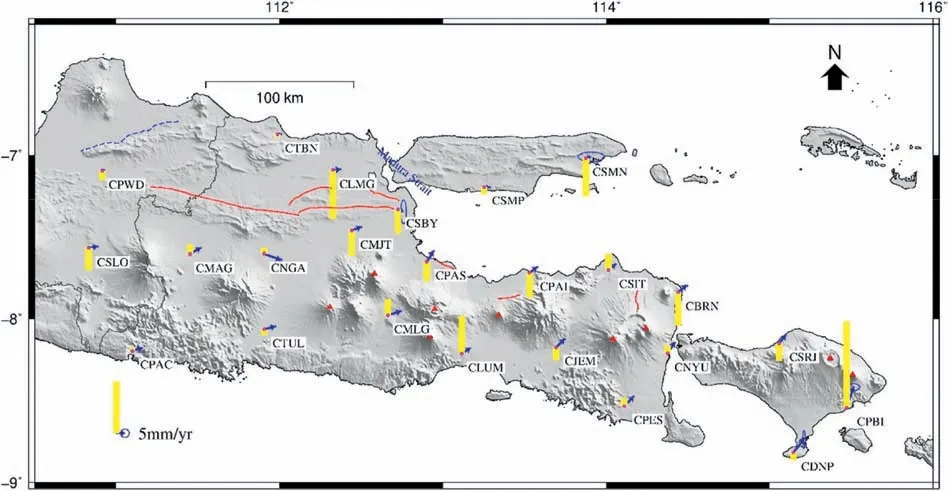
Fig. 3. The secular motion of GNSS stations in the eastern part of Java. The blue arrows and yellow bars represent the horizontal and vertical secular motion with respect to Sundaland Block, respectively.
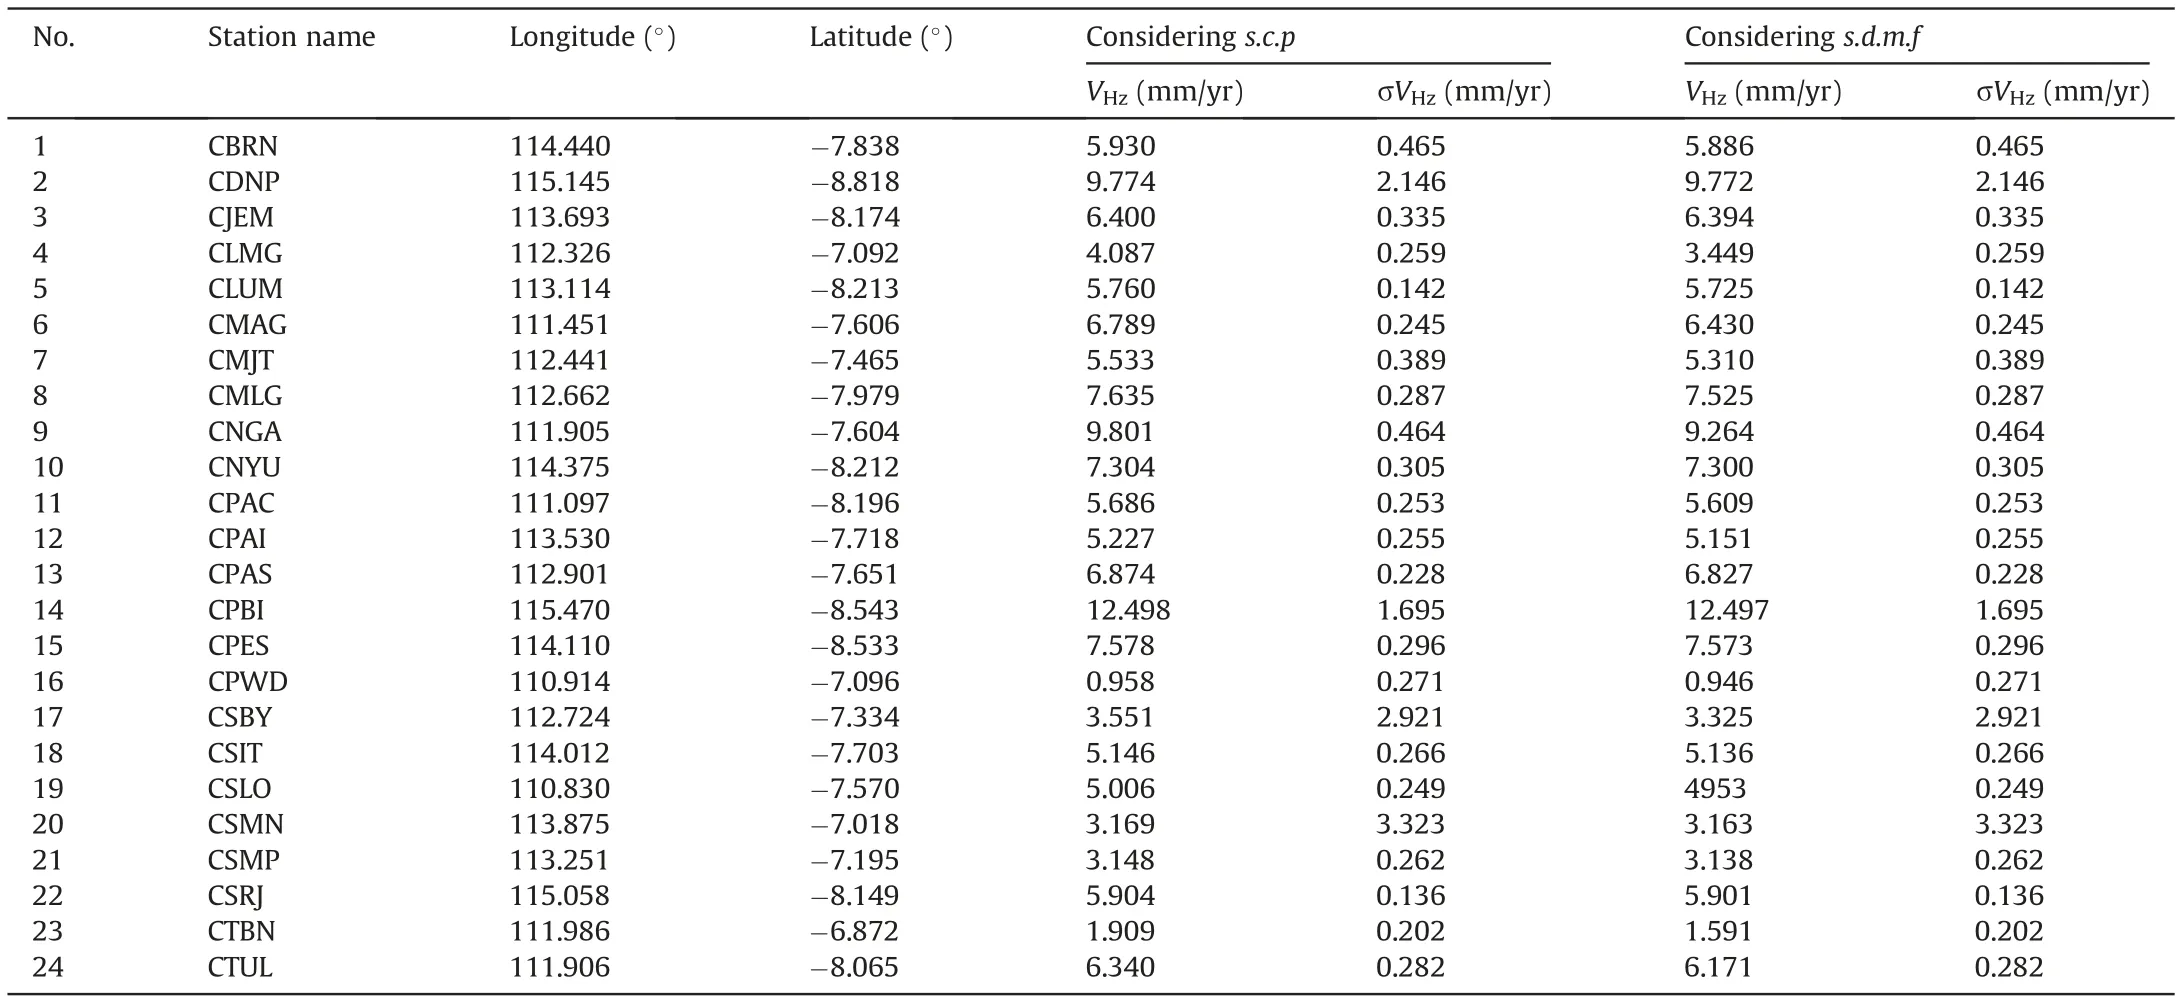
Table 4 The detailed magnitude of secular motion with two sigma standard deviation with respect to Sundaland block.The secular motion has considered seasonal, co-seismic and post-seismic offsets (s.c.p)and surface deformation of major fault (s.d.m.f).
In the southern part of East Java near CNGA station, a large compressional region (<-0.01 microstrain/yr) has occurred. This pattern is related to the fault activity in this region. Historical seismic activities support our deformation model by the increase of the earthquake number happened in 2015-2016. As many as 33 events with magnitude of 2.5-3.7 have occurred in the Madiun area and its surroundings [2,25].
3.4. Dilatation rate
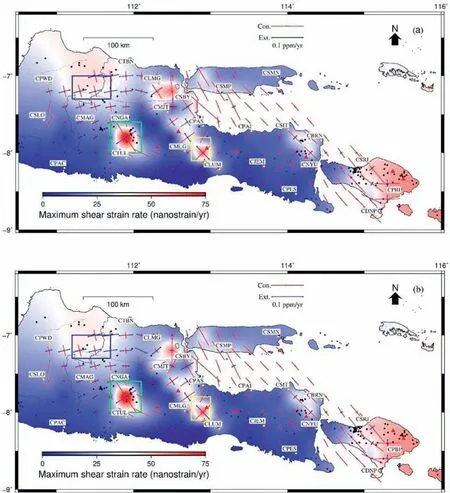
Fig. 4. (a) Estimated maximum shear strain rate distribution before major fault decomposition. (b) Estimated maximum shear strain rate distribution after major fault decomposition. Red and blue arrows represent compression and extension, respectively. The seismicity distribution description is the same as Fig. 1. Solid black lines represent the proposed faults in this study. The volcanoes and the GNSS stations are represented by red triangles and yellow dots, respectively.
We obtain the dilatation rate for both compressional and extensional regions shown in Fig. 5. Our results show the large magnitude of the dilatation rate around-0.141 microstrain/yr.We observe a larger compressional dilatation rate near the CSBY station. Previous studies identified that the northeastern East Java to Madura Strait has a large compression due to the tectonic activity of the Kendeng Fault [5]. In addition, a Magnetotellurics method suggests near-surface fault trace of Kendeng thrust [31] and geological evidence of multiple ground-rupturing earthquake near Madura strait associated with Pasuruan and Kendeng faults [32].
We also observe a higher compressional dilatation rate near the CSRJ station,which might indicate either a volcanic activity or dipslip faulting. However, the volcanic mountain near CSRJ related to the Buyan-Bratan caldera has erupted long ago in the Holocene period, while the youngest eruption event comes from outside in AD 1257 [33]. Hence, another possibility of the higher compressional strain rate than surrounding might indicate an unidentified fault with a dip-slip mechanism.
3.5. Differential strain map analysis
In the area before and after major fault decomposition the earthquake magnitude were still relatively the same. This indicates that the influence of the major fault was insignificant or did not affect the area at all.The further analysis in areas with different magnitude can be carried out using differential strain analysis. We subtracted the estimate of the strain maps (dilatation and maximum shear strain)before and after major fault decomposition to get the differential magnitude. After that, we estimated the differential magnitude to get a differential strain map,shown in Fig.6.In Fig.6a,there is still a compression region marked by the blue box indicating fault potential with a strike-slip mechanism.The compression contradicts the tectonic activity of Kendeng Fault with the thrust faulting mechanism [27]. Based on that, we can get information that the characteristic of the major fault is unrepresentative[2].
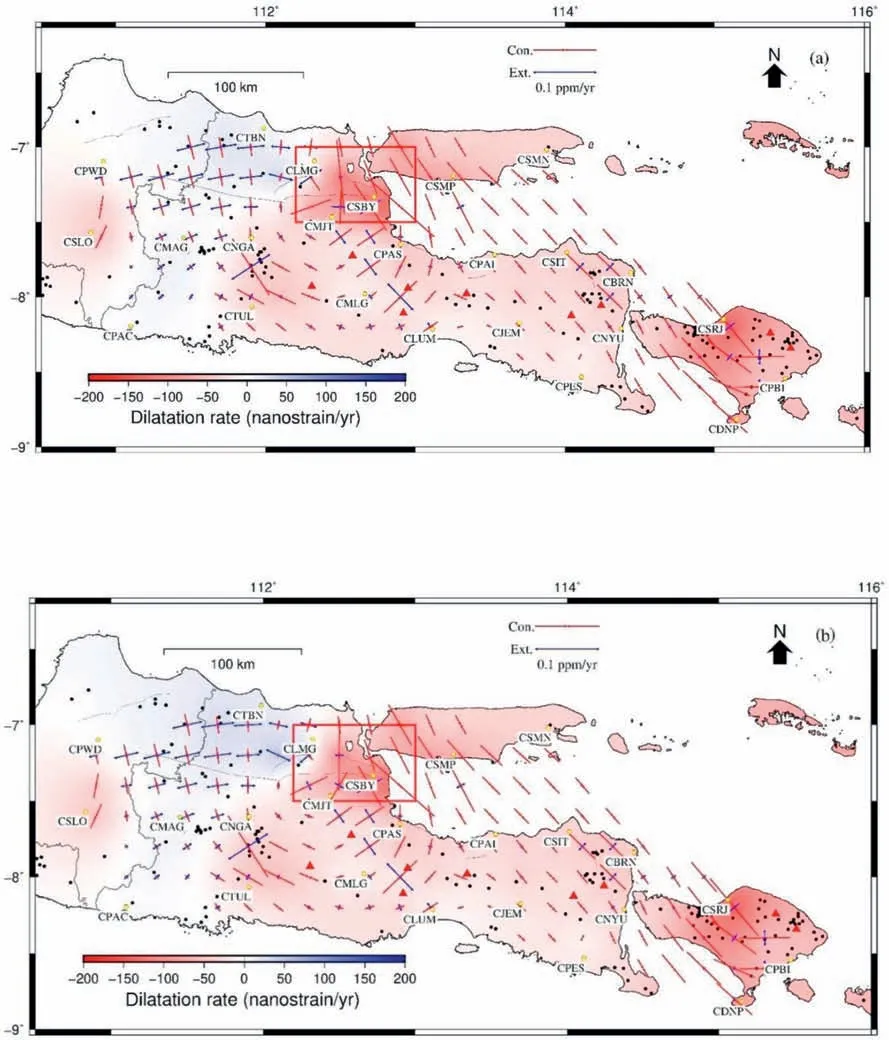
Fig. 5. (a) Estimated distribution of dilatation rate based on GNSS velocity before major fault decomposition. (b) Estimated distribution of dilatation rate based on GNSS velocity after major fault decomposition. The positive and negative values indicate extension and compression, respectively. Other legends are the same as Fig. 4.
The region in the blue box from Fig. 6 (b) and Fig. 5 gives us different results that it changed from compression to extension.That might be related to the post-seismic of the M 4.2 earthquake occurred on June 25, 2015, which has not been considered in this study. After the main shock, 33 small earthquakes with depth less than 30 km occurred in February 2016 [2,34]. From the geological map, we can get information on those regions located in Kendeng Basin between Mt.Willis and Mt.Kelud,whose subsidence history is related to volcanic activity within the Southern Mountains Arc[35]. We need a more detailed investigation and analysis study of geology and geophysics to confirm the new local fault.
The region marked by the red box in Fig. 6 (b), still had a compression pattern that indicates fault potential with a dip-slip mechanism.However,in that area,Kendeng Fault is proposed as a strike-slip faulting mechanism [27]. Based on that, we can get information that the characteristic of the major fault is unrepresentative.
The region in the green box from Fig. 6 (b) and Fig. 5 gives us different results that it changed from compression to extension.That compression related to Wongsorejo Fault proposed with thrust faulting mechanism and the characteristic of the fault we used still unrepresentative.It is also affected by the Mt.Raung and Mt.Ijen volcano activity in 2011,2012,and 2020.As can be seen in Fig. 6 (b), the region in the yellow box also changes from compression to extension. That higher compression might be related to the tectonic activity of the Kendeng Fault.
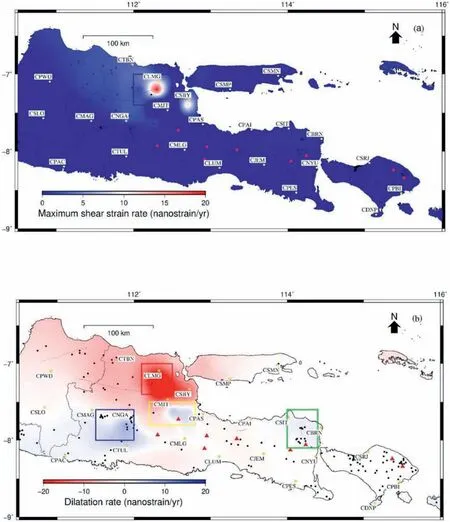
Fig. 6. (a) Differential distribution of maximum shear strain rate before and after major fault decomposition. (b) Differential distribution of dilatation rate before and after major fault decomposition. Other legends are the same as Fig. 4.
4. Conclusion
We demonstrate and analyze the principal strain rate to identify the possibility of new local faults using major fault decomposition.Our result shows that the magnitude of the principal strain rate in East Java is larger than 1 microstrain/yr). The pattern of principal strain before and after major fault decomposition, is dominant compression strain due to the Sunda subduction zone.However,the highest compression is estimated in the northeastern part of Java Island to Madura Strait,which might indicate local fault activity.The compression pattern in the differential of maximum shear strain rate closed to CMAG station indicated new local fault potential,supported by the increasing earthquake activities in that region.However, this study is only able to identify the possible region of new local fault potential based on strain rates anomaly. In order to confirm and characterize the fault in more detail, a more comprehensive study to estimate fault locking depth is necessary. More detailed investigation and analysis from the study of geology and geophysics are needed to subtract the compression due to the Sunda subduction zone.
Author contribution
Retno Eka Yuni Purwaningsih: Investigation, Formal analysis,Validation, Writing - original draft, Adelia Sekarsari: Formal analysis, Validation, Tika Widya Sari: Formal analysis, Validation,Cecep Pratama: Conceptualization, Supervision, Writing - review& editing, Sidik Tri Wibowo: Resources, Data curation.
Con
flicts of interest
The authors declare that there is no conflicts of interest.
Acknowledgments
We are indebted to the anonymous reviewers and editors for constructive and valuable comments to improve this manuscript.Also,we thank the Geospatial Information Agency of Indonesia for providing GNSS observation.This study was partially supported by UGM’s Fund in the scheme of the RTA Project. Most figures were generated by the Generic Mapping Tools [36].
杂志排行
Geodesy and Geodynamics的其它文章
- Evolution of stress fields during the supercontinent cycle
- Adaptive neuro fuzzy inference system for predicting sub-daily Zenith Wet Delay
- Analysis of the common model error on velocity field under Colored noise model by GPS and InSAR: A case study in the Nepal and everest region
- Genetic Nelder-Mead neural network algorithm for fault parameter inversion using GPS data
- Dual threshold search method for asperity boundary determination based on geodetic and seismic catalog data
- Determination of altitudes of the three main Ecuadorian summits through GNSS positioning
