Corrosion protection investigations of carbon dots and polydopamine composite coating on magnesium alloy
2022-07-13ZhngChenGnJingGu
H.D.Zhng, A.Y.Chen,∗, B.Gn, H.Jing, L.J.Gu
a School of Material Science & Engineering, University of Shanghai for Science and Technology, Shanghai 200093, China
b Beijing Key Laboratory of Advanced High Temperature Materials, Central Iron and Steel Research Institute, Beijing 100081, China
Abstract
Keywords: Magnesium alloy; N-doped carbon dots; Particle size; Dopamine; Coating; Corrosion resistance.
1.Introduction
As a new class of zero dimensional graphene based materials, carbon dots (CDs) are recently developed with sizes below 100nm (mostly range from 3 to 20nm) [1–3].CDs contain abundant functional groups at the edges, such as hydroxyl, carbonyl and carboxyl groups [4,5], which make them highly water-soluble, relatively low bio-toxicity and high light stability [6-9].Besides the chemical groups,the particle size of CDs also influence the physical and chemical performances, especially, when the particle size is less than 10nm.For example, the photoluminescence (PL)spectrum of CDs shifts from blue to red with increasing particle size [10,11].Zhou et al.[12]synthesized CDs by using microwave-mediated method and separated them into three different sizes of 2, 3, and 5nm through size exclusion chromatography, and the photocatalytic degradation results show that the catalytic activity increases with the decrease of the particle size.However, the size effect of CDs on the other performances are seldom, especially on the corrosion performance as a protective coating.
Dopamine(DA)can be spontaneous aggregation in the material surface to form polydopamine(PDA)coating,which can effectively prevent the corrosion ion migration in the corrosion system.This characteristic of PDA is adopted to protect the substrates of metals, metal oxides, polymers, semiconductors and ceramics, etc.[13,14].Qian et al.[15]proved that PDA layer can not only control the release of corrosion inhibitor, but also act as a protective complex between chelating agent and corrosion product.Habibiyan et al.[16]provided a composite coating of an oxidative polymerization of dopamine on the graphene oxide (GO) framework and subsequent loading of zinc (II) corrosion inhibitors, which exhibited a rapid self-healing performance.Additionally, PDA has active reactivity due to the presence of reactive functionalgroups (hydroxyl and amine), which can promote a series of biochemical reactions to provide a strong guarantee for further surface modification.
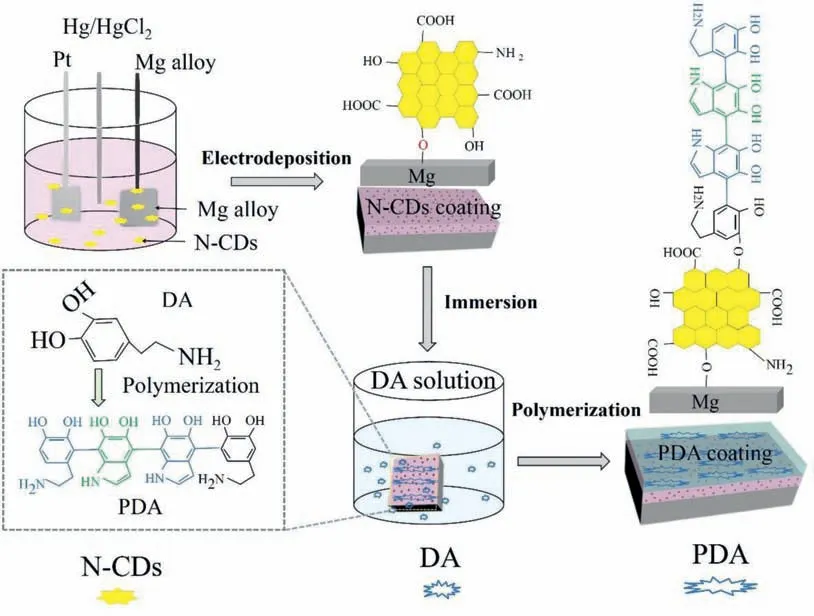
Fig.1.Schematic illustration of the preparation procedure of N–CDs/PDA composite coating on the Mg alloy.
Magnesium alloys are called green engineering materials due to their low density, high specific strength and stiffness,excellent machinability and recyclability [17–20], thereafter,widely developed in the computer components, automotive and aerospace industries[21–25].However,magnesium alloys have poor corrosion resistance, which severely limits the service life [26–28].In this study, we develop a nitrogen-doped CDs(N–CDs)/PDA composite coating onto the surface of Mg alloy,which exhibits an obvious enhancement of corrosion resistant and self-healing effect.Meanwhile, the effect of particle size of N–CDs on corrosion performance is also studied.The preparation process of the composite coating is illustrated in Fig.1, where the N–CDs coating is firstly electrodeposited on surface of the Mg alloy in the N–CDs solution, and then PDA coating is overlapped on the N–CDs coating by immersing in a DA solution.The microstructure and corrosion protection performance of the N–CDs/PDA composite coating are investigated systematically.
2.Experimental
2.1.Preparation of N-CDs/PDA composite coating
2.1.1.Preparation of N–CDs coating
N–CDs were synthesized via hydrothermal method [29].Specifically, 1.5g citric acid and 0.3g benzotriazole were dissolved in 40ml deionized water to prepare a clear solution.Then, the solution was transferred into 50ml Teflonlined autoclave and heated at 180 °C for 8h.The N–CDs were obtained by drying the final product at 80 °C.The asprepared N–CDs were separated by three types of molecular sieves with average pore sizes of 3.0, 6.0 and 8.0nm to obtain N–CDs with different particle sizes, which were labeled as N–CDs-3, N–CDs-6 and N–CDs-8.Magnesium alloy (AZ91D) with a mass fraction of A1 9.1, Zn 0.85, Mn 0.27(in wt.%),and balanced Mg was selected as the substrate material.The Mg alloy was cut into 20mm×15mm×10mm coupons for tests.After polished with SiC paper up to 2000 grit,they were ultrasonic cleaned in alcohol for 10min,rinsed with ethanol and then dried in a stream of cold air.The electrodeposition was performed in N–CDs solution (10μM) by using CHI660B electrochemical workstation under a constant current density of 100mA cm-2at 25 °C for 8min.A threeelectrode cell was used with a platinum sheet as a counter electrode, a saturated calomel electrode (SCE) as a reference electrode, and the Mg alloy sample as a working electrode.Finally,N–CDs coating was coated on the surface of Mg alloy after drying at 60 °C for 24h.
2.1.2.Preparation of the N-CDs/PDa composite coating
The Mg alloy sample with N–CDs coating was immersed in a DA solution (300mg DA, 40ml DI) at 60 °C for 2h,and then dried in an oven at 60 °C for 24h to obtain an N–CDs/PDA composite coating.
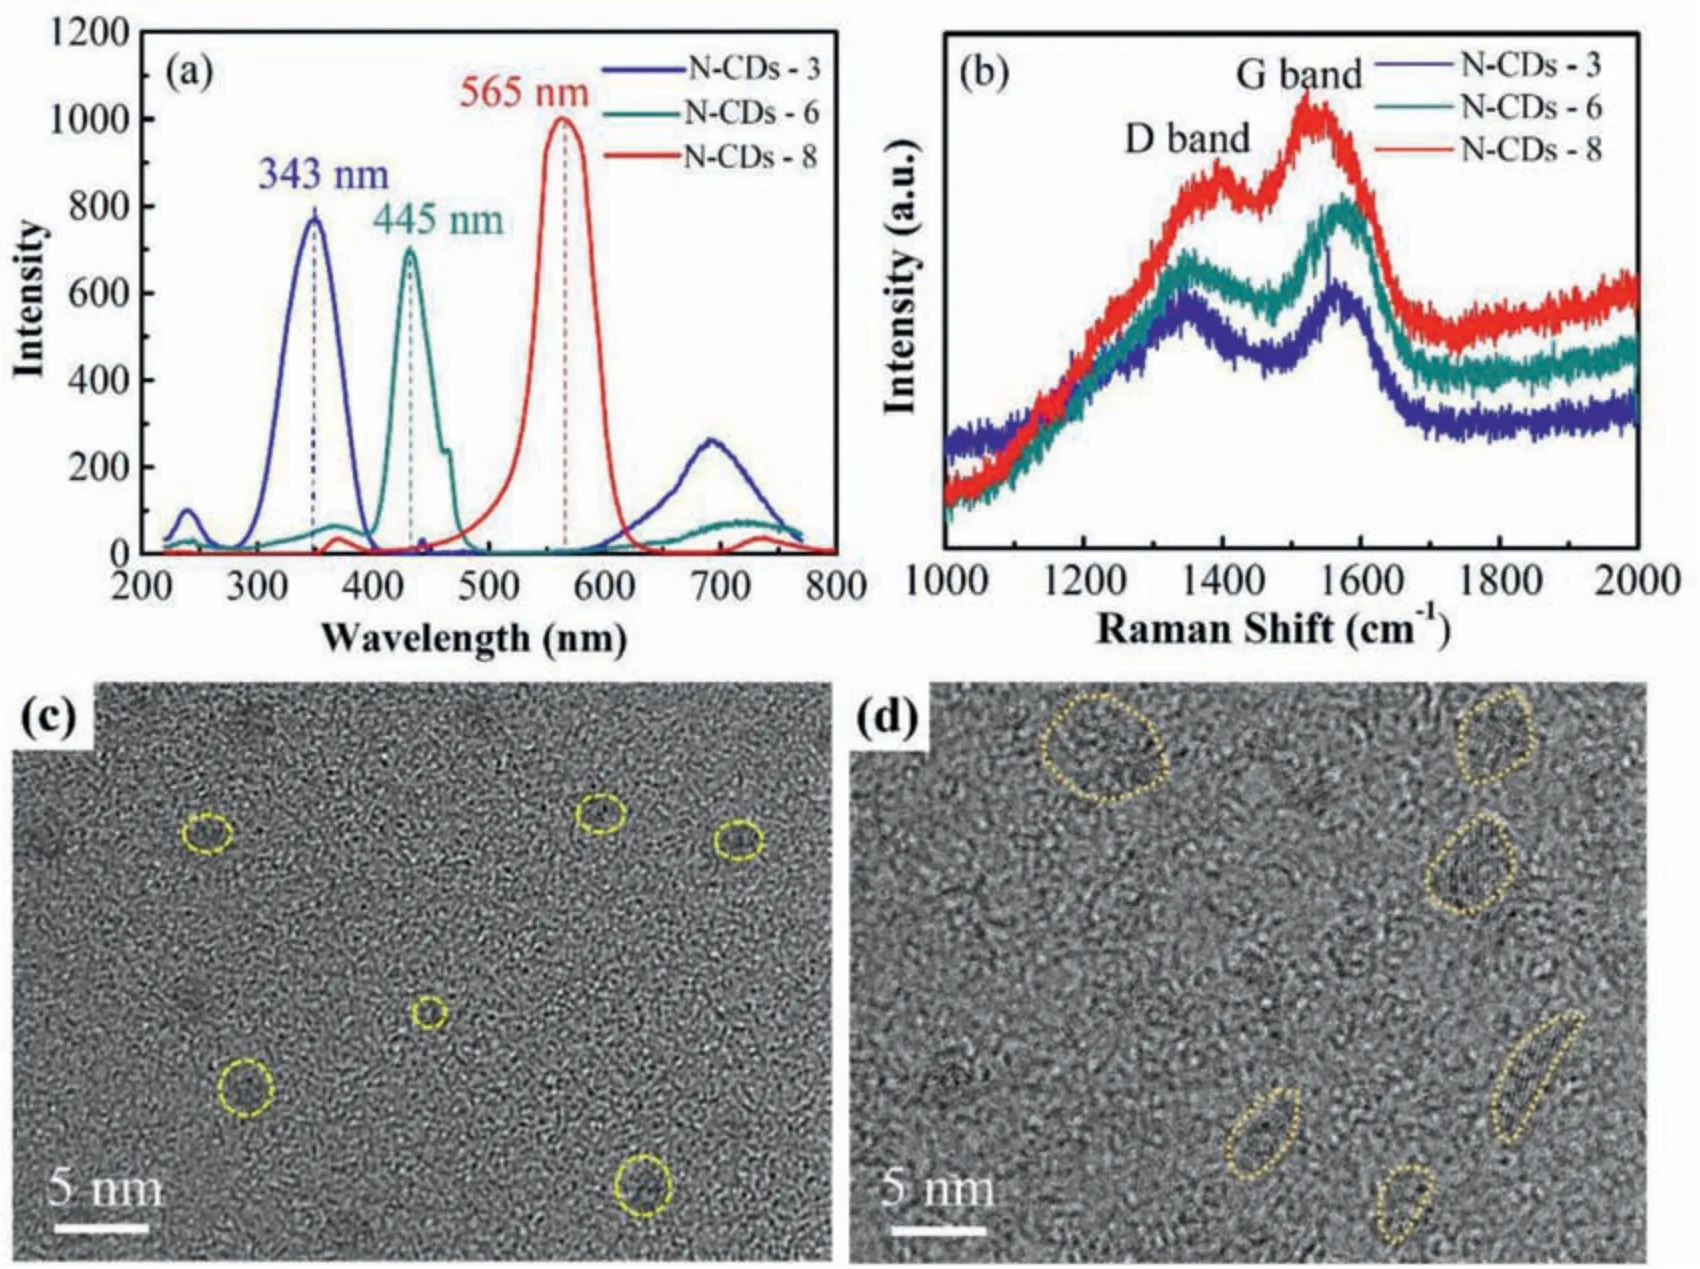
Fig.2.Microstructure of the N–CDs.(a) PL spectra; (b) Raman spectra; (c,d) TEM images of the N–CDs-3 and N–CDs-8, respectively.
2.2.Microstructural characterization
PL spectroscopy was performed using a Shimadzu RF-5301 fluorescence spectrophotometer.Raman scattering spectra were obtained on a Horiba Jobin Yvon HR800 spectrometer at 532nm.Microstructure observations of the coatings were carried out by transmission electron microscopy(TEM, Tecnai G2F20).The surface morphologies before and after the corrosion tests were observed by scanning electron microscopy (SEM, FEI Quanta450).The specimens for the cross-sectional SEM observations were prepared by a precision cutting machine staring from the side of Mg substrate.The layer thickness of the specimens were the average data of the four points.X-ray diffraction (XRD) spectrum was recorded using Bruker D8 advanced with Cu Karadiation at a range of 20 °–80 ° Surface chemical state of the coating was analyzed by X-ray photoelectron spectroscopy (XPS) with monochromatic Al Karadiation using a ThermoFisher-250XI X-ray electron spectrometer.
2.3.Corrosion test
2.3.1.Electrochemical measurement
The open circuit potential (OCP) was determined by Shanghai Chenhua Electrochemical Workstation with a threeelectrode cell, where the reference electrode was SCE, the counter electrode was a platinum sheet, and the working electrode was the Mg alloy sample.The corrosive solution is 3.5% (wt.%) NaCl.The initial potential to OCP was set to-2.0V and the final potential to 0V.Tafel polarization curve test was performed at a scan rate of 2mV s-1in a range of-2 - 0 V.Electrochemical impedance spectroscopy (EIS)measurements were performed at a sinusoidal potential signal of 5mV amplitude over a frequency range from 100kHz to 10 mHz relative to the OCP.Three specimens were prepared for all the electrochemical corrosion test.
2.3.2.Salt spray test
The salt spray test is conducted in DI solution containing 5wt.% NaCl in accordance with ASTM-B117 standard [30].The temperature of the spray solution is 35 °C, and the settling rate is between 1 and 2ml / 80 cm2·h under a humidity of 95%.The samples were subjected to a salt spray test of 4h.The surface morphologies of the corroded samples were observed by SEM after washed by distilled water.
2.3.3.Self-healing test
The self-healing performance of the coating was tested by scratching the coating surface with a cross-stitched shape.The damaged samples were immersed into deionized water at room temperature for different periods (0, 7, 14h), and the surface morphologies of the scratches were observed by SEM.
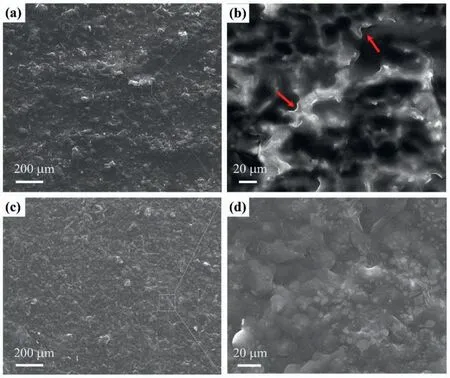
Fig.3.SEM images of the N–CDs-8 coating (a, b) and N–CDs-8/PDA composite coating (c, d).(b) and (d) are the magnifications of the rectangular zones in (a) and (b), respectively.
3.Results and discussion
3.1.Microstructure of N–CDs and N-CDs/PDA coatings
3.1.1.Microstructure of N–CDs
The PL spectra of N–CDs-3, N–CDs-6 and N–CDs-8 solution are shown in Fig.2a,where the PL emission wavelengths of the three specimens are 343, 445, and 565nm, respectively, indicating that the PL emission wavelength gradually increases as the particle size increases.The Raman spectra of all the N–CDs show two peaks at 1337 and 1556 cm-1(Fig.2b), which are D and G bands, respectively.The intensity ratio of D-band to G-band (ID/IG) decreases with increasing particle size, and the ID/IGof N–CDs-8 is approximately 0.91.The lower ID/IGvalue indicates that the crystallinity of N–CDs-8 is better [31].The TEM image of N–CDs-3 shows quasi-spherical nanoparticles with a size of 3nm (in Fig.2c),while that of N–CDs-8 displays an irregular shape with a particle size of 3–8nm (in Fig.2d).
3.1.2.Microstructure of N–CDs and N-CDs/PDA coatings
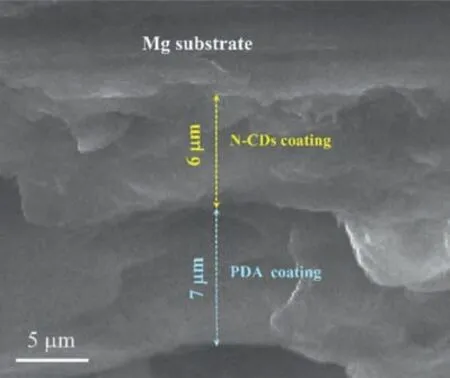
Fig.4.Cross-sectional SEM morphology of the N–CDs-8/PDA composite coating.
The N–CDs-8 coating has a uniformed surface, as shown in Fig.3a.An enlarged view shows a rough morphology with convex pits and micro-cracks, as indicated by arrows in Fig.3b.The surface of the N–CDs-8/PDA composite coating shows a relatively low roughness (Fig.3c), and the localized magnification, as shown in Fig.3d, exhibits a flat surface,and the original micro-cracks or pits are filled in by PDA.The cross-sectional morphology of the N–CDs-8/PDA composite coating is presented in Fig.4, where the thickness of the N–CDs-8 layer is 6.1 μm and that of the PDA layer is 7.3 μm.Correspondingly, the cross-sectional morphology of theN–CDs-8 specimen is shown in Supplementary Figure S1a,where the layer thickness of N–CDs-8 coating is 6.3 μm.The statistic results of the layer thickness of N–CDs-8/PDA specimen at different positions are provided in Supplementary Figure S1c, where the average layer thickness of the N–CDs-8 coating is 6.0±0.5 μm, and that of the PDA coating is 7.0±1 μm.

Fig.5.TEM images of the N–CDs-8 coating (a, b) and N–CDs-8/PDA composite coating (c, d).
The detailed microstructure of N–CDs-8 coating peeled from the Mg substrate is analyzed by TEM, as shown in Fig.5a and b.Lots of sphere-like particles are observed on the film, as indicated by circles in Fig.5a, where the particle sizes are 5–50nm.The lattice spacing of the N–CD particle is 0.255nm, corresponding to the (11¯20)crystal plane of graphene[11],as displayed in Fig.5b.The TEM image of the peeled N–CDs-8/PDA composite coating shows that the PDA film contains some N–CDs fragments, as circled in Fig.5c,and the debris of the N–CDs film exhibits an irregular shape,as shown in the magnification of Fig.5d.
XPS spectra are used to further analyze the surface chemical structure and element content of N–CDs-8, N–CDs-8 coating and N–CDs-8/PDA composite coating, as shown in Fig.6.In the N–CDs survey spectrum, the chemical compositions of the as-prepared N–CDs are composed of C, N,and O elements, where the C 1s, N 1s, and O 1s are at 284.6, 399.6, and 531.4eV, respectively [32,33], as shown in Fig.6a1.Compared with the N–CDs specimen, the C and O elements are the major constituents in the N–CDs-8 coating,while the N element is very seldom (Fig.6a2).Additionally,a few Mg 1s at 1304.1eV and Al 2p at 87.0eV are detected,as shown in Supplementary Figure S2, where the oxides and hydroxides of Mg and Al are fitted, respectively.These observations are consistent with the deconvolution analysis of the O 1s of the N–CDs-8 coating (Fig.6c2).The formation of these compounds are derived from the diffusion of Al and Mg atoms into the N–CDs-8 coating during electrodeposition [34].Notably, the C=O and COOH peaks can not be fitted in the N–CDs-8 coating (Fig.6b2), indicating that the chemical groups of COOH and C=O at the edges of N–CDs(Fig.6a1) might be reacted and consumed during the electrodeposition process.The N–CDs-8/PDA composite coating mainly contains C atoms, and a few O and N atoms, as given in Fig.6a3.Compared the C 1s peaks of N–CDs-8, N–CDs-8 coating, and N–CDs-8/PDA composite coating (Fig.6b1-b3),only the N–CDs-8 shows a slight smaller binding energy of C element (284.5eV), which can be attributed to the edge effect from chemical groups (-COOH and C=O).Relative to the O 1s spectrum of the original N–CDs-8 (Fig.6c1), the C–O bond exhibits a higher binding energy due to the formation of oxides and hydroxides of the Mg and Al (Fig.6c2).Correspondingly, the PDA surface shows a simple C–O group,as shown in Fig.6c3.
The element contents of N–CDs-8, N–CDs-8 coating, and N–CDs-8/PDA composite coating are listed in Table 1, where the C content significantly increases from 53.9% to 91.2%,and to 97.5% in the three specimens.Correspondingly, the O content decreases from 36.0% (N–CDs-8) to 6.2% (N–CDs-8 coating), and to 1.6% (N–CDs-8/PDA composite coating),showing the oxygen-containing chemical groups, such as hydroxyl and carboxyl groups, are obviously reduced in the coated specimens.The N contents of the three specimens also exhibit the same change of the O element.Besides the high atomic fraction of C (91.2%), a few Mg and Al atoms are also detected in the N–CDs-8 coating, where the Mg and Al contents are 0.4% and 1.2%, respectively.According to the XPS results (Figs.6c2, Table 1, Supplementary Figure S2),the Mg and Al atoms are diffused into the N–CD coating to form new chemical bonds during the electrodeposition.Thus,the interface between the N–CDs coating and Mg substrate is well bonded, which also confirmed by the scotch pull-off test(see the details in Supplementary Figure S3).The Supplementary Figure S3a and b show that the surface of N–CDs-8/PDA composite coating remains a very similar morphology before and after the tape peeling test, and no obvious exfoliated debris and fall-off zones are found on the tape (left in Supplementary Figure S3b)and scotch zones(right in Supplementary Figure S3b), indicating a strong interface adhesion between the coating and Mg substrate.

Table 1Element contents of N–CDs-8, N–CDs-8 coating, and N–CDs-8/PDA composite coating estimated from the XPS results.
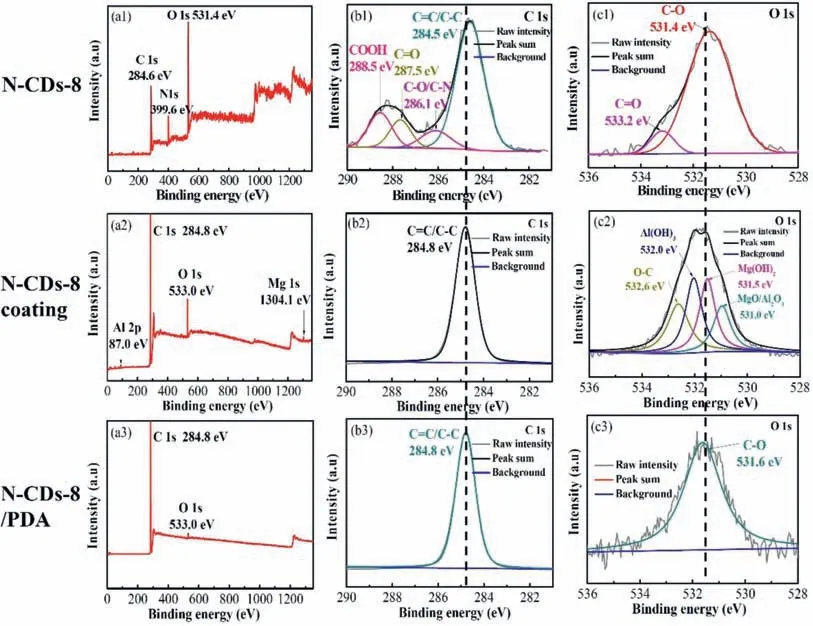
Fig.6.XPS spectra of the N–CDs-8, N–CDs-8 coating, and N–CDs-8/PDA composite coating.(a1-a3) Survey spectrum; (b1-b3) C 1s; (c1-c3) O 1s.
3.2.Corrosion protection performance
3.2.1.Electrochemical corrosion
Fig.7a shows the OCP curves of the bare AZ91D Mg alloy, N–CDs-3 coating, N–CDs-6 coating, N–CDs-8 coating and N–CDs-8/PDA composite coating in 3.5wt.% NaCl solution.The OCP of the samples are ranked in decreasing order as following: N–CDs-8/PDA composite coating (-1.38V)>N–CDs-8 coating (-1.43V)> N–CDs-6 coating (-1.48V)>N–CDs-3 coating (-1.53V)>Mg substrate (-1.59V), indicating that all the N–CDs coatings and the N–CDs/PDA composite coating can enhance the corrosion resistance of Mg alloy.The potentiodynamic polarization tests show that theEcorrof Mg substrate, N–CDs-3 coating, N–CDs-6 coating, N–CDs-8 coating and N–CDs-8/PDA composite coating are -1.53, -1.42, -1.36, -1.32, -1.27V (vs.SCE), respectively, as shown in Fig.7b and Table 2.The other fitted parameters obtained from the Tafel curves of the five samples are also given in Table 2.Among three types of the N–CDs coatings, theIcorrdecreases significantly with the increase of particle size of N–CDs,and the N–CDs-8 coating displays the lowestIcorr(1.7×10⁻⁶A·cm-2), nearly two orders of magnitude smaller than that of the Mg alloy substrate (4.1×10⁻⁴A·cm-2).TheIcorrof the N–CDs-8/PDA composite coating is 1.6×10⁻⁷A·cm-2, lower than that of the N–CDs-8 coating.

Table 2Corrosion potential and corrosion current density of different samples from polarization curves.
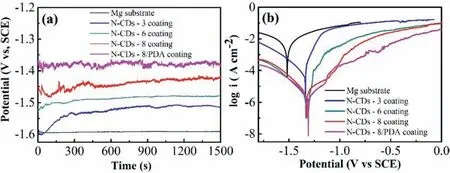
Fig.7.OCP curves (a) and polarization curves (b) of the bare Mg alloy, N–CDs coatings, and N–CDs-8/PDA composite coating in 3.5wt.% NaCl.

Fig.8.EIS results of the different samples.(a) and (b) Nyquist plots; (c) and (d) Bode plots log Z mod and phase angle vs.log f, respectively.The insets in(a, b) are the EC models fitted for the N–CDs coatings and N–CDs-8/PDA composite coating, respectively.
The Nyquist diagram of the different specimens are shown in Fig.8a.The bare Mg alloy, N–CDs-3, N–CDs-6, N–CDs-8 coatings exhibit a similar semicircular shape.The semicircle of each N–CDs coating is larger than that of the bare Mg alloy, and the radium increases with the increase of particle sizes of N–CDs.More interesting, the N–CDs-8/PDA coating shows a much larger semicircle than the N–CDs coatings, as given in Fig.8b.The fitted equivalent circuit (EC)model from the Nyquist curves of the bare Mg alloy andthe N–CDs coatings is inserted in Fig.8a, while that of the N–CDs-8/PDA composite coating is given in Fig.8b.In the EC model, theRsis the solution resistance,R1is the charge transfer resistance of pitting corrosion,Rctis the charge transfer resistance at the metal/water solution interface,Rcis used to describe the coating resistance [35,36].The constant phase component (CPE) represents double-layer capacitance [37].The low-frequency inductive loop, characterized byR1andL, represents the onset of pitting corrosion of the Mg substrate and N–CDs coatings.The fitted parameters are listed in Table 3.The corrosion resistance of N–CDs coatings are obviously enhanced due to the smaller capacitance loop.For example, the CPE1of the N–CDs-8 is 2.0×10⁻⁶Ω-1·sn·cm-2,nearly two orders of magnitude smaller than that of the bare Mg alloy (1.1×10⁻⁴Ω-1·sn·cm-2), as shown in Table 3.The inductive character of the N–CDs-8/PDA coating cannot be determined (the inset in Fig.8b), indicating that pitting corrosion is effectively inhibited.The largerRctvalue indicates a longer diffusion path of ions from the aqueous solution to the metal matrix, and thereafter a lower corrosion rate.TheRctof the N–CDs-8 coating is 750.9Ω·cm2, much larger than that of the bare Mg alloy (29.9Ω·cm2), and theRsis 33.6Ω·cm2,also larger than that of the bare Mg alloy (10.4Ω·cm2), indicating that the N–CDs coating can effectively inhibit the diffusion of corrosive Cl-ions to the Mg surface.The products of Mg(OH)2in N–CDs coatings can be dissolved by the adsorbed Cl-and transformed into soluble MgCl2, which destroys the compactness of the surface passivation layer [38].However, the PDA coating can seal Mg(OH)2on the N–CDs and make the coating more stable and longer-term protection,resulting in a significant improvement of corrosion resistance.Correspondingly,the N–CDs-8/PDA shows a relative largerRs(181.2Ω·cm2) than the N–CDs-8 (33.6Ω·cm2).Fig.8c and d are the Bode diagrams of the N–CDs and N–CDs-8/PDA coatings, where the N–CDs-8/PDA coating exhibits the highest modulus, two orders of magnitude than the bare Mg alloy.Meanwhile, the phase angle of N–CDs-8/PDA composite coating has wider range than other samples (in Fig.8d), indicating a good shielding property.

Table 3Fitted parameters from the EC model of different coatings.

Fig.9.Surface morphologies of Mg substrate, N–CDs-8 coating, N–CDs-8/PDA composite coating before and after salt spray test.(a-c) are the macroscopic pictures of Mg substrate, N–CDs-8 coating, N–CDs-8/PDA composite coating before (left) and after (right) spray test.(a1-c1) and (a2-c2) are the SEM images,showing the surface morphologies before and after salt spray test of 4h.
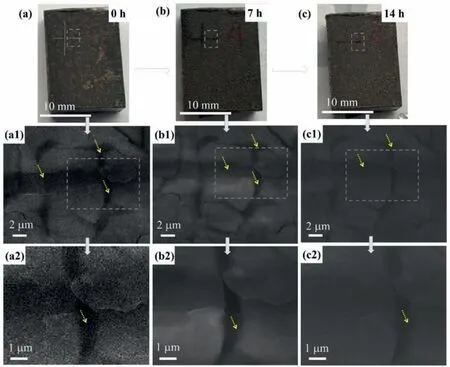
Fig.10.Surface morphologies of N–CDs-8 /PDA composite coating after immersing in deionized water with different times.(a-c) 0, 7 and 14h; (a1-c1) are the corresponding magnifications of the rectangular zones in (a-c).(a2-c2) are the corresponding magnifications of the rectangular zones in (a1-c1), respectively.
3.2.2.Salt spray corrosion
The macroscopic morphologies of the bare Mg alloy,N–CDs-8 coating, and N–CDs-8/PDA composite coating before and after salt spray test are shown in Fig.9a-c.The bare Mg alloy exhibits a rough surface and is completely covered by corrosive products, while N–CDs-8 and N–CDs-8/PDA specimens show partial corrosion.Compared with the SEM images before and after spray test, many obvious cracks are observed on the surface of bare Mg alloy, as indicated by arrows in Fig.9a2.As for the N–CDs coating, cracks also occur, but with smaller size and narrower width (in Fig.9b2).However, the N–CDs-8/PDA specimen displays a relative flat and compact surface, where a few micro-cracks are formed(Fig.9c2).The corrosion rates of bare Mg alloy, N–CDs-8 coating, and N–CDs-8/PDA composite coating are estimated to be 97.4, 48.2, and 18.6mm a-1after salt spray of 4h (see Supplementary Table S1).These observations explain that the addition of PDA coating on the surface of N–CDs coating can further improve pitting corrosion.
3.2.3.Self-healing performance
Fig.10 shows the surface morphology of the N–CDs-8/PDA composite coating after immersion in deionized water for different durations.Figs.10a, b and c are topographies of the cross-scratches of the coating after soaking for 0, 7, and 14h in deionized water.Figs.10a2, b2, and c2 are enlarged views of the corresponding zones in Fig.10a1,b1,and c1,respectively.In Fig.10a1, the fresh cross-scratch on the coating is large and deep,the rupture is obvious.After soaking for 7h,the depth of the coating is shallow, and the scratch is obviously filled with some new products, as shown in Fig.10b1.The magnification of the crack shows that new filler covers the deep crack, as indicated by the arrow in Fig.10b2,indicating that the scratched coating achieves a self-healing effect.After soaking for 14h (Fig.10c), the scratches are faintly, and relative flat crack is observed.Although the deep cracks are not full of the PDA, the left scratches are still getting shallow, as indicated by arrow in Fig.10c2.Compared with the bare Mg alloy (see Supplementary Figure S4),the self-healing effect of the N–CDs-8/PDA composite coating is remarkable.This effect originates from the diffusion and extension of PDA from the surrounding surface [15].Asobserved above, the composite structures of N–CDs and PDA coatings jointly enhance the corrosion resistance of Mg alloy.The PDA coating can not only further enhance the corrosion resistance, but also induce self-healing performance.The N–CDs coating acts as a transitional layer to chemically bonds with the Mg substrate and PDA coating, meanwhile,protects the Mg substrate by the formation of planar graphene structures to isolate the corrosive media.
4.Conclusion
The N–CDs and N–CDs-8/PDA coatings were prepared on magnesium alloy (AZ91D) by combining the electrodeposition method with solvent chemical reaction.The size effect of the N–CDs on the corrosion performance is investigated,and a self-healing effect of the PDA coating is observed on surface of the N–CDs/PDA composite coating.The following conclusions can be drawn from this work:
1.N–CDs coatings were electrodeposited on the Mg alloy under a constant current density of 100mA cm-2.The corrosion resistance of the N–CDs coating is enhanced with increasing particle size.The OCP of the optimal N–CDs-8 coating is -1.32V, much higher than that of the bare Mg alloy (-1.53V).
2.The N–CDs-8/PDA composite coating is composed of N–CDs-8 coating of 6.0 μm thick and PDA coating of 7.0 μm thick.The corrosion resistance of the N–CDs-8/PDA is further improved in NaCl solution, where the corrosion circuit density is 1.6×10⁻⁷A cm-2, far lower than those of the N–CDs-8 coating (1.7×10⁻⁶A cm-2,) and Mg alloy substrate (4.1×10⁻⁴A cm-2).
3.The salt spray test shows that the N–CDs-8/PDA composite coating has the best resistance to pitting corrosion,representing by the lowest corrosion rate compared with the N–CDs-8 coating and bare Mg substrate.Furthermore, the PDA coating on the surface of N–CDs-8 coating can produce self-healing performance.After immersion in deionized water for 7h, the cross-scratches on the N–CDs-8/PDA coating are filled with the PDA.
Acknowledgments
We thank the National Natural Science Foundation of China (grants 51771121) and the fund provided by Science and Technology Committee of Shanghai Municipality(20ZR1437500).Prof.Chen gratefully acknowledges the financial supports from Shanghai Municipal Education Commission (2019-01-07-00-07-E00015).
杂志排行
Journal of Magnesium and Alloys的其它文章
- Effect of B4C on strength coefficient, cold deformation and work hardening exponent characteristics of Mg composites
- Understanding pitting corrosion behavior of AZ91 alloy and its MAO coating in 3.5% NaCl solution by cyclic potentiodynamic polarization
- Active corrosion protection of phosphate loaded PEO/LDHs composite coatings: SIET study
- The detailed corrosion performance of bioresorbable Mg-0.8Ca alloy in physiological solutions
- Improving the electrochemical stability of AZ31 Mg alloy in a 3.5wt.%NaCl solution via the surface functionalization of plasma electrolytic oxidation coating
- Analysis of the corrosion performance of binder jet additive manufactured magnesium alloys for biomedical applications
