Unveiling the Underlying Mechanism of Transition Metal Atoms Anchored Square Tetracyanoquinodimethane Monolayers as Electrocatalysts for N2 Fixation
2022-07-04ShengyaoLvChunxiangHuangGuoliangLiandLimingYang
Shengyao Lv , Chunxiang Huang, Guoliang Li*, and Liming Yang*
1. Introduction
Conversion of dinitrogen(N2)to ammonia(NH3)is one of the important processes from the perspectives of agriculture, industry, and human development. NH3is the critical ingredient for the fertilizer production and the synthesis of nucleotides, amino acids, and some other main organic compounds.[1–3]NH3is also a potential energy carrier and transportation fuel.[4,5]In the past century, NH3has always been synthesized by N2and H2using the industrial Haber-Bosch(HB)approach.[6]However, N2is difficult to be utilized due to its extreme stability and large amount of energy will be required to destroy its inert triple N≡N bond. Traditional Haber-Bosch process operates at high temperature and pressure and consumes the world energy usage of approximately 2%.[7,8]Furthermore, the HB process emits a large amount of CO2and causes greenhouse gas effects.[9]Thus, it is highly desirable to design and develop new routes for N2reduction to NH3at mild conditions.
Electrocatalytic N2fixation is an environmentfriendly process and has received widespread concern.Green,efficient,and sustainable electrocatalytic N2reduction reaction(NRR)provides a bright prospect for N2fixation and NH3synthesis,because it can reduce the energy for breaking the N≡N bond to a certain extent.[10–12]In the electrochemical NRR process, the NH3production efficiency can be improved by choosing effective catalyst,controlling the operating potential,pH,and electrolyte.[13,14]There is no doubt that highly efficient catalysts, which can increase the reaction rate,enhance the selectivity,and reduce energy consumption,are the core of electrocatalytic NRR process.[15–26]
2D materials are an important platform to design novel NRR catalysts.[21,24–28]As a unique ligand, 7,7,8,8-tetracyanoquinodimethane(TCNQ) has a high electron affinity of 3.383 eV,[29]which makes it a strong organic electron acceptor and an ideal component for the construction and synthesis of metal-organic semiconductor charge-transfer materials.Indeed,a large number of TCNQ-based complexes have been synthesized. Recent experimentally fabricated 2D square Ni- and Mn-TCNQ materials and their intriguing physicochemical properties on Au(111)and Ag(100)surfaces attracted our attention.[30,31]Based on our experience, 2D square TM-TCNQ monolayers (here labeled as TMsTCNQ) might be potential single-atom catalysts (SACs) for electrochemical NRR. Indeed, some TM-sTCNQ materials have been reported for electrochemical oxygen evolution reaction (OER).[32–34]Inspired by these intriguing properties and promising progress and applications of the TM-TCNQ materials, we carried out a comprehensive investigation on the electrochemical mechanism of NRR on 3d, 4d, 5d TM atoms embedded in square TCNQ networks by high-throughput screenings and first-principals calculations. Considering the computational costs and the purpose of finding a promising NRR catalyst, our research follows the following steps. First, the TM-sTCNQ monolayer was subjected to preliminary high-throughput screening, and the TMsTCNQ SAC with good electrocatalytic NRR performance was selected.Then,comprehensive studies were carried out on the whole electrocatalytic NRR process,the geometries,stabilities,electronic properties,and magnetic moments for the selected TM-sTCNQ monolayers.
2. Computational Details
All the computations were performed with Vienna Ab Initio Simulation Package (VASP)[35]and the spin-polarized density functional theory (DFT) method was used. The projector-augmented wave(PAW)[36]pseudopotentials were to employed describe the ionelectron interactions. The exchange-correlation functional of Perdew−Burke−Ernzerhof (PBE) with generalized gradient approximation (GGA) was utilized to describe the electron-electron interactions.[37]Considering the influence of possible dispersion interactions on Gibbs free energy, the dispersion corrected DFT-D3 method was employed.[38]In order to ensure the computational accuracy, the kinetic cutoff energy of 450 eV was set for the plane wave function, and the convergence threshold for the energy and force in structural optimization process was 10−5eV and 0.02 eV ˚A−1, respectively. To prevent the interaction between adjacent periodic atoms, a vacuum height of over 15 ˚A was used on the z axis. For structural optimizations and electronic structure calculations, the Brillouin area used Γ-centered Monkhorst−Pack (MP)k-point grids of 3 × 3 × 1 and 7 × 7 × 1, respectively. To further evaluate the thermodynamic stability of TM-sTCNQ, ab initio molecular dynamics (AIMD) simulations were performed at a temperature of 500 K for a 10 ps time period with the step being 2 fs. A large number of relevant experiences have shown that the effect of solvation on NRR is ∼0.1 eV.[39]Due to its large computational costs, the solvation effects have not been considered in the present research.[24,40,41]
A single TM atom was anchored to the crystal surface of the sTCNQ film to simulate SAC, and the binding energy (Eb) between TM and substrate can be obtained by Equation (1):

with ETM-sTCNQ, ETM, and EsTCNQbeing the energies of the TMsTCNQ unit, the TM atom, and the sTCNQ unit, respectively.
The cohesive energy (Ec) of the TM atoms was calculated using Equation (2):
with ETM(bulk), ETM(single), and n being the energy of a bulk metal,a TM atom in vacuum, and the number of TM atoms in the bulk section, respectively.
The Gibbs free energy change(ΔG)at each elementary step was calculated by Equation (3) based on the computational hydrogen electrode(CHE)model:[42]
with ΔE being the energy difference between the product and reactant;∫CpdT being the enthalpy correction (enthalpy correction improves the accuracy of computational results by 0.03–0.11 eV); EZPEand S being the zeropoint energies and entropies,respectively,given by vibrational frequency computations;T = 298.15 K herein.When calculating the frequencies, we fixed the TM-sTCNQ catalytic material, and only the adsorbed chemical species were allowed to vibrate.The EZPE,Cp,and S values for small gas molecules (H2, N2, NH3)come from the NIST database.[43]U is the required applied potential. ΔGpHis the correction of H+free energy with concentration,ΔGpH= 2.303 × kB× T × pH,in which kBis the Boltzmann constant, and pH is set to 0 in the present research.
The overpotential (η) equals to the difference between Uequilibrium(the equilibrium potential) and Uonset(the onset potential),η = Uequilibrium−Uonset, where Uonset= −ΔGmax/e and Uequilibrium= 0.17 V for NRR.

Figure 1. a) The structure of the TM-sTCNQ monolayer, with the unit cell of TM-sTCNQ represented by the blue dotted square. N2 is adsorbed on TM-sTCNQ by end-on and side-on forms, as shown by the pink dashed cycles above. Green, brown, light blue, and light pink balls indicate the TM, C, N, and H atoms,respectively.Schematic diagram of adsorbed N2 bonding to the TM atom on TM-sTCNQ by b)end-on and c)side-on forms.
3. Results and Discussion
Before starting the electrocatalyst screening and mechanism investigation, we first analyze the topology motif and structures of 2D square TM atoms embedded TCNQ networks (i.e., TM-sTCNQ). Following the structures reported experimentally,[30,31]we construct the TM-sTCNQ monolayer via Materials Studio. The unit cell of 2D TM-sTCNQ monolayer (the blue dash square in the left part of Figure 1a) includes two TM atoms and two TCNQ molecules with the chemical composition as(C12H4N4TM)2and the nominal TM:TCNQ stoichiometry is 1:1.The central TM atom is coordinated by four TCNQ in a “windmill” form and extended to the 2D sheet with the same coordination pattern. All TM atoms are equivalent and all TCNQ molecules are also equivalent in 2D TM-sTCNQ monolayers. For ease of discussion and analysis, the TM atoms in the unit cell can be “formally” distinguished by the unit cell frame as the central TM atom and the four TM atoms on the frame border even though they are equivalent. The central TM atom is solely belonged to the unit cell,whereas the four TM atoms on the frame border are equally shared by four adjacent unit cells, thus contribute only one(4 × 1/4 = 1) TM atom to the unit cell. Each TCNQ molecule is shared by two adjacent unit cells, thus, totally, two (4 × 1/2 = 2)TCNQ molecules belong to the unit cell.
Now, we turn to discuss the N2adsorption on the TM-sTCNQ monolayer.Figure 1a shows the two adsorption modes,end-on and side-on, and Figure 1b,c give the orbital interactions between adsorbed N2and the active center TM atom of electrocatalysts TMsTCNQ. The empty TM-d orbitals can accept electrons from N2. At the same time, the filled TM-d orbital can provide electrons into the π*antibonding orbital of N2.Affected by the metal-ion type,coordination number, and steric effect, when the TM-sTCNQ monolayer adsorbs N2in side-on form, there may also be interactions between the π-bonding orbital of the N2molecule and the TM-d orbital(Figure 1c).This“acceptance-donation”interplay leads to the activation of adsorbed N2molecules.
All the optimized structures of the TM-sTCNQ monolayers are planar, except that the Au atoms in Au-sTCNQ are slightly out of the plane,as shown in Table S1. The Au atom and the TCNQ molecule in Au-sTCNQ have a two-coordinate structure, in agreement with related experimental results.[44]
3.1. Initial Selection of the TM-sTCNQ Electrocatalysts
Electrocatalytic NRR usually refers to a six proton-coupled electron transfer process (N2+ 6H++ 6e−→2NH3). The N2adsorption, the first protonation (*N2+ H++ e−→*N2H), and the last protonation(*NH2+ H++ e−→*NH3)steps are the three key steps for electrocatalytic NRR.The N2adsorption step determines whether NRR can launch spontaneously.
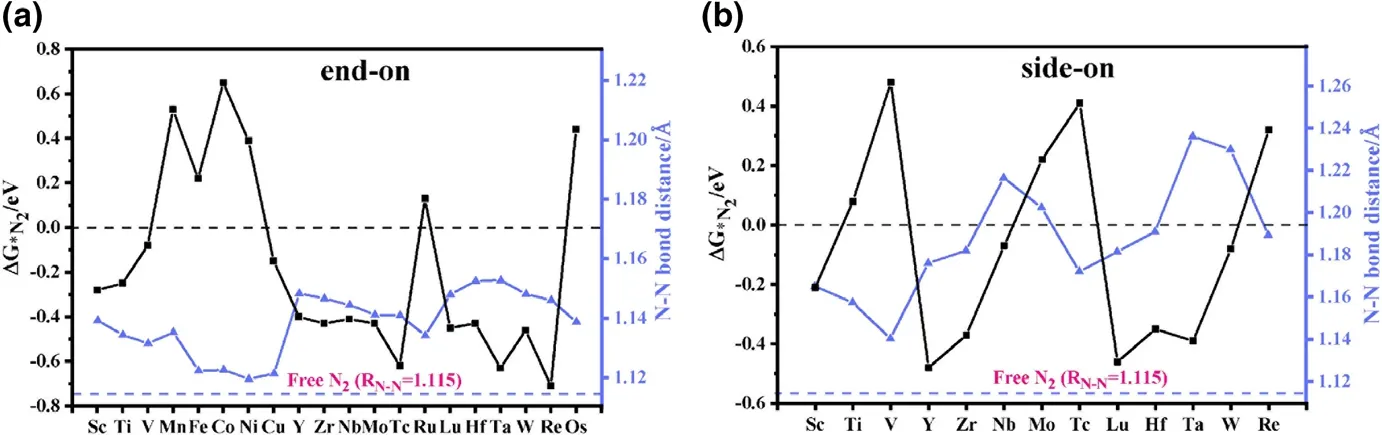
Figure 2. Gibbs free energy change ΔG*N2 and N≡N bond distance RN–N for N2 adsorbed on various TM-sTCNQ monolayers in a) end-on and b) side-on forms. The black line represents ΔG*N2, and the blue line represents the RN–N. Calculated values of ΔG*N2 and the RN–N in N2-TM-sTCNQ are listed in Table S3.
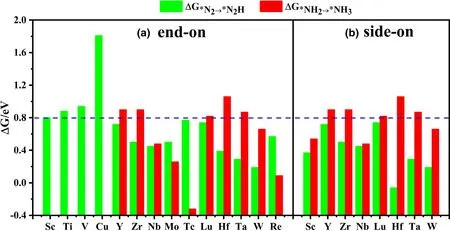
Figure 3. Gibbs free energy change ΔG*N2→*N2H and ΔG*NH2→*NH3 for N2 adsorbed on different TMsTCNQ monolayers in a) end-on and b) side-on forms. The green columns represent ΔG*N2→*N2H, and the red columns represent ΔG*NH2→*NH3. The ΔG*N2→*N2H and ΔG*NH2→*NH3 values are listed in Table S4.
3.1.1. N2Adsorption
The prerequisite for the occurrence of NRR on the TM-sTCNQ surface is that the TM-sTCNQ monolayers can effectively capture and activate N2molecules, N2+ * →*N2(* means the TM-sTCNQ monolayer). The free energy change for N2adsorption (ΔG*N2) and the extension of the N≡N bond distance (RN–N)are the basic standards to measure the catalytic ability of a material to the NRR process.In this article, we consider two common N2adsorption modes (Figure 1a and Figure S1): 1)end-on mode, in which N2is placed upright relative to the TM-sTCNQ monolayer with only one TM–N bond formed; 2) side-on mode,in which N2is parallelly placed on the TM-sTCNQ monolayer with both N atoms bonded to the TM active center. Considering 3d, 4d, 5d elements, 30 kinds of TM atoms,and two N2adsorption configurations, we have constructed 60 kinds of N2-TM-sTCNQ structures. Figure 2 shows the N2adsorption energies and the RN–Nchanges after N2is adsorbed on different TM-sTCNQ monolayers.Some attempted N2-TM-sTCNQ structures desorb N2during the structural optimizations(Table S2),indicating that they cannot adsorb N2spontaneously, and will not be discussed further. As shown in Figure 2, when TM =Sc,Ti,V,Cu,Y,Zr,Nb, Mo, Tc,Lu,Hf,Ta,W,and Re,and N2adsorbed in end-on form,ΔG*N2< 0; when TM = Sc, Y, Zr, Nb, Lu,Hf, Ta, and W, and N2adsorbed in side-on form, ΔG*N2< 0. ΔG*N2< 0 indicates the TM-sTCNQ monolayer can adsorb N2molecules spontaneously. Compared with the side-on modes, we find that TM-sTCNQ is more inclined to adsorb N2molecules with end-on modes because of its smaller steric hindrance.Compared with the bond distance of 1.115 ˚A in free N2molecule,the RN–Nin adsorbed N2increases,indicating that N2has been activated effectively, which is beneficial to subsequent N≡N cleavage and further NRR process.
3.1.2. The First and Last Protonation Steps of NRR
The first and last protonation steps are the two steps which may have the largest Gibbs free energy change(ΔGmax)among the NRR pathway and thus be the potential determining step (PDS), thus become the focus of this study.Based on the results above,we continue to explore the TM-sTCNQ monolayers with ΔG*N2< 0, as shown in Figure 2.Although there are many TM-sTCNQ monolayers that can capture and activate N2molecules,most of them cannot form*N2H or make*NH2stable. Using ΔG < 0.8 eV as a criterion,only the Nb-,Mo-,Tc-,W-,and Re-sTCNQ monolayers (N2adsorption in end-on form) and the Sc-, Nb-, and W-sTCNQ monolayers (N2adsorption in side-on form)show good NRR catalytic activity(Figure 3).
3.1.3. Hydrogen Evolution Reaction
The hydrogen evolution reaction (HER) is the main competitive reaction of electrocatalytic NRR.[39]The selectivity of the catalyst directly affects their catalytic performance for NRR. If protons preferentially occupy the TM active site of the TM-sTCNQ monolayers during the NRR process,the TM-sTCNQ monolayers cannot effectively capture N2molecules,and the NRR catalytic efficiency will be greatly reduced.So,good selectivity is very important for evaluating the performance of a catalyst. The competition between NRR and HER on the TM-sTCNQ monolayers can be compared by calculating ΔG*N2and ΔG*H, with ΔG*N2< ΔG*H(ΔG*N2is more negative) indicating that N2is more easily adsorbed on the TM-sTCNQ surface. As shown in Figure 4, for Nb-and Mo-sTCNQ,ΔG*N2is more negative than ΔG*H,so they have good selectivity for NRR. Thus, the Nb- and Mo-sTCNQ monolayers may be promising electrocatalysts for NRR.For Tc-sTCNQ,ΔG*N2and ΔG*Hare comparable though ΔG*His slightly more negative, and we will continue to study its electrocatalytic performance in depth.
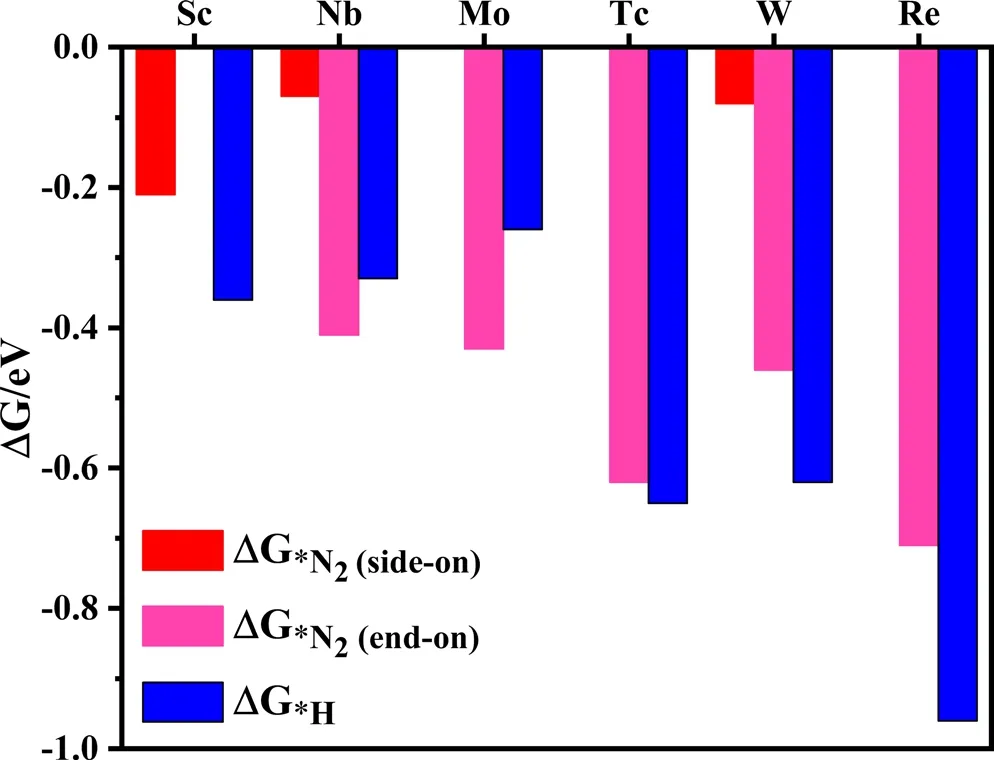
Figure 4. Gibbs free energy change ΔG*N2 and ΔG*H on different TMsTCNQ monolayers. According to the high-throughput screening results above, the N2 adsorption in end-on configuration is considered on the Nb-,Mo-, Tc-, W-, and Re-sTCNQ monolayers, and that in side-on configuration is considered on the Sc-, Nb-, and W-sTCNQ monolayers. The red, fuchsia,and blue colors represent ΔG*N2 (side-on), ΔG*N2 (end-on), and ΔG*H,respectively. The corresponding ΔG values are listed in Table S5.

Figure 5. A simplified diagram for the possible reaction paths of nitrogen reduction reaction (NRR).The distal, alternating, consecutive, enzymatic, and mixed pathways are shown in green, blue, dark purple, red, and light purple, respectively. For simplicity, the NRR path only presents the bonding relationship between adsorbed species and the active center TM atom.
3.2. Catalytic Mechanism for NRR on the TM-sTCNQ Electrocatalysts
During NRR, the N2molecules absorbed on electrocatalysts will be hydrogenated gradually by proton-coupled electron transfers, forming NRR intermediates adsorbed on the TM site,until each N2molecule is converted into two NH3molecules. Generally, the NRR process has four types of reaction pathways (Figure 5).When N2is adsorbed in end-on configuration,it has a distal or alternating pathway; when N2is adsorbed in side-on form, it has consecutive or enzymatic pathway. The distal and consecutive pathways are similar, in which the protonelectron pairs first attack one of the N atoms continuously,releasing one NH3,then attack the other N atom to generate the second NH3. On the contrary, in the alternating and enzymatic pathways, the proton-electron pairs alternately attack two N atoms of N2,and successively generate two NH3on the last two protonation steps.In addition to four commonly known pure reaction pathways above, we also consider the mixed pathways so as to comprehensively looking for the low onset potential paths. As shown in Figure 2, N2can be adsorbed spontaneously(ΔG*N2< 0) on Nb-sTCNQ in both side-on and end-on forms, while on Mo-sTCNQ and Tc-sTCNQ only in end-on form.Thus,in the following computations,only the NRR pathways following these N2-TM-sTCNQ intermediates are explored.
Figure 6 shows Gibbs free energy diagrams for NRR on the NbsTCNQ monolayer through various possible pathways.Through the distal pathway, for the N2capture and the first protonation steps, the ΔG*N2and ΔG*N2Hare −0.41 and 0.45 eV,respectively,and the N–N bond lengths are extended to 1.144 and 1.244 ˚A, respectively. The*N2H formation needs to overcome a small barrier.The next four protonation steps of NRR are all exothermic, with ΔG*N-NH2, ΔG*N,ΔG*NH, and ΔG*NH2being −0.54, −0.47, −0.96, and −0.05 eV,respectively. The last protonation step(*NH2+ H++ e−→*NH3) is the PDS, with the ΔGmaxbeing 0.48 eV. The release of NH3caused a slight upward slope(0.65 eV)of free energy.Thus,the NH3generated can be removed in a flowing N2environment,and the NRR recycle can be easily realized.

Figure 6. Gibbs free energy diagrams for nitrogen reduction reaction on Nb-sTCNQ through a) distal, b)alternating, c) distal-alternating, d) consecutive, and e) enzymatic pathways, at both zero and onset potentials. The black indicates the zero potential diagram, while the red shows the onset potential diagram. The two values involved in the PDS are highlighted in blue.
As shown in Figure 6b, in the alternating pathway, the N2adsorption and *N2H formation are the same as those in the distal pathway.The Gibbs free energy of the second protonation step still rises(ΔG*NH–NH= 0.50 eV), and the N–N bond length is elongated to 1.302 ˚A. For the *NH–NH + H++ e−→*NH–NH2and *NH–NH2+ H++ e−→*NH2–NH2steps, the free energy changes are−0.73 and 0.57 eV, respectively, and the N–N bond lengths are extended to 1.425 and 1.471 ˚A, respectively. The remaining steps are the same as the distal pathway. The PDS of the alternating pathway is*NH–NH2+ H++ e−→*NH2–NH2,with ΔGmaxbeing 0.57 eV.
Various possible distal-alternating mixed paths have also been considered. Figure 6c shows the optimal mixed path, where PDS is the*NH2+ H++ e−→*NH3step with onset potential equal to−0.48 V.In general,the Nb-sTCNQ still prefers to follow a distal path for NRR,when N2is adsorbed in end-on configuration.
In the consecutive and enzymatic pathways, N2is adsorbed on the Nb-sTCNQ monolayer in side-on form. In these two pathways, only the*N2→*N–NH*and *NH2→*NH3steps are endothermic,with ΔG*N–NH*and ΔG*NH3being 0.02 and 0.48 eV,respectively.The PDSs for these two pathways are both *NH2+ H++ e−→*NH3, with ΔGmax= 0.48 eV.Although the possibility of capturing N2on the NbsTCNQ monolayer in side-on form is lower (ΔG*N–N*= −0.07 eV)than that in end-on form,the consecutive and enzymatic pathways are very smooth for the NRR process. Thus, the Nb-sTCNQ monolayer is promising for the electrocatalytic NRR process.
The Mo-sTCNQ monolayer can also spontaneously adsorb N2(in end-on form), with ΔG*N2=−0.43 eV and RN–N=1.141 ˚A. As shown in Figure S2, the formation of *N–NH needs to overcome a barrier of 0.50 eV,and RN–Nfurther extends to 1.231 ˚A.In the distal pathway,the*N–NH →*N–NH2→*N →*NH →*NH2steps are all exothermic, with the free energy changes being −0.28, −0.84, −0.40,and −0.06 eV, respectively. The PDS is the*N–N + H++ e−→*N–NH step, with ΔGmax= 0.50 eV. Similarly, we explored the distal-alternating pathway on the MosTCNQ monolayer. The onset potential of the distal-alternating pathway is reduced to−0.50 V relative to −0.55 V of the alternating pathway. On the Mo-sTCNQ monolayer, the NH3desorption energy in the last step is only 0.38 eV, so NH3can be released quickly from the catalyst surface under onset potential.
For NRR on Tc-sTCNQ(Figure S3),the PDS is the *N2+ H++ e−→*N–NH step with Uonset= −0.77 V through distal, alternating and mixed pathways. The reaction process is similar to that on the Mo-sTCNQ monolayer.
We also analyzed the N–N distance changes along the NRR process on the Nb-,Mo-,and TcsTCNQ monolayers through different reaction pathways,with the results shown in Figures S4–S6.As NRR progresses,N–N gradually extends,vividly reflecting the process of gradual activation and reduction of N2.
The PDS determines the minimum applied potential (onset potential) required by NRR,Uonset= −ΔGmax/e. The smaller the negative onset potential, the smaller the overpotential and the barrier that needs to be overcome inthe reaction, which is more conducive to NRR. In this regard, after systematically exploring whole NRR processes on the Nb-, Mo-, and Tc-sTCNQ monolayers, the NRR PDSs through different reaction pathways on different catalysts are summarized and compared. As shown in Table 1, the NRR PDSs on the Nb-, Mo-, and Tc-sTCNQ monolayers are basically the first protonation step and the last protonation step, similar to previous research results. Thus, the first and last protonation steps of NRR are very important.

Table 1. The PDS and onset potential of NRR on the Nb-, Mo-, and TcsTCNQ monolayers through different reaction paths. The first protonation step (*N2 + H+ + e−→*N–NH) is marked in red, the last protonation step (*NH2 + H+ + e−→*NH3) is marked in cyan, and the remaining reaction steps are shown in black.
3.3. Origin of Catalytic Performance of TM-sTCNQ
To understand the relationship between the NRR catalytic performance of the TM-sTCNQ monolayers and their magnetic moments,the change of the NRR onset potentials with relation to the magnetic moments of TM-sTCNQ (TM = Nb, Mo, Tc) was shown in Figure S7. Similar trend was found between the onset potentials and the TM-sTCNQ magnetic moments. Strong interactions between the TM atoms and the sTCNQ monolayers make the TM-sTCNQ(TM = Nb, Mo, Tc) materials have strong magnetic moments,which promotes the charge transfer between the NRR intermediates and the substrate, thereby reducing the onset potential of NRR.We also found that there is a similar changing trend between the onset potentials and the d band centers (εd) of the TM active center of the TM-sTCNQ catalysts, which is consistent with the influence of the magnetic moment of the catalyst on NRR. The TMsTCNQ catalyst can activate N2and reduce the barrier of the NRR process. As the εdof the Tc, Mo, and Nb active center increases,being −0.61, 0.09, and 0.81 eV, respectively, the energy of the anti-bond orbital produced by the interaction between the active center and the adsorbed molecule will also increase.

Figure 7. Charge variations of the three moieties along the a) distal, b) alternating, c) distal-alternating, d) consecutive, and e) enzymatic pathways on the Nb-sTCNQ catalyst. f) Definition of the three moieties of the NxHy-TM-sTCNQ intermediates: moiety 1 is the TM-sTCNQ substrate with its TMN4 excluded,moiety 2 is TMN4, and moiety 3 is the adsorbed NxHy species. Bader charge analysis diagrams for NRR on Mo-sTCNQ and Tc-sTCNQ are given in Figure S8,and corresponding values are shown in Tables S7–S9.
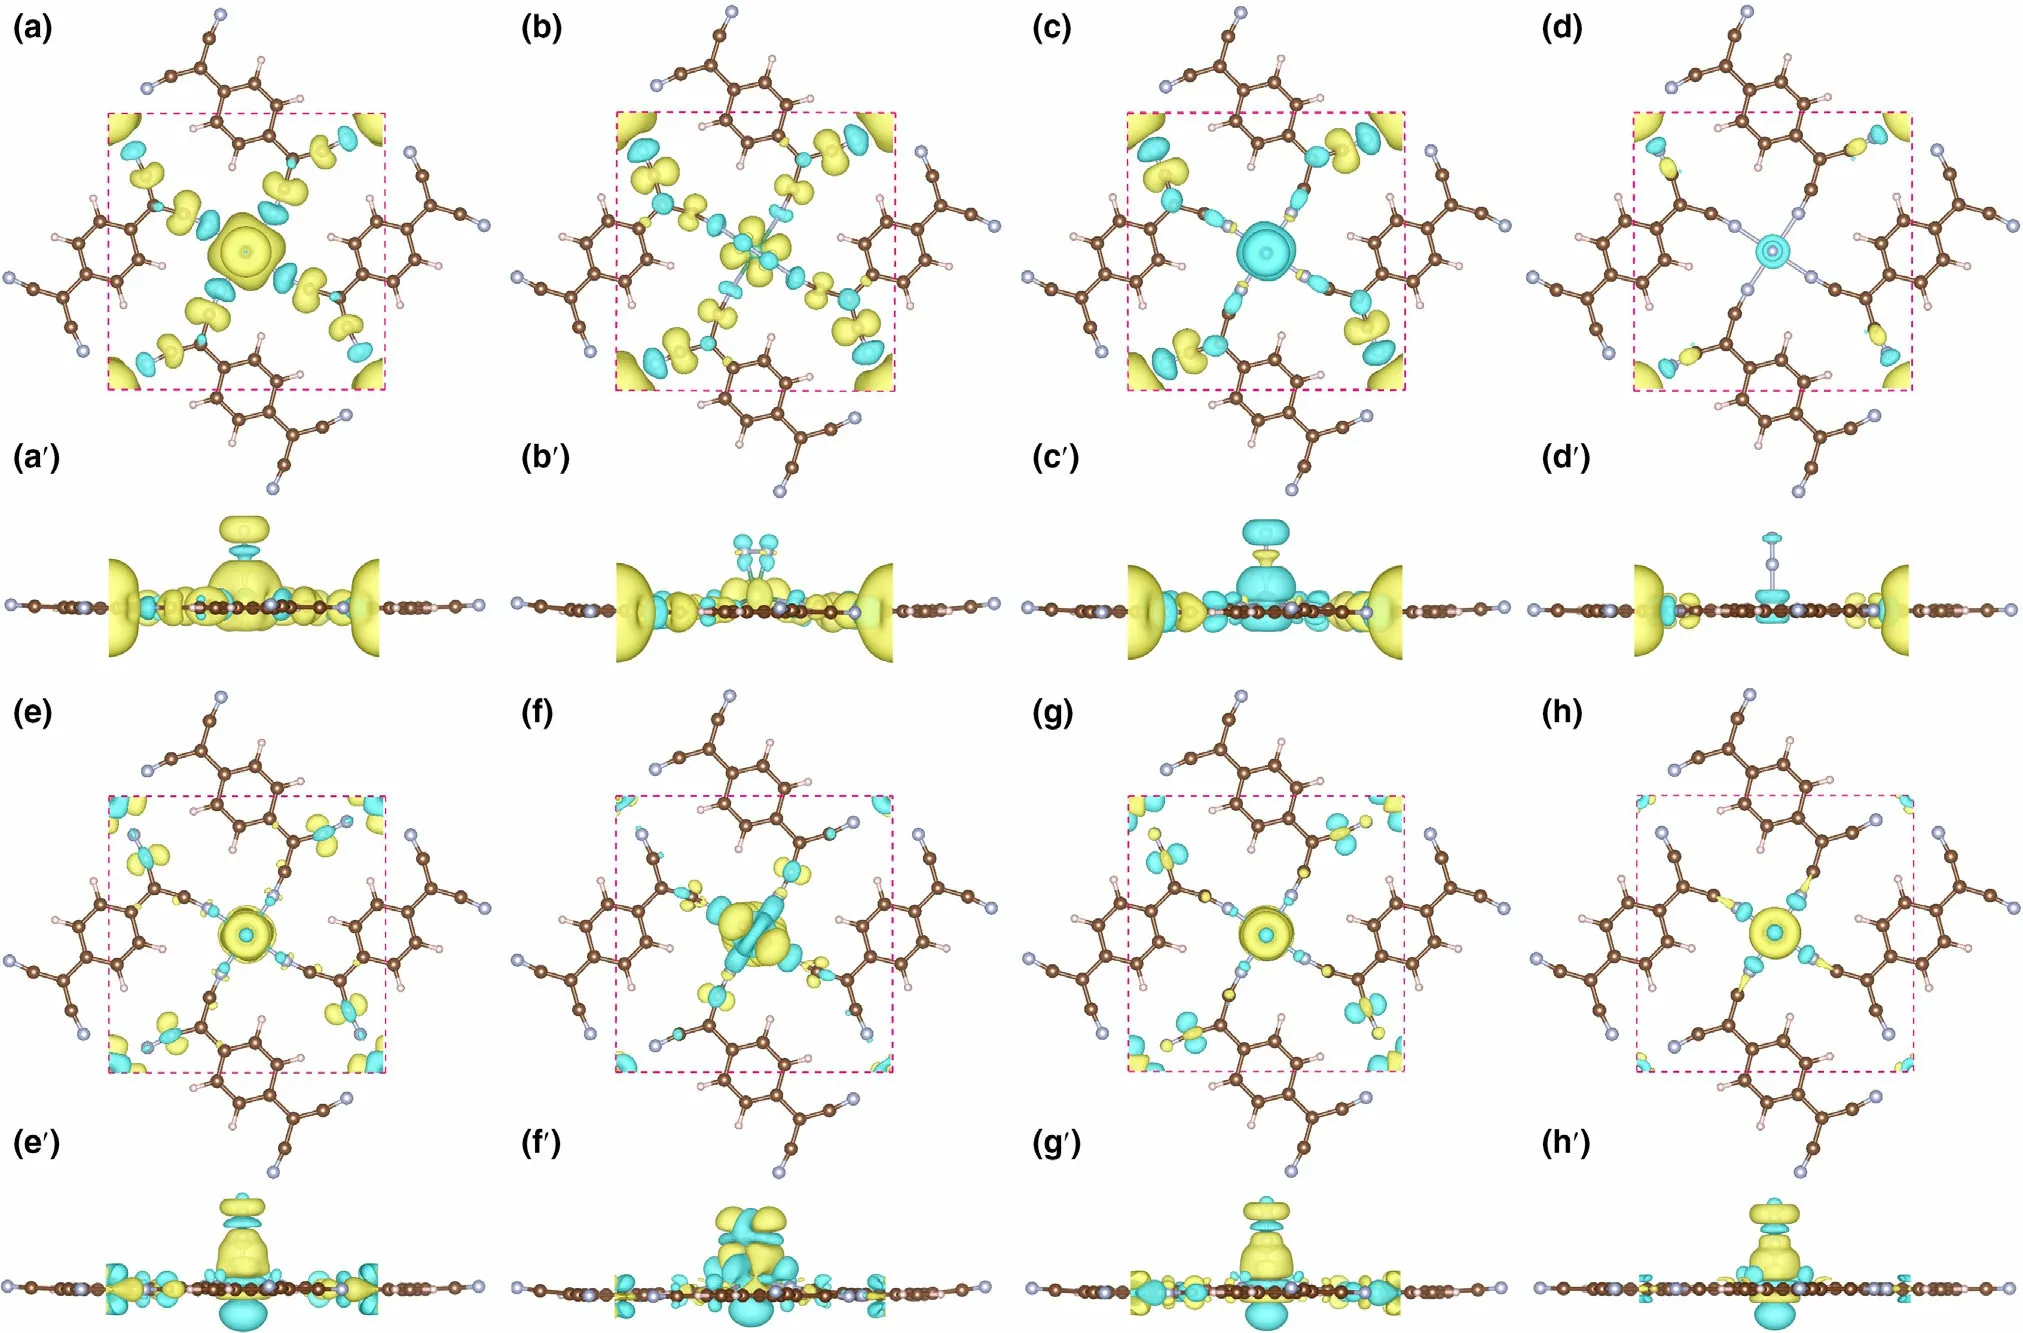
Figure 8. The spin densities (in top and side view) for N2 adsorbed on, a, a′) Nb-sTCNQ (end-on), b, b′) Nb-sTCNQ (side-on), c, c′) Mo-sTCNQ (end-on)and d, d′) Tc-sTCNQ (end-on). The charge density differences (in top and side view) for N2 adsorbed on e, e′) Nb-sTCNQ (end-on), f, f′) Nb-sTCNQ (sideon), g, g′) Mo-sTCNQ (end-on) and h, h′) Tc-sTCNQ (end-on). The electron density accumulation area and depletion are shown in yellow and blue,respectively.
The charge transfers of N2on TM-sTCNQ (TM = Nb, Mo, Tc)in the NRR process were explored by Bader charge analysis. Each reaction intermediate is divided into three parts,[24]the TM-sTCNQ substrate without TMN4(TM = Nb, Mo, Tc; N4= four surrounding N atoms) (moiety 1), TMN4(moiety 2), and adsorbed NxHyspecies (moiety 3), as presented in Figure 7f. Taking Nb-sTCNQ as an example, when adsorbed on Nb-sTCNQ, N2obtains 0.37(end-on) or 0.64 (side-on) electrons, and these electrons are all provided by NbN4(Figure 7). The charge density differences diagram of N2-TM-sTCNQ (Figure 8e–h′) more intuitively shows the charge transfer between N2and TM-sTCNQ. In subsequent hydrogenation steps along NRR, the charges of the three parts fluctuate significantly. For example, among the distal path on Nb-sTCNQ(Figure 7a), N2H obtains 0.15 electrons from Nb-sTCNQ in the first protonation step, while 0.19 electrons are transferred to NbsTCNQ in the fourth protonation step. During the whole NRR process on TM-sTCNQ (TM = Nb, Mo, Tc), TMN4is the major part involved in the charge transfer process, the TM-sTCNQ substrate without TMN4also plays some roles, and the cooperation between TM and sTCNQ promotes the reduction of N2to NH3.

Table 2. The total magnetic moment of N2-TM-sTCNQ and its distribution.TM1 represents the center TM of the crystal lattice (with nitrogen); TM2 represents the corner TM atom of the lattice (without nitrogen); N or C(TM1-CN) means the N or C atom of the four CN groups connected to TM1, N or C (TM2-CN) means the N or C atom of the four CN groups connected to TM2, and N (N2) is the N atom of adsorbed N2 molecule.

Figure 9. The band structure of the a) Nb-sTCNQ, b) Mo-sTCNQ and c) Tc-sTCNQ catalysts. Γ (0.0, 0.0, 0.0), X (0.5, 0.0, 0.0) and M (0.5, 0.5, 0.0) refer to high symmetry points in the first Brillouin zone in reciprocal space. The projected density of states (PDOS) of d) Nb-sTCNQ, e) N2-Nb-sTCNQ (end-on), f)N2-Nb-sTCNQ (side-on), g) Mo-sTCNQ, h) N2-Mo-sTCNQ (end-on), j)Tc-sTCNQ, k) N2-Tc-sTCNQ (end-on), and i) free N2. The PDOSs of TM-d and N-2p are plotted in blue and red, respectively.
To further illustrate the electron acceptance/donation between the Nb-,Mo-,and Tc-sTCNQ catalysts and the N2molecules,the spin densities and charge density differences for N2-TM-sTCNQ (TM = Nb,Mo, Tc) are shown in Figure 8. For N2-Nb-sTCNQ (end-on) and N2-Mo-sTCNQ (end-on), the spin densities are mainly concentrated around the central TM atom (Figure 8a,a′,c,c′), due to the interactions between central TM atom and N2.Moreover,the N atom at the end of N2also contributes part of the spin densities, indicating there are unpaired electrons on the N2molecule, and N2is efficiently activated.Compared with N2-Nb-sTCNQ (end-on) and N2-Mo-sTCNQ (endon), the spin densities around center TM atoms and the N2molecules in the N2-Nb-sTCNQ(side-on)and N2-Tc-sTCNQ(end-on)structures are significantly smaller (Figure 8b,b′,d,d′), which is consistent with the ΔG*N2values. Table 2 lists the main magnetic moment contributions and total magnetic moment values for the N2-TM-sTCNQ structures.The magnetic moment difference between TM1and TM2can also reflect the interaction between N2and the active center TM atom. It shows that the N2-Nb-sTCNQ and N2-Mo-sTCNQ catalysts have stronger N2adsorption and activation ability, and are more inclined to adsorb N2in end-on configuration.As shown in the charge density differences diagram,the TM–N bond accumulates charges,while the N–N bond consumes charges,which also shows strong interactions between TM and N2and the activation of the N≡N bond during the adsorption process.
To get a further understanding into the interactions between N2and TM-sTCNQ, the band structures and the projected density of states(PDOS)were investigated.As presented in Figure 9a–c,the Nb-,Mo-,and Tc-sTCNQ monolayers have negligible energy gaps(at least in one spin channel) with some bands cross the Fermi level, indicating threematerials are metallic. In addition, we use hybrid functional HSE06 to further verify the accuracy and reliability of the bandgap on the TMsTCNQ catalysts. The results show that the band gaps increase as expected. See Figure S9 and Table S10 for details. The valence electron configuration of free N2molecule is (1σg)2(1σu)2(1πu)4(2σg)2. The strong adsorption of N2on the TM-sTCNQ(TM = Nb,Mo,Tc)monolayer may be due to the "acceptance-donation" relationship between the central TM atom and adsorbed N2molecule. The PDOSs of Nb-,Mo-, and Tc-sTCNQ show that there are orbital interactions between TM-d and N-p on TCNQ (Figure 9d,g,j), and the interactions become much stronger after the catalyst adsorbs N2(Figure 9e,f,h,k).Thus,the TM-sTCNQ (TM = Nb, Mo, Tc) catalysts can effectively interact with N2, which is beneficial to the activation of N≡N, the charge transfer between TM-sTCNQ and N2,and the NRR process.

Table 3. The binding energy (Eb, in eV) and the cohesive energy (Ec, in eV)of the TM-sTCNQ (TM = Nb, Mo, Tc) monolayers.
3.4. The Stability of the TM-sTCNQ Monolayers
Structural stability is the basic prerequisite of electrocatalytic materials.Especially,the active center TM atom can be embedded stably in the substrate and not reunite easily,which is closely related to the experimental feasibility and the long-term catalytic activity of SAC. Comparing the binding energies Ebof the Nb,Mo,and Tc atoms anchored on the sTCNQ monolayers with the cohesive energies Ecof the Nb,Mo,and Tc atoms,the stabilities of TM-sTCNQ(TM = Nb,Mo,Tc)are analyzed.As shown in Table 3,the Ebvalues of the TM-sTCNQ(TM = Nb,Mo,Tc)monolayers are −10.58,−9.72,and −9.77 eV,respectively,and the Ecvalues of Nb,Mo,and Tc are 7.44,6.85,and 7.38 eV,respectively.For all the three catalysts,Eb+ Ec< 0,indicating that the sTCNQ substrate can stabilize the Nb,Mo,and Tc atoms well,and the TM-sTCNQ(TM = Nb,Mo,Tc)monolayers have synthetic prospects.
For practical application of the TM-sTCNQ (TM = Nb, Mo, Tc)monolayers under actual electrocatalytic reaction conditions, the thermal stability at room temperature or higher is very important. Thus,we performed AIMD simulations at 500 K to evaluate the thermal stability of TM-sTCNQ (TM = Nb, Mo, Tc) monolayers. When simulating (no symmetry constraints), a 2 × 2 × 1 supercell was employed to explore possible structural reconstruction and to minimize the effects of periodic boundary conditions.Our AIMD simulations of 10 ps time period at 500 K are given in Figures S10–S12.It is clear to see that the skeleton and integrity of the structures maintain well at 500 K although there are some wrinkles and undulations. The high thermal stability makes TM-sTCNQ (TM = Nb, Mo, Tc) fabricable and applicable as electrocatalysts under real reaction conditions.
4. Conclusions
In this work, spin-polarized DFT studies have been carried out on the structures and N2adsorption properties of the TM-sTCNQ monolayers, and high-throughput screenings of highly active NRR electrocatalysts have been conducted among them. Two promising NRR electrocatalysts have been obtained through the screenings, i.e.,the Nb-sTCNQ and Mo-sTCNQ monolayers. Especially, Nb-sTCNQ exhibits nice performance with a lower onset potential of only−0.48 V. Bader charge, charge differential, band structure, and PDOS analyses prove that TM-sTCNQ (TM = Nb, Mo, Tc) have good NRR catalytic activity. Binding energy analyses show that TMsTCNQ (TM = Nb, Mo, Tc) are stable materials and should be able to be synthesized experimentally. Among them, the NRR selectivity of Tc-sTCNQ material is poor. We hope that our research can promote further experimental and theoretical exploration of more 2D materials as efficient NRR electrocatalysts.
Acknowledgements
S.L., C.H., and L.Y. gratefully acknowledge support from the National Natural Science Foundation of China (22073033, 21873032, 21673087, 21903032), startup fund (2006013118 and 3004013105) from Huazhong University of Science and Technology, the Fundamental Research Funds for the Central Universities(2019kfyRCPY116), and the Innovation and Talent Recruitment Base of New Energy Chemistry and Device(B21003).S.-Y.L.,C.-X.H.,and G.L.gratefully acknowledge support from Guangdong Basic and Applied Basic Research Foundation(2021A1515010382) and the computational resources from the computing cluster at the Key Laboratory of Theoretical Chemistry of Environment, Ministry of Education&School of Chemistry,South China Normal University.The work was carried out at the LvLiang Cloud Computing Center of China, and the calculations were performed on TianHe-2. The computing work in this paper is supported by the Public Service Platform of High Performance Computing by Network and Computing Center of HUST.
Conflict of Interest
The authors declare no conflict of interest.
Supporting Information
Supporting Informationis available from the Wiley Online Library or from the author.
Keywords
2D TM-sTCNQ monolayers, density functional theory method,electrochemical nitrogen reduction reaction, high-throughput screening,single-atom catalysts
Received: July 7, 2021
Revised: September 4, 2021
Published online: September 7, 2021
[1] V. Smil, Nature 1999, 400, 415.
[2] J. W. Erisman, M. A. Sutton, J. Galloway, Z. Klimont, W. Winiwarter,Nat. Geosci. 2008, 1, 636.
[3] R. Schlogl, Angew. Chem. Int. Ed. 2003, 42, 2004.
[4] S.L.Foster,S.I.P.Bakovic,R.D.Duda,S.Maheshwari,R.D.Milton,S.D.Minteer,M.J.Janik,J.N.Renner,L.F.Greenlee,Nat.Catal.2018,1,490.
[5] S. Giddey, S. P. S. Badwal, C. Munnings, M. Dolan, ACS Sustainable Chem. Eng. 2017, 5, 10231.
[6] A. J. Mart´ın, T. Shinagawa, J. P´erez-Ram´ırez, Chem 2019, 5, 263.
[7] J. G. Chen, R. M. Crooks, L. C. Seefeldt, K. L. Bren, R. M. Bullock, M. Y.Darensbourg, P. L. Holland, B. Hoffman, M. J. Janik, A. K. Jones, M. G.Kanatzidis, P. King, K. M. Lancaster, S. V. Lymar, P. Pfromm, W. F. Schneider, R. R. Schrock, Science 2018, 360, eaar6611.
[8] L. Li, C. Tang, X. Cui, Y. Zheng, X. Wang, H. Xu, S. Zhang, T. Shao, K.Davey, S. Z. Qiao, Angew. Chem. Int. Ed. 2021, 60, 14131.
[9] J.N.Galloway,A.R.Townsend,J.W.Erisman,M.Bekunda,Z.C.Cai,J.R.Freney,L.A.Martinelli,S.P.Seitzinger,M.A.Sutton,Science 2008,320,889.
[10] B. H. R. Suryanto, H.-L. Du, D. Wang, J. Chen, A. N. Simonov, D. R.MacFarlane, Nat. Catal. 2019, 2, 290.
[11] H. Xu, K. Ithisuphalap, Y. Li, S. Mukherjee, J. Lattimer, G. Soloveichik, G.Wu, Nano Energy 2020, 69, 104469.
[12] D. Z. Yao, C. Tang, L. Q. Li, B. Q. Xia, A. Vasileff, H. Y. Jin, Y. Z. Zhang,S. Z. Qiao, Adv. Energy Mater. 2020, 10, 2001289.
[13] M. A. Shipman, M. D. Symes, Catal. Today 2017, 286, 57.
[14] X. W. Lv, C. C. Weng, Z. Y. Yuan, ChemSusChem 2020, 13, 3061.
[15] Y. Qiu, X. Peng, F. Lu, Y. Mi, L. Zhuo, J. Ren, X. Liu, J. Luo, Chem. Asian J. 2019, 14, 2770.
[16] X.Liu,Y.Jiao,Y.Zheng,M.Jaroniec,S.Z.Qiao,J.Am.Chem.Soc.2019,141,9664.
[17] X. F. Li, Q. K. Li, J. Cheng, L. Liu, Q. Yan, Y. Wu, X. H. Zhang, Z. Y.Wang, Q. Qiu, Y. Luo, J. Am. Chem. Soc. 2016, 138, 8706.
[18] H.Y.Zhou,J.C.Li,Z.Wen,Q.Jiang,Phys.Chem.Chem.Phys.2019,21,14583.
[19] X. Yao, Z. Chen, Y. Wang, X. Lang, W. Gao, Y. Zhu, Q. J. Jiang, Mater.Chem. A 2019, 7, 25961.
[20] Q. Tang, D. E. Jiang, ChemPhysChem 2019, 20, 3141.
[21] L. Xu, L. M. Yang, E. Ganz, ACS Appl. Mater. Interfaces 2021, 13, 14091.
[22] X. Liu, Y. Jiao, Y. Zheng, S.-Z. Qiao, ACS Catal. 2020, 10, 1847.
[23] X. Guo, J. Gu, S. Lin, S. Zhang, Z. Chen, S. Huang, J. Am. Chem. Soc.2020, 142, 5709.
[24] C. X. Huang, G. Li, L. M. Yang, E. Ganz, ACS Appl. Mater. Interfaces 2021, 13, 608.
[25] S. Y. Lv, C. X. Huang, G. Li, L. M. Yang, ACS Appl. Mater. Interfaces 2021, 13, 29641.
[26] M.R.Zhao,B.Song,L.M.Yang,ACS Appl.Mater.Interfaces 2021,13,26109.
[27] L. M. Yang, V. Bacic, I. A. Popov, A. I. Boldyrev, T. Heine, T. Frauenheim,E. Ganz, J. Am. Chem. Soc. 2015, 137, 2757.
[28] B. Y. Song, Y. Zhou, H. M. Yang, J. H. Liao, L. M. Yang, X. B. Yang, E.Ganz, J. Am. Chem. Soc. 2019, 141, 3630.
[29] G. Z. Zhu, L. S. Wang, J. Chem. Phys. 2015, 143, 221102.
[30] T.-C. Tseng, N. Abdurakhmanova, S. Stepanow, K. Kern, J. Phys. Chem. C 2011, 115, 10211.
[31] N. Abdurakhmanova, T. C. Tseng, A. Langner, C. S. Kley, V. Sessi, S. Stepanow, K. Kern, Phys. Rev. Lett. 2013, 110, 027202.
[32] X. Ren, X. Q. Ji, Y. C. Wei, D. Wu, Y. Zhang, M. Ma, Z. Liu, A. M. Asiri,Q. Wei, X. P. Sun, Chem. Commun. 2018, 54, 1425.
[33] Y. C. Wei, X. Ren, H. M. Ma, X. Sun, Y. Zhang, X. Kuang, T. Yan, D. Wu,Q. Wei, Chem. Eur. J. 2018, 24, 2075.
[34] M. W. Xie, X. L. Xiong, L. Yang, X. F. Shi, A. M. Asiri, X. P. Sun, Chem.Commun. 2018, 54, 2300.
[35] G. Kresse, J. Hafner, Phys. Rev. B: Condens. Matter. 1993, 47, 558.
[36] G. Kresse, D. Joubert, Phys. Rev. B: Condens. Matter. 1999, 59, 1758.
[37] J. P. Perdew, K. Burke, M. Ernzerhof, Phys. Rev. Lett. 1996, 77, 3865.
[38] S. Grimme, J. Antony, S. Ehrlich, H. Krieg, J. Chem. Phys. 2010, 132,154104.
[39] J. H. Montoya, C. Tsai, A. Vojvodic, J. K. Norskov, ChemSusChem 2015,8, 2180.
[40] D. Ma, Z. Zeng, L. Liu, X. Huang, Y. Jia, J. Phys. Chem. C 2019, 123,19066.
[41] C. Ling, X. Bai, Y. Ouyang, A. Du, J. Wang, J. Phys. Chem. C 2018, 122,16842.
[42] J. K. Norskov, J. Rossmeisl, A. Logadottir, L. Lindqvist, J. R. Kitchin, T. Bligaard, H. Jonsson, J. Phys. Chem. B 2004, 108, 17886.
[43] Computational Chemistry Comparison and Benchmark Database,http://cccbdb.nist.gov/ (accessed: June 2020).
[44] M. N. Faraggi, N. Jiang, N. Gonzalez-Lakunza, A. Langner, S. Stepanow,K. Kern, A. Arnau, J. Phys. Chem. C 2012, 116, 24558.
杂志排行

Energy & Environmental Materials的其它文章
- Editor’s Note on “Frontier Outlook” Column
- Graphite Anode for Potassium Ion Batteries: Current Status and Perspective
- Green Synthesis of Nitrogen-to-Ammonia Fixation: Past,Present, and Future
- Photo-assisted Rechargeable Metal Batteries for Energy Conversion and Storage
- 3D Printing of Next-generation Electrochemical Energy Storage Devices: from Multiscale to Multimaterial
- The Transference Number