The Transference Number
2022-07-04KevinGaoChaoFangDavidHalatAashutoshMistryJohnNewmanandNitashBalsara
Kevin W. Gao, Chao Fang, David M. Halat, Aashutosh Mistry, John Newman, and Nitash P. Balsara*
Virtually all batteries contain electrolytes dissolved in solvents.The alkaline battery contains KOH, the lead–acid battery contains H2SO4, and the lithium-ion battery contains LiPF6.The presence of two dissociated ions makes them three-species, two-component systems. Electrolytes comprising a lithium salt dissolved in a polymer such as poly(ethylene oxide) are similar to conventional electrolytes except for the fact that the solvent is a chain-like molecule. Describing transport in three-species systems requires three transport coefficients, which are often taken to be conductivity,κ,salt diffusion coefficient(for simplicity, we use the term “salt” as it is the most common electrolytic component),D, andt0+,the cation transference number with respect to the solvent velocity.[1–3]
The passage of current through these systems causes a gradient in the concentration of the electrolyte. At early times, the gradients are localized near the electrode surface,where there is a change in the transference number of the current carrying species.These gradients propagate into the solution as time progresses. These processes are quantified in concentrated solution theory,[1]wherein the time dependence of electrolyte molarity,c, in the presence of ionic current is given by the following material balance equation:

where v0is the spatially dependent solvent velocity,c0is the solvent molarity, i is the current density,Fis the Faraday constant,z+is the charge number of cation, andν+is the moles of cations obtained by dissociating a mole of the electrolyte. An expression that is equivalent to Equation 1 can be derived in terms of the mass fraction of the electrolyte,ωe.[1]
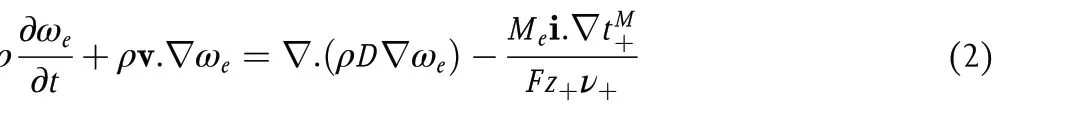
where ρ is the density of the electrolytic solution, v is the mass averaged velocity,Meis the molar mass of the electrolyte, andtM+is the cation transference number with respect to the mass average velocity.The transference number is defined as the fraction of ionic current carried by the cation in an electrolyte of uniform composition. The cation current is given by

where v+is the velocity of the cation. A frame of reference is necessary for defining any velocity and thus a frame of reference is also necessary to define the transference number. It has long been recognized that the solvent velocity is a convenient frame of reference for quantifying the cation current.[1–5]We note in passing that the total current i is independent of the frame of reference due to charge neutrality.
Recognition of the importance of the transference number dates back to the work of Hittorf.[4,5]Figure 1 shows one version of the Hittorf cell which comprises two chambers connected by a tube.Initially,the electrolyte concentration is uniform through the cell;we refer to this concentration ascav. A constant current,I, is passed through the cell using two electrodes placed in the two chambers. For simplicity, we assume that the electrodes are metal foils that can undergo the redox reactions shown in Figure 1.As current flows,cations Mz+enter the anodic chamber,which requires the transport of anions Xz-from the tube into the anodic chamber to maintain charge neutrality.This will result in depletion of anions from the cathodic chamber.We assume that the measurements are conducted at early times so that the concentration within the tube can be approximated ascav.This also implies that the electrolyte concentrations in the two chambers near the ends of the tube are alsocav,as shown schematically in Figure 1. At timet, the chambers are isolated,perhaps by closing valves located at the ends of the tube, and the final electrolyte concentration in the anodic chamber,cfinal,is measured.The accumulation of Mz+ions in the anodic chamber can be written as
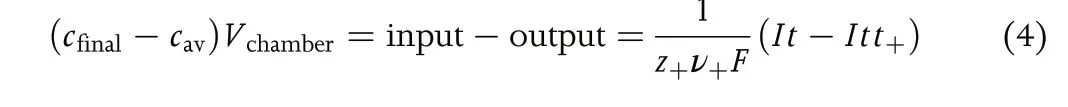
whereVchamberis the volume of the anodic chamber, andt+is the fraction of current carried by the cation at the concentrationcav.The moles of Mz+entering the anodic chamber (input) is proportional toIt. The definition oft+leads to the conclusion that the moles of Mz+ions exiting the anodic chamber into the tube (output) is proportional toItt+. The prefactor on the right side of Equation 4 converts coulombs into moles.Rearranging Equation 4 gives:
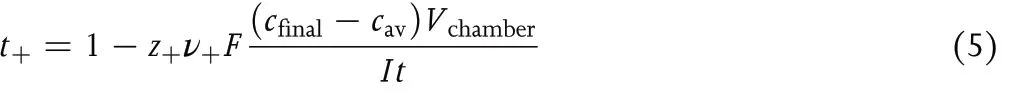
Data from the Hittorf cell can be used to determinet+if all other parameters on the right side of Equation 5 are measured.
Equation 5 assumes zero solvent motion in the passage between the two chambers in the Hittorf cell.It has been experimentally confirmed that the motion of solvent molecules between the chambers is nonnegligible(see Figure 1).A more detailed analysis that accounts for solvent transport in the Hittorf cell based on concentrated solution theory,[1,6–8]gives the following expression for the transference number:[9]
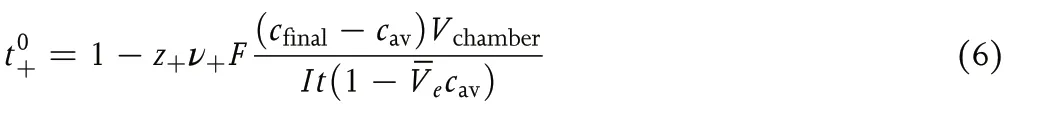
whereV̅eis the partial molar volume of the electrolyte andt+in Equation 5 is replaced byt0+.
If the transference number in one reference frame is measured, it can readily be determined in another reference frame.[1]For example,

where ω0and ω-are the solvent and anion mass fractions.
Even though the transference number is defined for a solution of uniform composition, it is a property that can be used to quantify transport in electrolytes which are not of uniform composition; see Equations 1 and 2.Any attempt to pass current through an electrolyte results in an electrolyte of nonuniform composition, and experiments that are used to determine the transference number must account for this complication,as done by Hittorf. In some cases, the nonuniformity may be restricted to narrow regions near the electrodes(e.g.,Figure 1).The transference number in Equation (5) is one that applies to an infinitely dilute electrolyte.Even in this case,a reference frame is needed for the definition;one would not want to develop separate equations for cells at rest and cells inside a moving electric vehicle. In the limit of infinite dilution, the mass average and solvent velocities are identical,andt0+must equaltM+.
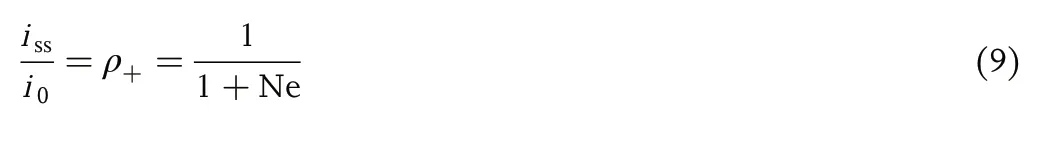
Bruceet al.and Watanabeet al.proposed an approximate method for measuring the transference number.[10–12]In this experiment, a fixed potential is applied to a symmetric cell with electrodes similar to those used in the Hittorf cell, and the current is measured as a function of time (Figure 1b). It was shown that if the electrolyte is infinitely dilute then the transference number is given by

Figure 1. Schematics of cells used to measure the transference number. The electrolyte that is initially of concentration cav is placed between two electrodes. The final electrolyte concentrations are shown by curves and shading. Ionic current is drawn from left to right by polarizing the nonblocking metal electrodes (M). Salt concentration (c) profiles after ionic current drawn are also shown. For the lower drawing, sufficient time has passed to yield a steady profile.

wherei0is the initial current density measured before concentration polarization sets in andissis the current density obtained at steady state. Experiments are seldom done on infinitely dilute electrolytes, partly because the need to maximize the charge carrier concentration forces us to use concentrated electrolytes in practical applications.In concentrated electrolytes, the current ratioiss/i0, which we call,ρ+is given by[13]
where Ne, a dimensionless quantity that we call the Newman number, is given by
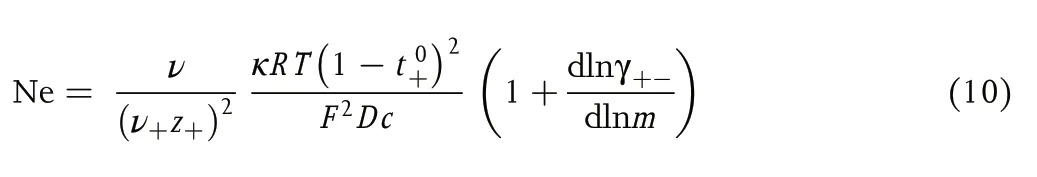
where ν is total moles of cations and anions produced by dissociating a mole of the electrolyte,Ris the gas constant,Tis the temperature, γ+-is the mean molal activity coefficient of the electrolyte,andmis molality.t0+can thus be measured rigorously using symmetric cells if the other parameters in Equation (10) are known.[14]κcan be measured by ac impedance,Dcan be measured by the restricted diffusion method, and the dependence of γ+-onmcan be measured in concentration cells,as reported by Maet al.[15]
In Figure 2, we show the dependence oft0+,tM+, and ρ+oncfor a well-studied electrolyte: a mixture of poly(ethylene oxide) and lithium bis(trifluoromethanesulfonyl)imide (PEO/LiTFSI).[14,16–18]The plot, which is taken from ref. [18], is based on data obtained from 64 independent electrolyte samples. Thus, the quantity measured directly, ρ+, has relatively narrow error bars. However,t0+is obtained by combining several experimentally measured quantities(see Equation 10), and this results in much larger error bars. ρ+,t0+, andtM+must be equal at infinite dilution. All the measured data in Figure 2 are well outside this limit. The concentration dependence of the three parameters is very different. ρ+is positive at all concentrations, as required by the second law of thermodynamics (see Equations 9 and 10), and has a shallow minimum atc= 2.1 M.tM+is also positive at all concentrations but has a deeper minimum at roughly the same concentration. The deepest minimum is seen int0+; atc= 2.4 M,t0+=-0:2.t0+is negative at concentrations between 1.8 and 2.8 M. The importance of specifying the frame of reference is clear from Figure 2. ρ+is not a good approximation for the transference number in any frame of reference.
In a Hittorf cell,the net influx of cations into the anodic chamber via the electrode isIt/z+ν+F.In most cases,t0+lies between 0 and 1.When such an electrolyte is examined in a Hittorf cell,the net accumulation of cations in the anodic chamber is less than this influx because some cations leave the anodic chamber and enter the tube. When an electrolyte with negativet0+is examined in a Hittorf cell,the net accumulation of cations in the anodic chamber will be greater(assumingcavandIare kept constant—see Equation 4). This increased accumulation is a signature of increased concentration polarization and has a detrimental effect on the cation transport. The net accumulation of cations in the anodic chamber will be negative ift0+> 1, which is uncommon (it implies thatt0-is negative)but not forbidden by thermodynamic laws.In systems whereint0+< 0 ort0+> 1,the motion of individual cations is correlated with that of other ions or solvent molecules;one may use the term temporary clusters to describe these correlations.Determining the nature of these correlations, however, requires additional experiments such as spectroscopy and scattering.Computer simulations may also be used to shed light on the molecular origins of the measured transference number.[19–21]

Figure 2. Plots of the current fraction, ρ+, and transference numbers with respect to the solvent and mass average velocities, t0+ and tM+, versus concentration for PEO/LiTFSI at 90 °C. These curves are fits to experimentally measured data points for 0.77 M < c < 3.77 M and extrapolations to c = 0,where ρ+, t0+, and tM+ must be equal (see ref. [18]). The curve for ρ+ is ρ+ =0:0155c3-0:0412c2-0:0368c +0:1783.The curves for t0+ and tM+ given by t0+ =-0:0532c5+0:4612c4-1:2179c3+0:9141x2+0:0488c +0:1783 and tM+ =-0:0189c5+0:1336c4-0:1886c3-0:3108x2+0:6869c +0:1783 were forced to agree with the extrapolated value of ρ+ at c = 0.The shaded areas reflect 95%confidence intervals for the experimentally measured t0+ and tM+ data.The same confidence interval for ρ+ is commensurate with the thickness of the curve.ρ+ is not a good approximation for either transference number.
The practical reason for measuring the transference number and other transport properties is to predict the performance of batteries as they are charged or discharged. Figure 3 shows a schematic of a battery. Two examples of salt concentration profiles in the battery when current is drawn through it are given in Figure 3. The magnitude of the concentration gradients obtained at the same state of charge in the battery increases with increasing current. At low current density (e.g.,i1), the salt concentration is nonzero in the cathodic chamber and all the active particles in the cathode participate in redox reactions.At sufficiently high current density,however,(e.g.,i2)the local salt concentration is 0 at some locations (x>Llimitin Figure 3), and active particles in these regions cannot participate in redox reactions. This will lead to limited utilization of the capacity of the battery and other complications such as irreversible side reactions in thex>Llimitregion. Equation 1(or equivalent equations such as Equation 2) lies at the heart of computer programs used to predict electrolyte concentration profiles in functioning batteries.[22]The concentration dependence of the transference number(not the absolute magnitude but the magnitude and sign of the gradient of thet0+andtM+curves in Figure 2)plays an important role in determining these concentration profiles.

Figure 3. Schematic of a battery with a composite anode and cathode.Active particles are shown in different colors with electron-conducting carbon particles shown in black. An inert porous separator (not shown explicitly) flooded with the electrolyte separates the cathodic and anodic chambers. The battery contains an electrolyte that is initially of concentration cav. The salt concentration profile at two applied current densities (i2 > i1) is shown. At the lower current density, all of the active particles participate in the redox reaction. At the higher current density, the cathode particles in the region x > Llimit do not participate in the redox reaction. The shading of the electrolytic phase reflects salt concentration.Predicting the concentration profiles as a function of current density requires knowledge of the concentration dependence of the transference number.
To summarize, we have discussed the transference number in the context of the Hittorf cell,symmetric cells,and batteries.We stress the importance of specifying the frame of reference when defining the transference number, and demonstrate this using literature data obtained from PEO/LiTFSI mixtures. The large error bars associated with transference numbers are unavoidable if they are determined by combining the results of four separate experiments as is routine in current literature.[14,15,23]It seems likely that emerging methods such as electrophoretic NMR[24–26]will enable higher precision measurements of the transference number.
Conflict of Interest
The authors declare no conflict of interest.
Keywords
battery electrolytes, concentrated solution theory, ion transport, reference frames, transference number
Received: January 27, 2022
Published online: January 28, 2022
[1] J. Newman, N. P. Balsara,Electrochemical Systems, John Wiley & Sons,Hoboken 2021.
[2] L. Onsager,Phys. Rev.1931,37, 405.
[3] L. Onsager,Phys. Rev.1931,38, 2265.
[4] M. Faraday, J. W. Hittorf, F. W. G. Kohlrausch.The Fundamental Laws of Electrolytic Conduction: Memoirs by Faraday, Hittorf and F. Kohlrausch, Vol.7, Harper & brothers, New York City 1899.
[5] W. Hittorf,Zeitschrift F¨ur Physikalische Chemie1903,43, 239.
[6] G. N. Lewis,J. Am. Chem. Soc.1910,32, 862.
[7] D. A. MacInnes, L. Longsworth,Chem. Rev.1932,11, 171.
[8] P. Milios,Master of Science Thesis, University of California, Berkeley 1967.
[9] T. Hou, C. W. Monroe,Electrochim. Acta2020,332, 135085.
[10] J. Evans, C. A. Vincent, P. G. Bruce,Polymer1987,28, 2324.
[11] P. G. Bruce, C. A. Vincent,J. Electroanal. Chem. Interfacial Electrochem.1987,225, 1.
[12] M. Watanabe, S. Nagano, K. Sanui, N. Ogata,Solid State Ionics1988,28,911.
[13] N. P. Balsara, J. Newman,J. Electrochem. Soc.2015,162, A2720.
[14] D. M. Pesko, K. Timachova, R. Bhattacharya, M. C. Smith, I.Villaluenga, J. Newman, N. P. Balsara,J. Electrochem. Soc.2017,164,E3569.
[15] Y. Ma, M. Doyle, T. F. Fuller, M. M. Doeff, L. C. De Jonghe, J. Newman,J. Electrochem. Soc.1995,1859, 142.
[16] S. Lascaud, M. Perrier, A. Vallee, S. Besner, J. Prud’Homme, M. Armand,Macromolecules1994,27, 7469.
[17] D. A. Gribble, L. Frenck, D. B. Shah, J. A. Maslyn, W. S. Loo, K. I. S.Mongcopa, D. M. Pesko, N. P. Balsara,J. Electrochem. Soc.2019,166,A3228.
[18] K. W. Gao, N. P. Balsara,Solid State Ionics2021,364, 115609.
[19] D. R. Wheeler, J. Newman,J. Phys. Chem. B2004,108, 18353.
[20] D. R. Wheeler, J. Newman,J. Phys. Chem. B2004,108, 18362.
[21] K. D. Fong, H. K. Bergstrom, B. D. McCloskey, K. K. Mandadapu,AIChE J.2020,66, e17091.
[22] T. F. Fuller, M. Doyle, J. Newman,J. Electrochem. Soc.1994,141, 1.
[23] J. Landesfeind, H. A. Gasteiger,J. Electrochem. Soc.2019,166, A3079.
[24] H. Walls, T. Zawodzinski,Electrochem. Solid State Lett.2000,3, 321.
[25] Z. Zhang, L. A. Madsen,J. Chem. Phys.2014,140, 084204.
[26] K. Timachova, J. Newman, N. P. Balsara,J. Electrochem. Soc.2019,166,A264.
杂志排行

Energy & Environmental Materials的其它文章
- Editor’s Note on “Frontier Outlook” Column
- Graphite Anode for Potassium Ion Batteries: Current Status and Perspective
- Green Synthesis of Nitrogen-to-Ammonia Fixation: Past,Present, and Future
- Photo-assisted Rechargeable Metal Batteries for Energy Conversion and Storage
- 3D Printing of Next-generation Electrochemical Energy Storage Devices: from Multiscale to Multimaterial
- Recent Advances on the Development of Functional Materials in Microbial Fuel Cells: From Fundamentals to Challenges and Outlooks