An extended improved global structure model for influential node identification in complex networks
2022-06-29JingChengZhu朱敬成andLunWenWang王伦文
Jing-Cheng Zhu(朱敬成) and Lun-Wen Wang(王伦文)
College of Electronic Engineering,National University of Defense Technology,Hefei 230037,China
Keywords: complex network,influential nodes,extended improved global structure model,SIR model
1. Introduction
Complex networks have attracted the wide attention of researchers in recent years. One important research direction is to rank the nodes in the network,which is of great significance for clarifying network structure and maintaining network operation. In fact,various complex systems that accompany human daily life can be expressed as complex networks,such as scientific cooperation networks,[1]transportation networks,[2]social networks[3]and protein–protein interaction networks.[4]Research shows that a small number of nodes in the network play a supporting role in the whole network. Finding these nodes has become a research hotspot. Studying the structure information of these nodes can give a deeper understanding of the information propagation between nodes,which is of great significance to the study of node influence.
Many classical identification methods have been proposed for node influence, such as degree centrality,[5]betweenness centrality,[6]closeness centrality,[7]eigenvector centrality,[8]K-shell decomposition,[9]H-index,[10]etc.Among these methods, degree centrality is the simplest and most intuitive method, and it reflects the most local information of nodes,which can be expressed by the number of nearest neighbor nodes. However, the degree centrality method does not distinguish well among the influence of each node, and it is easy to define some nodes with the same value, which eventually leads to the low accuracy of the ranking results.To solve the problem of discrimination and accuracy,Zengetal.[11]proposed a mixed degree decomposition method,which can be converted into degree centrality and K-shell decomposition method by adjusting parameters. Sheikhahmadi and Nematbakhsh[12]proposed a method of mixing core, degree and entropy information, considering the low discrimination between K-shell and degree centrality.Compared with K-shell and degree centrality,this method has a certain distinction,but some nodes have not been fully considered. Ibnoulouafiand Haziti[13]defined a new node influence identification method based on the density formula,which takes the degree centrality of the node itself as the mass and the path length from the node as the radius. This method improves the discrimination and accuracy, but does not fully consider the information of the surrounding nodes. Liet al.[14]proposed clustering localdegree (CLD) centrality by combining the clustering coefficient of nodes with the degree value of the nearest neighbor nodes. This method considers the information of the nearest neighbor nodes, but ignores the influence of other neighbor nodes. According to the gravity model, Liet al.[15]regarded the degree centrality of their own and neighbor layer nodes as the mass of mutually attractive celestial bodies in the gravity model, and regarded the path length between the nodes as the distance between celestial bodies. Yanet al.[16]proposed a node ranking method that integrated node information of itself, the neighbor layer and location information. This method first obtained a mixed multi-index method by using the entropy weight method, and then applied it to the gravitational law formula, and analyzed multiple combinations in the datasets, indicating that the new method is more accurate than the classical method. Yanget al.[17]first proposed an improved K-shell decomposition method, and then combined it with degree centrality. At the same time,the influence of path length was introduced,and the performance of discrimination and accuracy was improved. Ullahet al.[18]proposed a global structure model to rank nodes. The model takes the K-shell value as its own influence,and combines the K-shell value of neighbor layer nodes with the path length as a global influence. Although the path length is introduced,the influence of path length is not fully considered.
The above methods solve the problems of the poor identification effect and low accuracy in the process of node identification from different perspectives,but do not fully consider the impact of the location information of nodes.In order to further explore the influence of location information between neighbor layer nodes and measured nodes, this paper proposes an extended improved global structure model to identify influential nodes in the network. This method first calculates the degree centrality of each node, and uses the degree information of the node itself to represent the influence of the node itself.Regarding the influence of the neighbor layer nodes, this paper introduces the power of the path length to show the attenuation effect in the information transmission process caused by the distance. Finally, the sum operation of the nearest neighbor node information is carried out to rank the influence of the node. To verify the effectiveness of the proposed method,1000 independent simulation experiments are carried out on 11 real networks using the SIR propagation model[19]to obtain the propagation influence of nodes,and the results of each method are compared with the node influence obtained by the SIR model. The experiments show that the proposed EIGSM method in this paper performs better than DC,[5]BC,[6]Kshell,[9]MCDE,[12]and GSM.[18]
This section describes the research background and research status, the next sections describe the content as follows. Section 2 describes benchmark methods and the proposed EIGSM method. Section 3 describes the datasets used in this paper and the corresponding evaluation criteria. Section 4 shows the relevant experiments for discrimination and accuracy. Conclusions are given in Section 5.
2. Related work
An unweighted and undirected network can be represented byG=(V,E),whereVdenotes the set of nodes of the network andErefers to the set of connected edge information.Meanwhile, we can represent the node and edge information of the whole network by the adjacency matrixA={aij},and use the size of the matrix to represent the number of nodes,and the matrix elementai jto represent the edge connection. Ifaij=1,it means that the nodeiandjare directly connected,otherwise they are not directly connected.
2.1. Benchmark methods
2.1.1. Degree centrality
Degree centrality[5]reflects the most local information of nodes, which is simple and intuitive, and can be directly expressed by the number of connected nodes. The larger the degree is,the greater the node influence is. The degree centrality formula of nodeican be expressed as

2.1.3. K-shell decomposition method
The K-shell decomposition method[9]separates the nodes into different layers, and the later the node is separated, the more important the node is. The specific steps of K-shell decomposition are as follows.
(i)Firstly,the degree of each node is obtained according to the adjacency matrix of the network.
(ii)Delete the node whose degree value is 1 and recalculate the degree value of the network. If there is a node whose degree value is 1, then continue to delete the node until the degree value is greater than 1 and divide all deleted nodes into the first layer.
(iii)Strip nodes of other degrees step by step according to(ii)until no node can be stripped.
2.1.4. Mixed core, degree, and entropy
Mixed core, degree and entropy (MCDE)[12]takes the node’s own core and degree values into account as well as the effects of the node’s friends, as shown in the following equation:

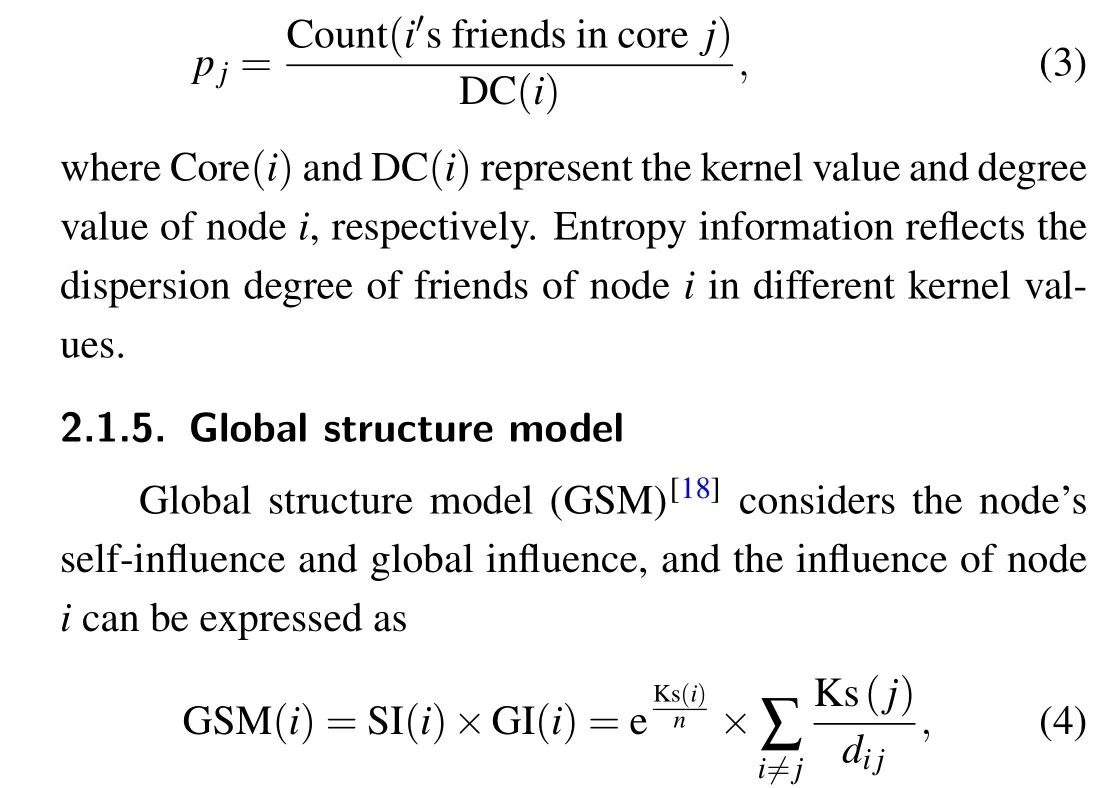
where Ks(i)refers to the K-shell decomposition value of nodei,anddi jrefers to the path length between nodeiand nodej.
2.2. Proposed extended improved global structure model
In current research on node influence,researchers mostly focus on the K-shell decomposition method and the DC method. The main reason is that these two methods are very simple. Researchers can simply obtain the corresponding values of nodes in the network,which also allows these two methods to be widely used in large-scale networks and have a wider range of applications. However, both the K-shell decomposition method and the DC method are faced with a problem:they cannot well distinguish the importance of each node in a network. The K-shell decomposition method is characterized by a small number of levels, and it is easy to divide multiple nodes into the same level.The disadvantage of the DC method is that it only reflects the edge information of nodes,and there must be a large number of nodes with the same number of edges in a large-scale network. It is worth noting that nodes with the same value in the network also have different influences due to the influence of location information. Based on the GSM method,this paper makes improvements.First of all,considering that the DC method is better than the K-shell decomposition method in distinguishing the influence of nodes,this paper uses the DC method instead of the K-shell decomposition method,and uses the degree centrality information of nodes and the total number of network nodes to represent their own influence.At the same time,in addition to the node’s own information, the location information of the node will have a certain impact on information dissemination. In this paper,the neighbor layer information is used to represent the influence of the location information on the measured node. A node with a distance of 1 is divided into neighbor layer 1, and a node with a distance of 2 is divided into neighbor layer 2. On account of information loss, the farther the distance from the measured node is, the weaker the ability to receive information is. This paper sets a path loss related to the shortest path length between nodes and the average degree. The formula is as follows:


Fig.1. Example network.
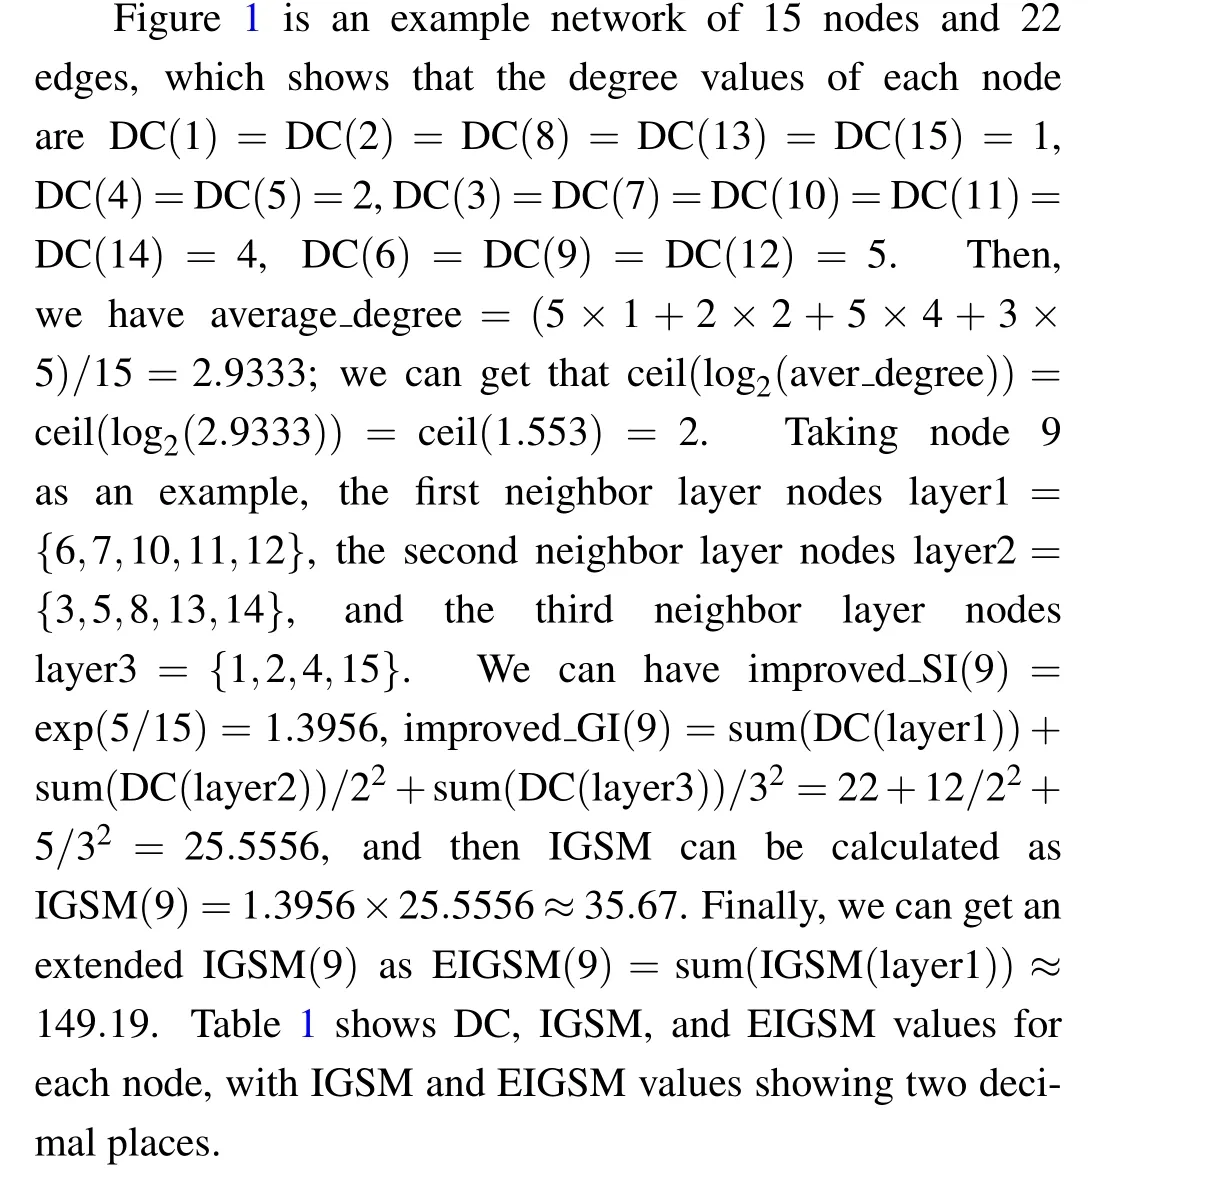

Table 1. DC,IGSM,and EIGSM values for each node in the sample network.
where a refers to the nearest neighbor set of nodesi.In order to show the effect of distinguishing the influence of each node, Table 2 shows the ranking of each node. From the table, DC divides nodes into 4 levels, BC divides into 11 levels,K-shell decomposition divides into 3 levels,MCDE divides into 9 levels, GSM divides into 13 levels, IGSM and EIGSM divides into 14 levels. Node 1 and node 2 cannot be distinguished because the two nodes are locally symmetric and have the same information about themselves and their neighbors, so it can be considered that the influence of the nodes is the same. From the degree of distinction, DC can distinguish more levels than the K-shell decomposition method.The IGSM and EIGSM methods are better than the GSM method in node influence ranking. In terms of differentiation effects,DC can distinguish more layers than the K-shell decomposition method, and the IGSM and EIGSM methods distinguish better than the GSM method in terms of node influence ranking.

Table 2. Ranking results of different methods for each node in the example network.
3. Datasets and evaluation criteria
3.1. Datasets
This paper selects several real network datasets with different structures to verify the effectiveness of the algorithm. The real networks are the Contiguous network,[20]Dolphin network,[21]Polbooks network,[22]Word network,[23]Jazz network,[24]Slavko network,[22]USAir network,[25]Netscience network,[23]Infectious network,[26]Elegans network,[27]and Email network.[28]Some basic parameters of the networks are shown in Table 3. The parameters shown in the table include the total number of nodesn, the total number of connected edges between nodesm, the propagation thresholdβth=〈k〉/〈k2〉,〈k〉is the average degree,〈k2〉is the second-order average degree,βrefers to the propagation probability,kmaxrefers the maximum degree,Drefers to the network diameter,Cis the average clustering coefficient andris the assortativity coefficient.[29]

Table 3. Basic parameters of real networks.
3.2. SIR model
The SIR model[19]is widely used to simulate the process of information dissemination and disease infection. In this paper, the SIR model is used to simulate the real influence of nodes. In the SIR propagation model,nodes can exist in three states: Susceptible(S)state,the nodes are in normal state and have the risk of being infected; infected (I) state, the nodes are infected with disease and will infect the surrounding nodes with a certain probability; recovery (R) state, the nodes recover from the infected state and will not be infected again.The specific step of simulating node influence is to set the initial state as an infected node; then the infected node infects the nearest neighbor node with a certain probability and the infected node recovers with the probability ofλ=1 until the whole process is stable. In this paper,the probability near the propagation threshold[30]is adopted for the experiment. The total number of infected nodes is used as the propagation influence of the nodes,and 1000 independent simulation experiments are carried out to obtain the average value. The results of the SIR model will be used for comparative analysis with various methods to test the excellence of the proposed method.
3.3. Comprehensive cumulative distribution function
Comprehensive cumulative distribution function(CCDF)[31]can fully describe the probability distribution of the values obtained by each method. The CCDF function value corresponding to the coordinates rankedrin the ranking list is the sum of probabilities greater thanr, and the CCDF formula can be expressed as


3.4. Kendall coefficient
The Kendell coefficient[32]is used to evaluate the correlation between the ranking results obtained by the SIR model and the ranking results obtained by specific methods. It is assumed that (xi,yi) and (xj,yj) are two elements in the twodimensional array(X,Y). Ifxi >xjandyi >yjorxi <xjandyi <yj,the pair of elements is said to be concordant. Ifxi >xjandyi <yjorxi <xjandyi >yj,the pair of elements is said to be discordant. Ifxi=xjoryi=yj,then these two elements are neither concordant pairs nor discordant pairs. The formula is defined as

whereCandDare the numbers of concordant pairs and discordant pairs,respectively.
3.5. Jaccard similarity coefficient
The Jaccard similarity coefficient[33]is used to compare the similarity between the ranking results obtained by each method and the SIR model. The Jaccard similarityJrcan be expressed by the intersection and union of two arrays,and the specific formula is

X(r)andY(r)denote the firstrelements in the two listsXandY,respectively.The value range ofJris[0,1],and the closer to 1 this value is,the higher the similarity between the two lists.
4. Experiment and analysis
In this section, the distinction and accuracy of the identification method are experimentally and analytically studied.The distinction is used to avoid a large number of nodes being defined as the same value, and the accuracy is used to verify the rationality of the sorting results.
4.1. Discrimination experiments
In the network,there is a problem that some nodes are defined as the same value because the surrounding information of the nodes are fully considered.In this case,it is difficult to give the node influence ranking results of the same value nodes. In order to avoid this situation of the ranking results,it is necessary that the proposed method can distinguish the influence of each node as much as possible. Figure 2 shows the probability distribution of the ranking results of each method with six networks: Contiguous,Polbooks,USAir,Infectious,Elegans and Email. From the results of the figure, the probability distribution of the K-shell decomposition method and DC method is only concentrated in the front part, which shows that these two methods define many nodes as the same value. At the same time,we can also see that the DC method has better discrimination effect than the K-shell method. MCDE combines DC, K-shell and entropy information. It can be seen that the MCDE method can already distinguish the top-ranking nodes,but the effect of distinguishing the bottom-ranking nodes is not obvious. This is because the entropy information only considers the node’s own degree value and the nearest neighbor’s K-shell information,and there will be many similar structures for the nodes with small degree values,leading to the weakening of the distinguishing ability. BC aims to find nodes in the hub position of the network,so BC has a good distinction effect in the early stage. We will find that BC has a high point in the later period because there are also a large number of nodes not in the hub position in the network. These nodes will also show different influences due to the influence of the surrounding environment,which is not considered by BC. With regard to GSM, IGSM, and EIGSM, we can see that the influence of each node can be basically identified,and even if the same value node appears,it also remains at a very low point. In the Elegans network,it can be seen that the EIGSM method shows a better distinction effect than other methods.
Figure 3 shows the CCDF curves of each method. We can intuitively understand the discrimination of each method by observing the declining trend of the curves. When the curve has no inflection points as a straight line, it indicates that each node is defined as different values,and the faster the curve drops, the greater the number of nodes assigned to the same ranking. In Fig. 3, the DC, K-shell, and MCDE methods show an obvious downward trend. BC effectively distinguished nodes in the early stage,and there was a sudden drop point in the later stage. GSM, IGSM, and EIGSM fell more slowly than other methods. In the Contiguous and Polbooks networks, EIGSM completely distinguishes the influence of all nodes. In the Infectious and Email networks,the three approaches tend to decline approximately in a straight line. In the USAir and Elegans networks,the EIGSM method also obviously shows a slower decline rate than other methods. From the results, it can be seen that the EIGSM method can well distinguish the influence of each node.
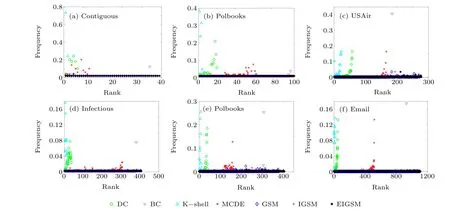
Fig.2. Probability distribution in the ranking list obtained by each method.

Fig.3. CCDF diagram of ranking results of each method.
4.2. Accuracy experiment
The accuracy experiment mainly focuses on three aspects:the Kendell coefficient, the scatter plot of influence consistency and the Jaccard similarity coefficient.
4.2.1. Selection of the power of the average path length
Figure 4 shows the influence of power selection in each network on the accuracy of node recognition. Thex-axis is the value of the power,and they-axis is the Kendall coefficient between the EIGSM and the SIR model. From the figure,we can see that different networks have different power values.At this time, we begin to think about how to choose the appropriate power value. Then, we think of the parameter of the average degree. The main reason for selecting the average degree is because this paper focuses on the degree of nodes,and the average degree is the average of all node degrees,so that we do not need to recalculate other things,which is simple and convenient. Figure 5 shows the relationship between the optimalkvalue of each network power in Fig.4 and ceil(log2(k)). Because the coordinates are repeated,the size of the five-pointed star represents the number of repetitions. From Fig. 5, it can be obtained that the five-pointed stars are approximately distributed around the straight liney=xby using the proportional function. So we finally determine thatkoptimal≈ceil(log2(k)).

Fig.4. Influence of power of the shortest path on each network.

Fig.5. The relationship between the optimal k value and the average degree.
4.2.2. Influence consistency experiment
Figure 6 shows the scatterplot of the influence consistency between the node influence values obtained by each method on the Dolphin, Word and Slavko networks and the values obtained by SIR model simulation. Each scatter in the figure represents a node. The better the monotonicity of the curve trend shown in the scatter plot is,the higher the correlation is, and the closer the scatter is, the better the effect is. It can be seen from the figure that the scatter plot distribution of BC is very divergent.At the same time,it can also be observed that the K-shell decomposition method has a weak distinguishing ability, and the same K-shell value corresponds to many nodes. The DC, MCDE, GSM, IGSM, and EIGSM results are positively correlated with node influence. It can be seen that DC and MCDE are not very concentrated in the three networks, and GSM is also dispersed in the Dolphin and Slavko networks. Relatively speaking, the node number obtained by the proposed EIGSM method has the highest correlation with the node influence,and the nodes are relatively concentrated.
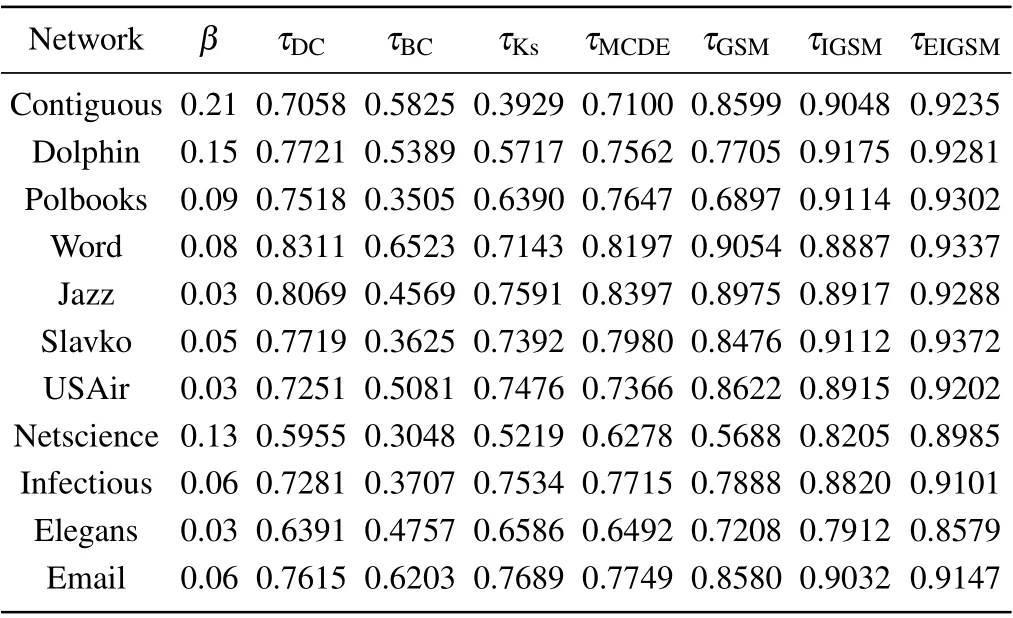
Table 4. Kendall correlation coefficients of different methods in the real network.
Figure 7 shows the correlation scatter diagram of EIGSM and DC,MCDE,GSM,IGSM. Thex-axis is the value calculated by EIGSM for nodes in the network,and they-axis is the value of the other methods. It can be seen from the figure that the scatter plot is positively correlated. EIGSM and DC show a linear trend from the trend of the scatter plot curve,but due to the discrimination of DC, the scatter distribution is more dispersed. From the density point of view, the scatter plots of EIGSM and IGSM are most concentrated,while the scatter plots of DC, MCDE, and GSM are more dispersed. Overall,EIGSM has the highest correlation with IGSM.
Table 4 gives the Kendall coefficient of various methods in the real network,and it can be seen that EIGSM has the best effect. This shows that providing neighbor layer nodes information attenuation and considering the nearest neighbor nodes information can improve the accuracy of identifying influential nodes. This shows that the proposed method has more advantages in identifying node influence than DC, BC, K-shell,MCDE,and GSM.
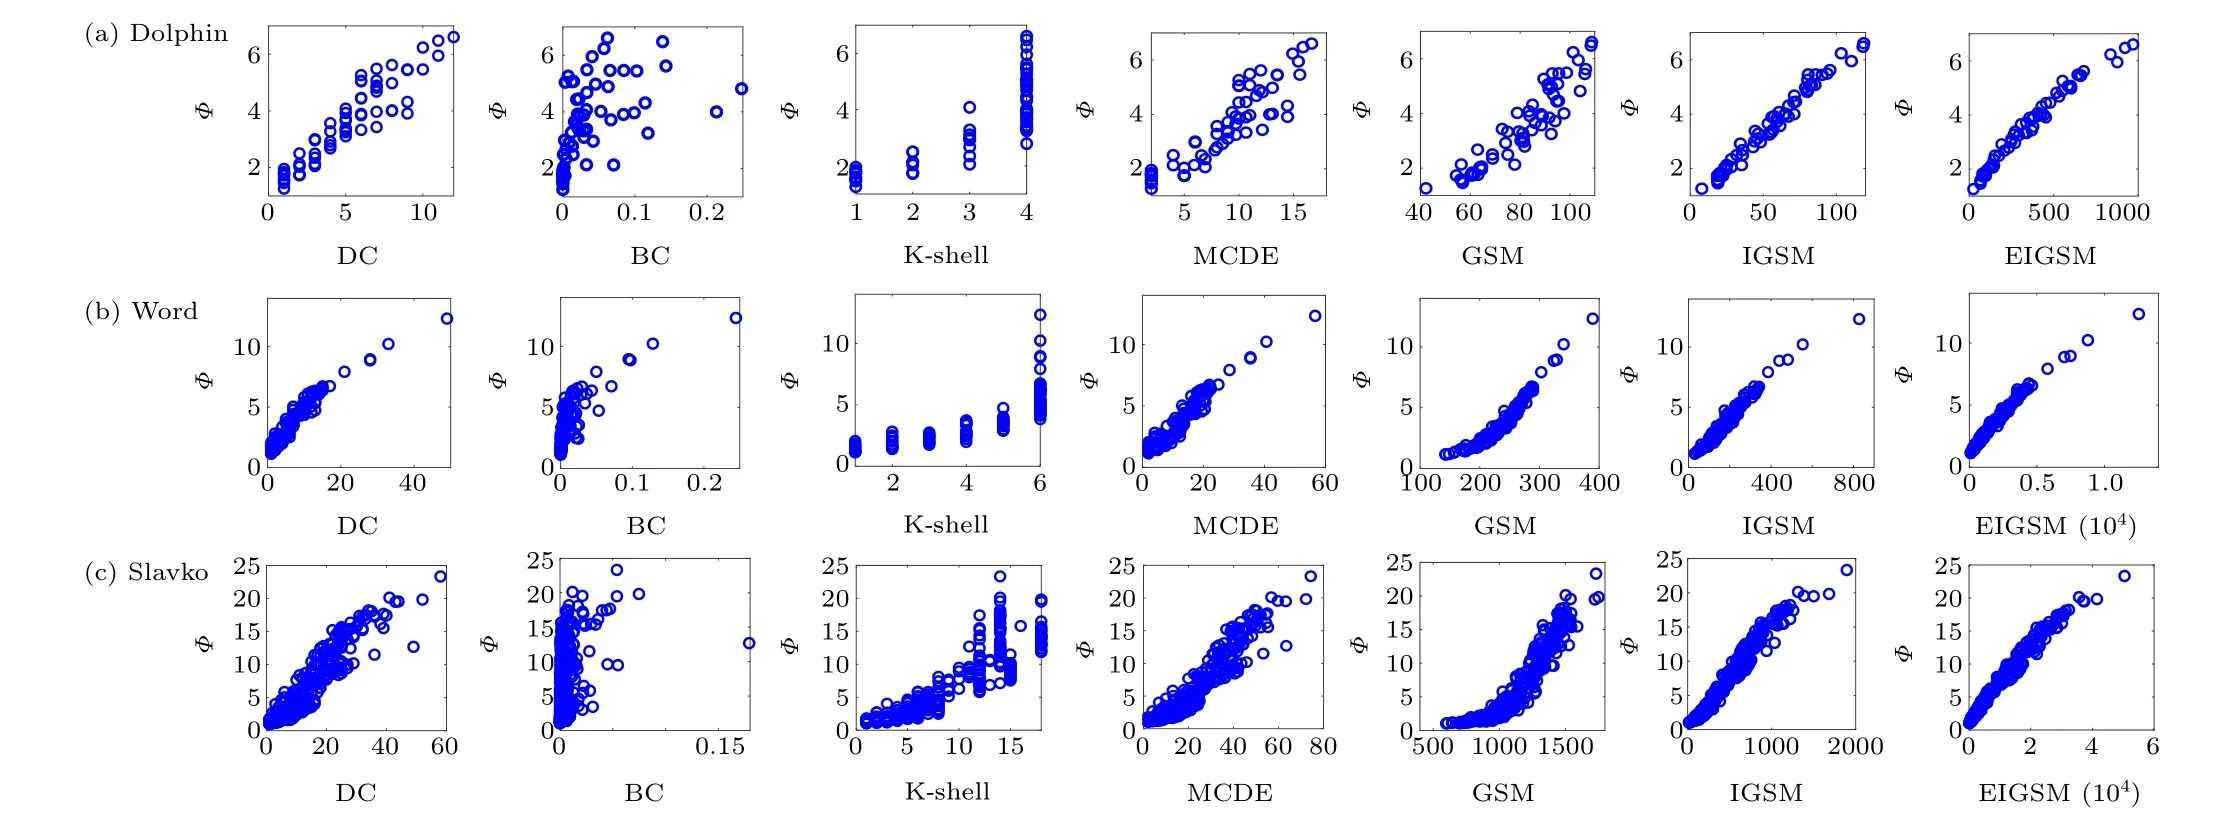
Fig.6. Relationship between each method and node influence.

Fig.7. Correlation between the proposed method and other methods.
4.2.3. Identification effect under certain propagation probability
In order to explore the influence of different propagation probabilities on the accuracy of the method proposed in this paper,the values around the propagation thresholdβthare selected as the propagation probability for the experiments,and the Kendall coefficient was used as the evaluation criterion. The experimental results are shown in Fig. 8. From the figure, it can be seen that BC is always low in several networks,which shows that it is not good at evaluating the propagation influence of the nodes in the network compared to other methods. In the Word, Slavko, Infectious and Email networks, we can see that the Kendall coefficients of the DC and MCDE methods in the early stage are higher. This is because when the propagation probability is small, the information dissemination of the node is easily limited to a small part of the surrounding nodes. At this time, the directly connected nodes are the easiest to receive information from,and the DC and MCDE methods have the closest relationship with the directly connected nodes. If the propagation probability is too small,it is easy to spread only over a local area,and if the propagation probability is too large,it will spread over a large area. From Fig.8,it can be seen that EIGSM always maintains an advantage near the propagation threshold,and the identification accuracy is higher.
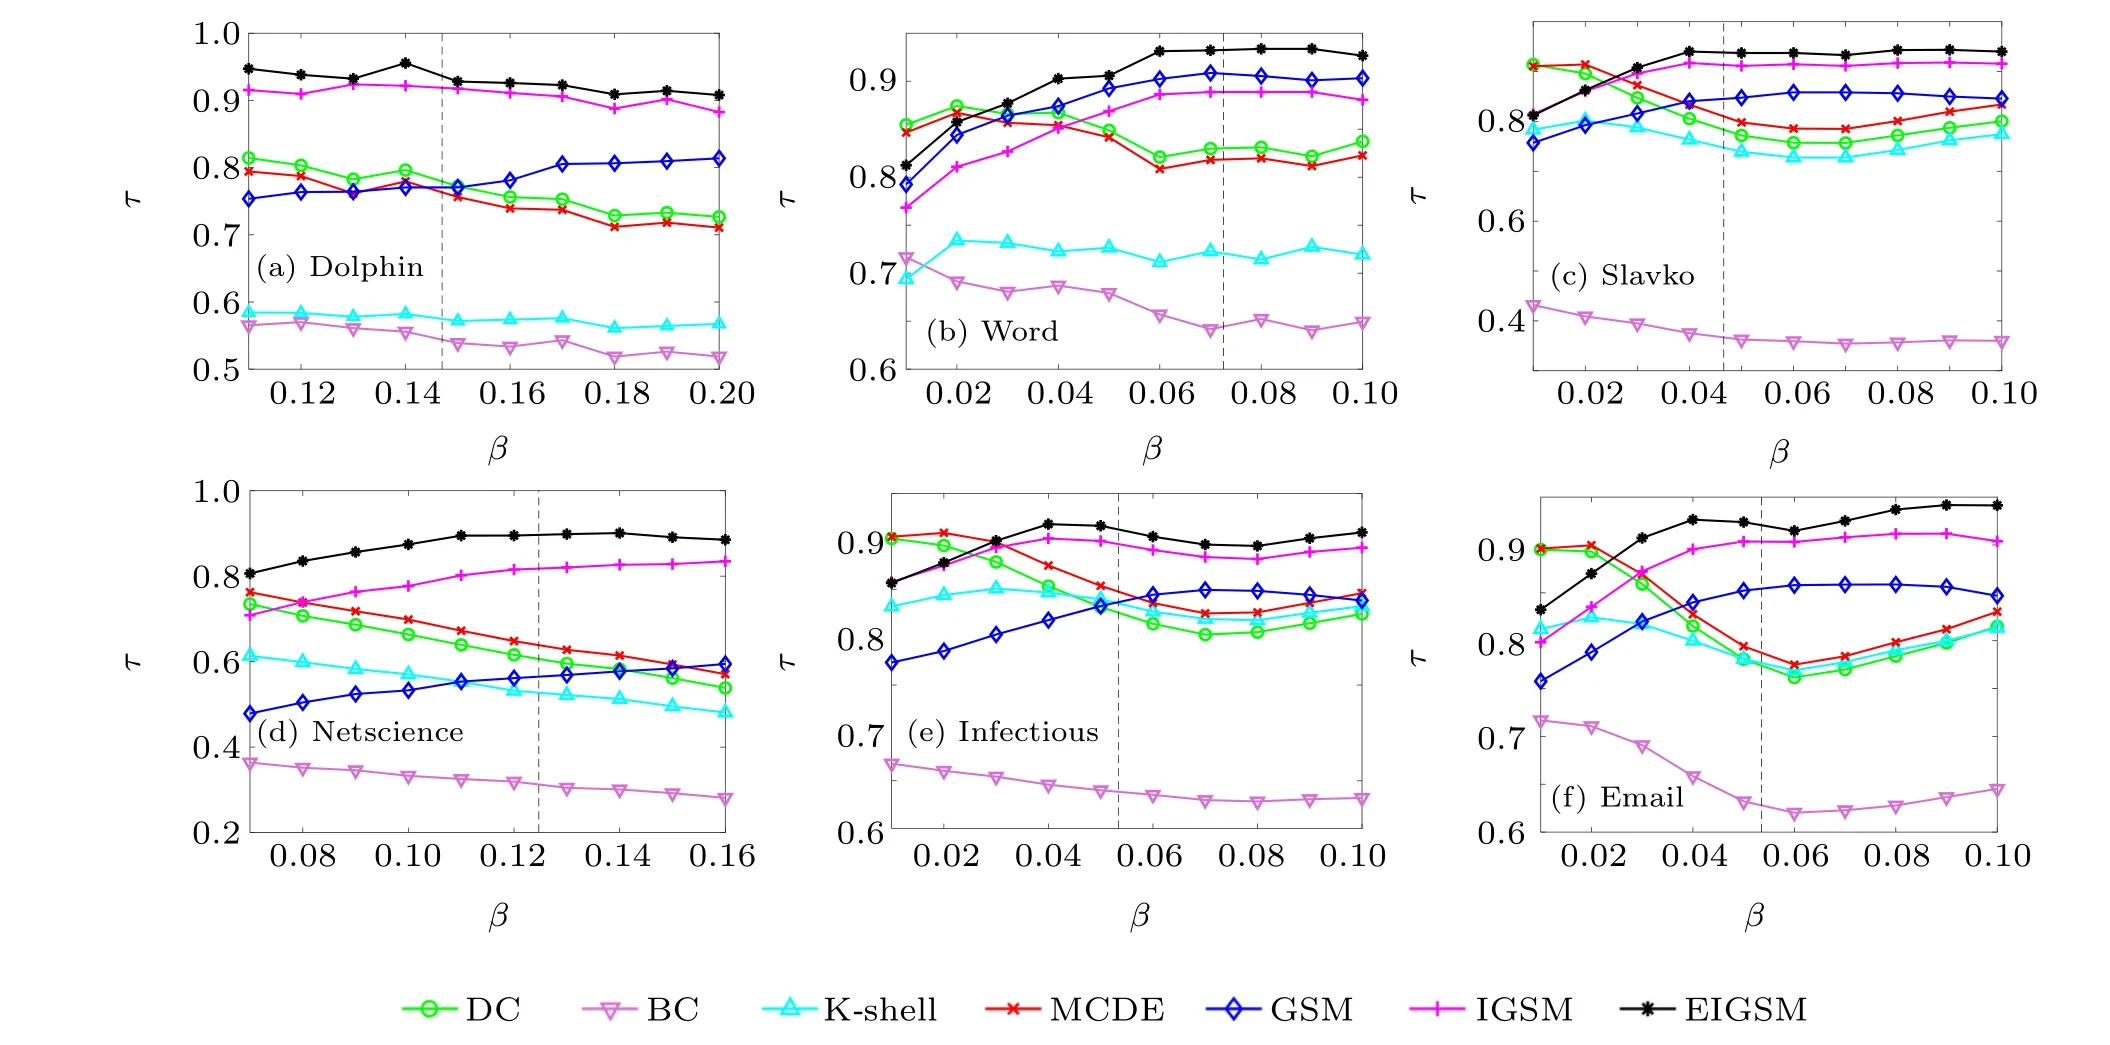
Fig.8. Kendall coefficients between different propagation probabilities and the SIR model.
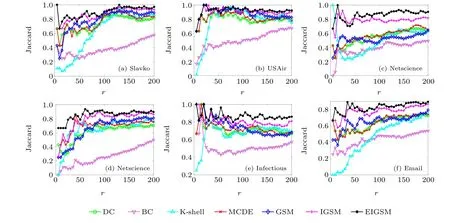
Fig.9. The Jaccard similarity coefficients between each method and the SIR model.
4.2.4. Jaccard similarity coefficient
The most influential nodes form a small part, so we should not only judge the accuracy from the overall perspective but also consider the accuracy of the top nodes. Because the network scale is getting larger and larger, we selected the last six networks with a large number of nodes to do the following Jaccard similarity experiment,as shown in Fig.9. Figure 9 studies the similarity between the simulation results of the SIR model of the forward node obtained by each method through the Jaccard similarity coefficient. The higher the similarity is,the more accurate the result is. Thex-axis represents the number of front nodes, and they-axis represents the Jaccard similarity coefficient. In Fig. 9, with an increase of the number of front nodes, the results tend to be stable. From the results of Fig. 9, we see that BC is located below other methods in most parts, while IGSM and EIGSM are located above other methods. In Slavko, USAir, Infectious, Elegans,and Email networks, we can observe that the similarity coefficient of the K-shell decomposition method is very small at the beginning. With the increase of the abscissa, the similarity coefficient increases. This is because K-shell divides many nodes into the same layer,and the accuracy is limited by the discrimination. Moreover,the larger the network scale is,the closer the connection between the nodes and the surrounding nodes is. Therefore, the problem cannot be considered only from the node itself. In the Netscience network,K-shell has a high point at first because the top-ranking nodes are not only in the core position but also have a relatively large degree value. Then it will begin to decline with the discrimination problem. In the Infectious and Email networks, we can also see that EIGSM is significantly more similar than other methods. Overall, EIGSM can be considered to be more accurate in identifying node influence.
5. Conclusion
This paper studies the problem of identifying influential nodes in complex networks, which is crucial to the study of disease infection and information dissemination. This paper proposes an extended improved global structure model to identify influential nodes in the network.This method first uses the degree centrality information to represent its self-influence and then uses the neighbor layer information to represent the influence of the surrounding information. When considering the neighbor layer information, a path attenuation related to the path length and the average degree is introduced. Finally,the propagation influence of the node is characterized by accumulating the information of the nearest neighbor node. To evaluate the effectiveness of the proposed method, we use the SIR model to simulate the propagation process,and conduct experiments on two main aspects of discrimination and accuracy in multiple real networks. Firstly, we can see that the proposed method avoids the phenomenon that most nodes are defined as the same importance,and it effectively separates the importance of each node. Secondly, in terms of accuracy, it can be seen that the method proposed in this paper has been improved to a certain extent,especially near the curve;it is always better than other methods. About the computational complexity of the proposed method,because the IGSM method is similar to the GSM method,we think that the computational complexity of IGSM is the same as that of GSM,which is O(n2). In addition,EIGSM adds a nearest neighbor information overlay from 1 tonon the basis of IGSM,so we believe the computational complexity of this method can be regarded as O(n2+n);whennis infinite,the computational complexity of this method can also be regarded as O(n2). Overall, the experimental results show that the proposed method in this paper has more advantages than other methods in identifying influential nodes.
Acknowledgment
Project supported by the National Natural Science Foundation of China(Grant No.11975307).
杂志排行
Chinese Physics B的其它文章
- Ergodic stationary distribution of a stochastic rumor propagation model with general incidence function
- Most probable transition paths in eutrophicated lake ecosystem under Gaussian white noise and periodic force
- Local sum uncertainty relations for angular momentum operators of bipartite permutation symmetric systems
- Quantum algorithm for neighborhood preserving embedding
- Vortex chains induced by anisotropic spin–orbit coupling and magnetic field in spin-2 Bose–Einstein condensates
- Short-wave infrared continuous-variable quantum key distribution over satellite-to-submarine channels
