Improving sound diffusion in a reverberation tank using a randomly fluctuating surface
2022-06-29QiLi李琪DingdingXie谢丁丁RuiTang唐锐DajingShang尚大晶andZhichaoLv吕志超
Qi Li(李琪) Dingding Xie(谢丁丁) Rui Tang(唐锐) Dajing Shang(尚大晶) and Zhichao Lv(吕志超)
1Acoustic Science and Technology Laboratory,Harbin Engineering University,Harbin 150001,China
2Key Laboratory of Marine Information Acquisition and Security(Harbin Engineering University),Ministry of Industry and Information Technology,Harbin 150001,China
3College of Underwater Acoustic Engineering,Harbin Engineering University,Harbin 150001,China
4College of Information Science and Engineering,Ocean University of China,Qingdao 266100,China
Keywords: sound diffusion,reverberation tank,randomly fluctuating surface,acoustic measurements
1. Introduction
1.1. Basic understanding of diffusion
In underwater acoustics,it is important to precisely measure and evaluate the acoustic characteristics of underwater targets,including the sound power radiated by marine propulsion systems as well as the noise from submarines and other underwater vehicles. However, doing this in seas or lakes is expensive,which is why alternative laboratory-based measurement methods are particularly needed. Compared with anechoic pools, measurements in reverberation tanks provide a more efficient and cheaper means of understanding the characteristics of underwater sources. When focusing on the power spectrum of a sound source with directivity, many sampling points are needed in a free field. The cost of constructing an anechoic tank (including the absorption materials) is higher than that of constructing a reverberation tank. Moreover, reverberation tanks offer a wider range of frequencies for accurate measurements because the absorption coefficient of anechoic tanks is too low in the low-frequency band to achieve free-field conditions. Therefore,the use of reverberation tanks to measure underwater acoustic parameters accurately is worth investigating.
Measurements of the reverberation time, characteristics of material absorption and radiated sound power as well as calibrations of the sensors in reverberation enclosures are based on the assumption of a diffuse field.[1]From the perspective of random wave theory, a perfectly diffuse sound field is regarded as a superposition of free propagating plane waves,and it satisfies two essential conditions: (i) the plane waves from all directions must have random relative phases;(ii)the directions of propagation of the plane waves must be distributed uniformly over all angles of incidence.[2–4]
Because the actual reverberant sound field is not a perfectly diffuse field, Lubman used spatial averaging techniques in acoustic measurements in reverberation chambers,
whereby the sound pressure of the sound field is sampled and averaged.[5,6]If sufficient averaging is applied,the sound field is sufficiently diffuse above the Schroeder frequency.[7]Blake conducted the same acoustic experiments in a reverberation enclosure filled with either air or water, and found that compared with air as the medium, the spatial fluctuations were larger in the water medium, which shows the difficulty in achieving adequate diffusion of the reverberant field in underwater applications.[8]From techniques developed previously for air acoustics, Cochard derived a way to measure the radiated noise of underwater sources in test tanks based on the assumption that the reverberant field is isotropic and homogeneous above the Schroeder frequency,but the measured results for pure frequencies were unsatisfactory because there was no mode mixing.[9]Liet al.applied spatial averaging to underwater measurements of the radiated sound power of underwater sound sources.[10–12]However, the large spatial fluctuations required either many sampling points(for disperse spatial averaging)or a long sampling time(for continuous spatial averaging)to achieve sufficient diffusion above the Schroeder frequency,thereby increasing either the cost of transducers or the time taken. Therefore, it is necessary to find another way to improve diffusion in reverberation tanks and realize accurate narrow-band measurement with lower costs.
In the case of reverberation chambers, various diffusers have been proposed to improve diffusion.[13]Tichyet al.showed that rotating and moving diffusers can produce frequency and amplitude modulation while reducing the spatial fluctuation of the reverberant sound field, which helps determine the radiated sound power.[14,15]In the case of reverberation tanks, Rosny studied diffuse reverberant acoustic wave spectroscopy inside a reverberant water tank filled with absorbing scatterers—spheres made of different materials—to understand the propagation of transient ultrasonic waves.[16]However,because there are many differences between air and water(e.g.,resistance and sound speed),rotating and moving diffusers that are used widely in air acoustics cannot be used directly in water tanks. To the best of our knowledge, there have been few studies on improving diffusion using diffusers.Herein, we propose a method for improving the diffusion of the sound field in a reverberation tank by using a randomly fluctuating surface,which is convenient in terms of both operation and application. In underwater acoustics, many studies involving a rough or random surface are concerned with its scattering properties and how it influences the sound propagation in an ocean sound field instead of focusing on diffusion in a reverberation tank.[17–20]
1.2. Methods for evaluating diffusion
Waterhouse showed that as the experimental conditions approached the ideal prescription of uniform incidence and random phase at any point,the energy density would approach uniformity.[2]N´elisse used the spatial uniformity of the pressure field as a practical and convenient tool for studying the diffuse field in a room.[21]In underwater acoustics, the frequency resolution of a line spectrum should be as high as possible. When considering a narrow-band reverberant sound field, the spatial uniformity is improved on the condition that the relative phase becomes more random;therefore the spatial uniformity is an effective indicator for evaluating the diffusion of the sound field in an enclosure.
Nolanet al.proposed an effective method to characterize diffuse field conditions in steady and decaying reverberant sound fields by expanding the wavenumber spectrum obtained by a spatial Fourier transform into a series of spherical harmonics and using the moments from this spherical expansion to evaluate the isotropy of the wave field.[22,23]Also,estimation of the wavenumber spectrum was used to analyze the acoustic absorption characteristics and measure the angledependent absorption coefficient in a standardized reverberation chamber.[24,25]
Several other methods can be used to evaluate diffusion.Gover analyzed the spatial variations in a reverberant sound field and estimated the diffusion by using a spherical directional microphone array to measure the acoustic signals in different directions.[26,27]Rafaely provided a generalized derivation of the spatiotemporal correlation of a diffuse field that can be used for stationary random signals with a given power spectral density,[28]but N´elisse found that the correlation function is largely insensitive to deviations from perfect diffusion.[21]Galdo proposed a method for estimating diffusion using the temporal variation in the intensity vector and derived a diffusion estimator based on sound intensity,[29]and G¨otz used this estimator to measure the process of sound field diffusion in an enclosure when predicting the mixing time using spherical microphone arrays.[30]Epain presented a measure of diffuseness based on analysis of the spherical harmonic signal covariance matrix,which is suitable for situations in which multiple sources are distributed around the spherical microphone array or a diffuse noise background exists.[31]Jeong and Prislan used the kurtosis and sensitivity of room impulse responses as a measure of diffuseness for reverberation chambers.[32,33]
In this paper, the spatial uniformity of the absolute pressure field and analysis of the wavenumber spectrum in the spherical harmonics domain are used together to evaluate diffusion in a reverberation tank. The remainder of this paper is organized as follows. The theoretical background is presented in Section 2, and the validity of a randomly fluctuating surface for improving diffusion is verified from the two aspects of uniformity and isotropy based on an experimental study in Section 3.
2. Theory
Considering a steady-state pure-tone sound field in a reverberation enclosure, random wave theory describes the sound field as an infinite superposition of plane waves with random phase from random directions,[3]i.e.,

whererm=(x,y,z) is the position vector,P(rm) is the complex sound pressure at positionrm,kn= (kx,ky,kz) is the wavenumber vector andP(kn) is the complex coefficient of each plane wave’s traveling directionkn.
2.1. Uniformity indicator
When considering finite superposition of plane waves,the sound pressure of the synthetic sound field can be written as Eq.(2),and the mean square sound pressure can be written as Eq.(3),where*is the conjugate symbol:[34]
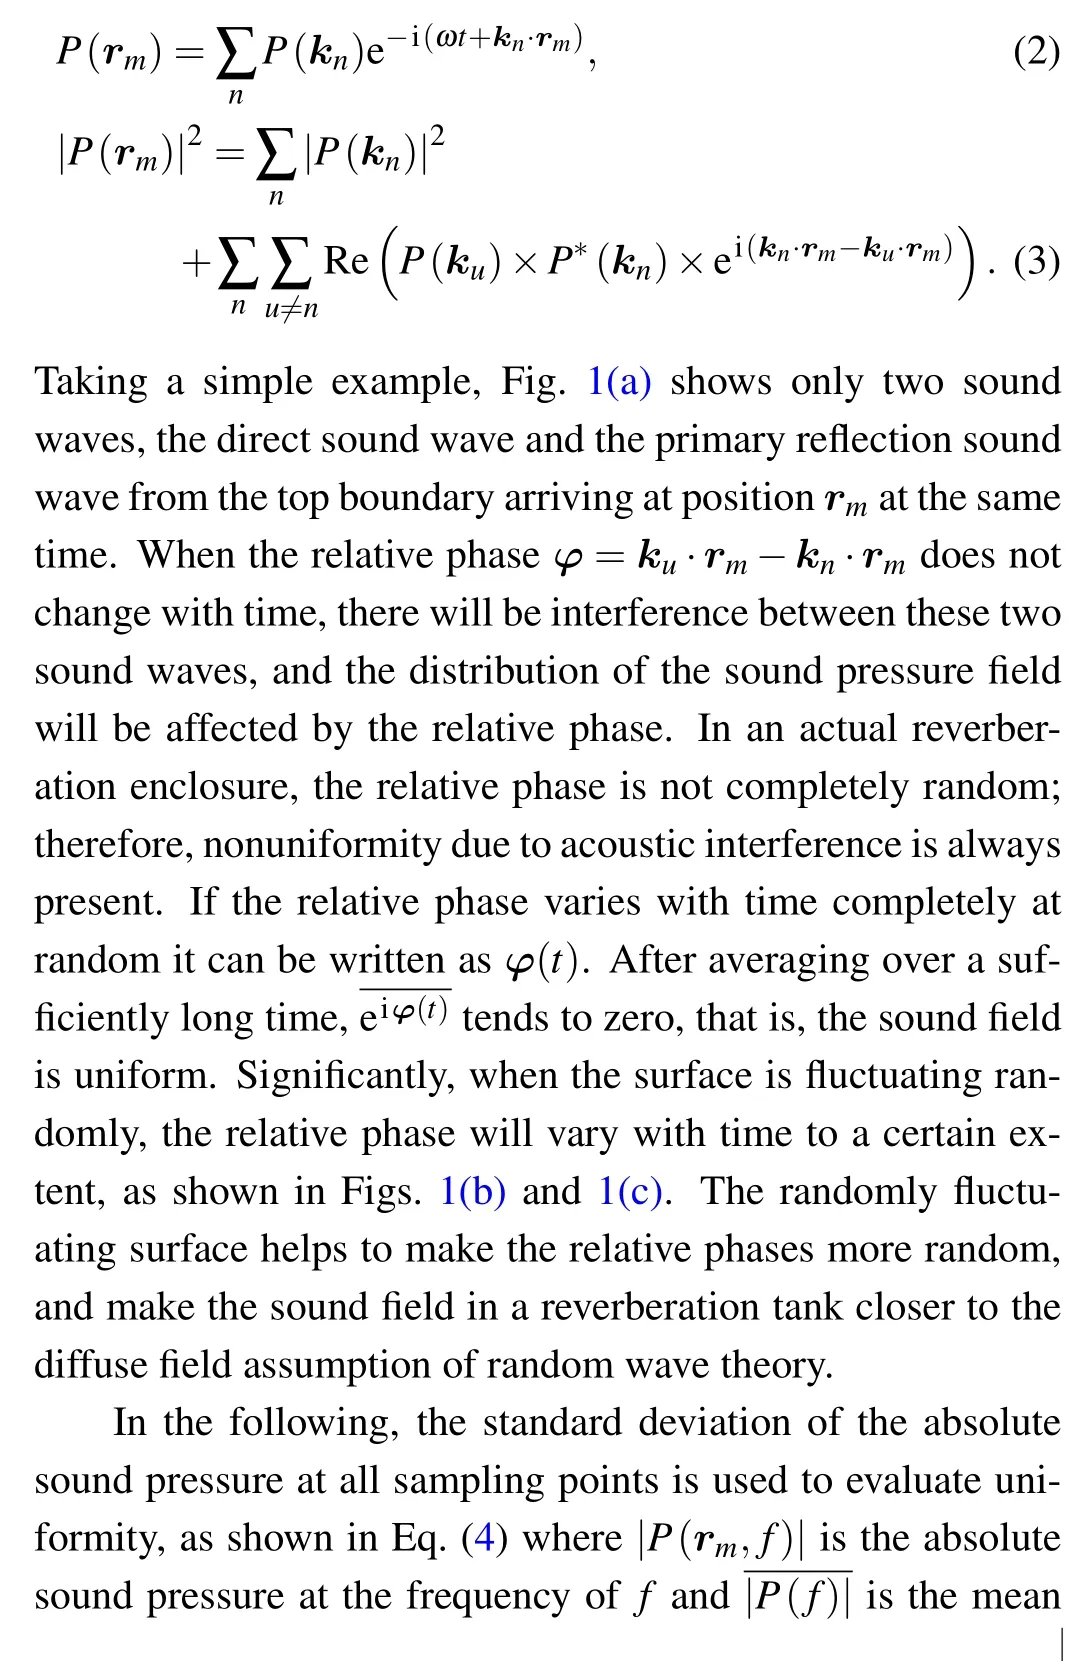

If the sound field is completely uniform, the sound pressure should be equal everywhere. Smaller standard deviations of the absolute sound pressure indicate a more uniform sound field.

Fig. 1. Simplified diagrams of ray trajectories in the cases of (a) a steady surface,(b)a random surface at t1 and(c)a random surface at t2.
2.2. Isotropy indicator
Ignoring the term e-iωt,Eq.(1)can be written in the form of a three-dimensional inverse Fourier transform,as shown in Eq.(5),whereP(k)is the angular wavenumber spectrum:[35]

For the sound field produced by a pure-tone with frequencyf0, introducing spherical coordinates givesx=rsinϑcosφ,y=rsinϑsinφ,z=rcosϑ, andkx=ksinθcosφ,ky=ksinθsinφ,kz=kcosθ. If the pressure distribution is measured over a spherical surfacerm=(r,ϑ,φ),then Eq.(5)can be represented by

Because the wavenumber spectrum characterizes the magnitudes of the sound waves arriving from definite directions at the observation point,[35]if the wavenumber spectrum is spherically symmetric, that is, incident plane waves have uniform energy distribution over all angles of incidence,then the wave field is termed isotropic.[22]As shown in Figs. 1(b)and 1(c),because adding a randomly fluctuating surface helps to change the reflection direction of sound rays and the subsequent multiple reflections make the sound rays propagate more randomly, the incident sound energy will be distributed over more angles and the isotropy will be improved.
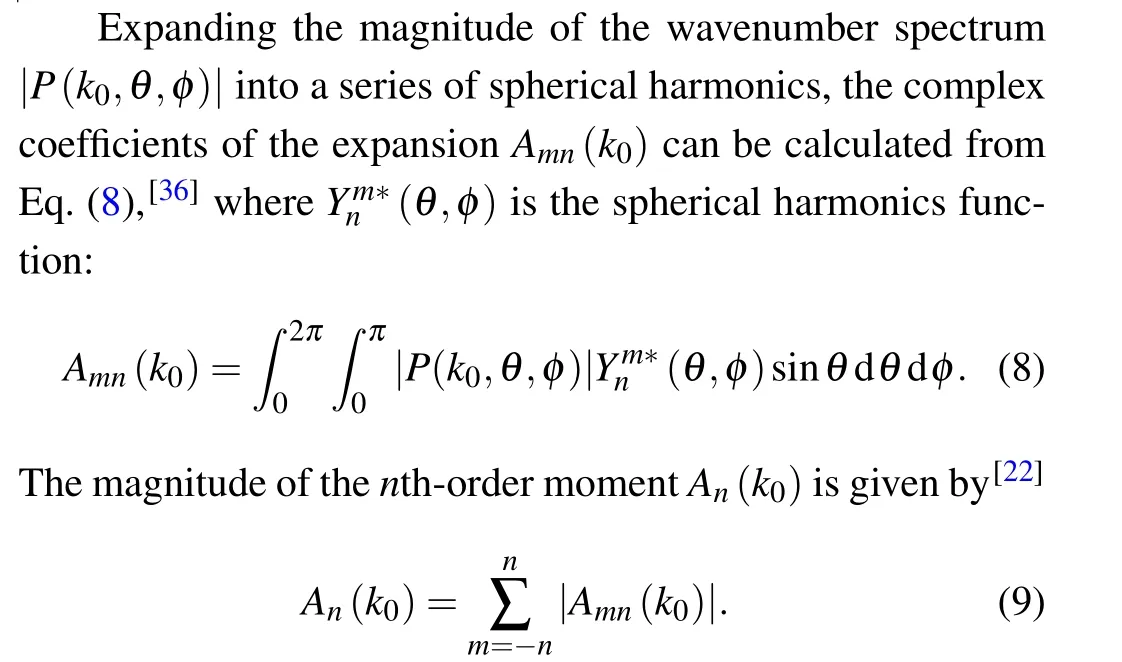

Generally, the higher the isotropy indicator, the better the isotropy of the sound field.
In summary,two indicators are used in this paper to evaluate the diffusion in reverberation tanks: (i)the standard deviation of the absolute sound pressure field describes the uniformity and(ii)the analysis of the wavenumber spectrum in the spherical harmonics domain describes the isotropy.
3. Experiments in a test tank
3.1. Measurement system
Experiments were conducted in a tank made of glass measuring 1.2 m×1.0 m×0.8 m. The water temperature was 25°C and the sound speed in water was 1500 m/s. The water was left standing in the tank for a week to eliminate air bubbles that could have caused scattering.
A signal generator (Agilent 33522A) was connected to a power amplifier (B&K 2713) whose gain was set to 30 dB to ensure an appropriate signal-to-noise ratio, and a spherical omnidirectional underwater sound source(homemade,the sound power level is shown in Appendix B)was driven to emit a broadband noise signal (0 kHz–25.6 kHz). The signals detected by hydrophones (RHC-7) exhibiting good consistency were collected by a PULSE system(B&K 3052)and saved as sound pressure–time signals in a computer. The measurement system and equipment layout are shown in Fig.2.

Fig.2. Diagram of(a)the measurement system and(b)the top view of the equipment layout.
A small water pump with paddles,as shown in Figs.3(c)and 3(d), was used to produce waves (the background noise levels are shown in Appendix A). The flow rate of this water pump was 12 m3/h. The waves generated in the glass tank had wavelengths of about 0.05 m–0.15 m,as shown in Fig.3(b).
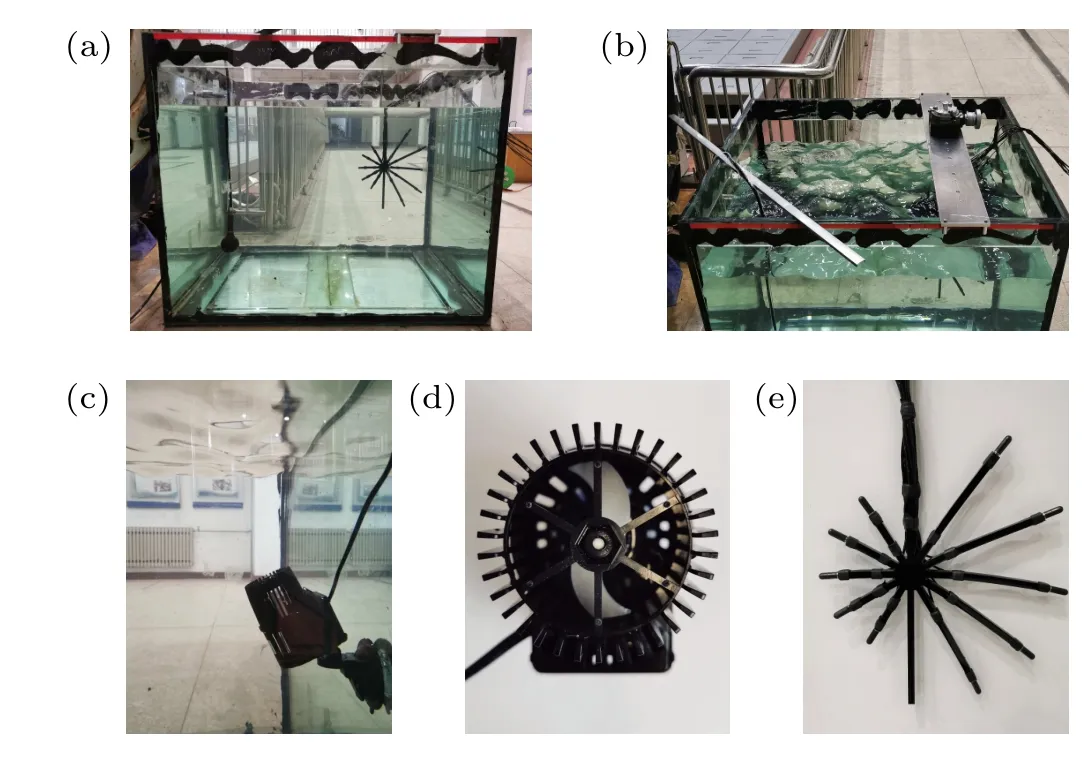
Fig.3.Photographs of the experimental equipment:(a)arrangement of transducers,(b)randomly fluctuating surface,(c)arrangement of water pump,(d)water pump,(e)hydrophones and holder.
Ten hydrophones were fixed in a holder with rods of length 0.1 m on one side and 0.2 m on the other side [see Figs. 3(a) and 3(e)]. In this experiment, only the signals received by the five hydrophones on the 0.2 m rods were analyzed. Because the acoustic impedance of polyurethane[2.1×10⁶kg/(m2·s)] is similar to that of water [1.5×10⁶kg/(m2·s)], we assume that the scattering effects of rods made of polyurethane can be ignored. The angle between two adjacent rods was set to 30°, and a rotator on the top of the hydrophone holder ensured precise control of the rotation angle. The holder was rotated by 15°at a time, and the signals were collected at each interval. After a complete revolution,the 120 sets of sound pressure signals from the hydrophones on the 0.2 m rods were sampled.
3.2. Analysis of uniformity
The length of the sampling signals was 30 s. Each signal was divided into 30 1 s segments,and a Fourier transform was applied to obtain 30 sets of sound pressure–frequency signalsP(l,r,f) with a frequency resolution of 1 Hz, wherelis the number of sets. The 30 sets of sound pressure–frequency signals from the 120 points on the sampling sphere with a radius of 0.2 m were processed using to obtain curves of the root-mean-square sound pressure at the 120 sampling points.

In the following experiments,we focused on frequencies above 8 kHz. The root-mean-square sound pressure curves at one position with a steady surface and with a fluctuating surface are shown in Fig. 4. As an effect of the emission characteristics of the sound source,sound pressure increases with increasing frequency. Comparing the two scenarios,it is clear that the fluctuation of sound pressure is reduced significantly when the surface is fluctuating randomly.
For each frequency, there are 120 sets of sound pressure data on a sampling sphere with a radius of 0.2 m. When the frequency is 10 kHz, the absolute sound pressure sphere in the spherical coordinate system can be plotted by nearestneighbor interpolation,as shown in Figs.5(a)and 5(b). When the frequency is 20 kHz, the absolute sound pressure spheres of the two scenarios are as shown in Figs.5(c)and 5(d).
Clearly,at the two frequencies with a steady surface there are obvious interference patterns on the sound pressure sphere,indicating poor uniformity(the uniformity indicator is 0.38 Pa at 10 kHz and 1.17 Pa at 20 kHz). When the surface is fluctuating randomly,the fluctuations in the sound pressure field are reduced significantly,and the interference is no longer prominent,which indicates better uniformity(the uniformity indicator is 0.29 Pa at 10 kHz and 0.72 Pa at 20 kHz).

Fig.4. Sound pressure curves at one position for(a)a steady surface and(b)a randomly fluctuating surface.
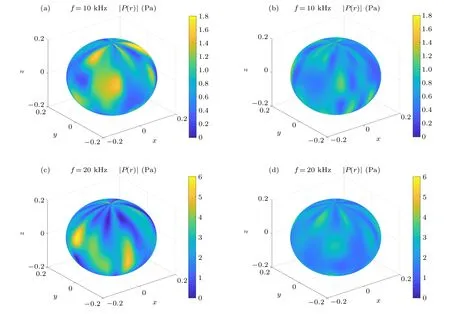
Fig. 5. Absolute sound pressure spheres in the spatial domain for (a) a steady surface at a frequency of 10 kHz, (b) a randomly fluctuating surface at a frequency of 10 kHz,(c)a steady surface at a frequency of 20 kHz and(d)a randomly fluctuating surface at a frequency of 20 kHz.

Fig.6. Curves of uniformity indicator with a bandwidth of(a)1 Hz and(b)100 Hz.
For the two scenarios,the standard deviation of the absolute sound pressure at different positions obtained by Eq. (4)is illustrated with respect to frequency in Fig.6(a). The rootmean-square values of the sound pressure at a bandwidth of 100 Hz were calculated, and the standard deviation of these values at different positions is used as the uniformity indicator at the corresponding center frequency. The uniformity indicator at a bandwidth of 100 Hz is plotted at different center frequencies in Fig. 6(b). Figure 6(a) shows clearly that the uniformity of the sound field improves markedly when the surface is fluctuating with a frequency greater than 10 kHz. Figure 6(b) shows that as the bandwidth widens, the uniformity of the sound field improves regardless of the surface type.
3.3. Analysis of isotropy
Dividing each signal into 30 segments again, for each frequency from 8 kHz to 25.6 kHz, the sound pressure signalsP(l,r,f)were transformed to the wavenumber domain asP(l,k,f)(the sampling intervals of the polar and azimuthal angles,Δθand Δφ,are bothπ/30)using Eq.(7). The 30 sets of wavenumber spectra were then processed using

to obtain the root-mean-square sound pressure in the sphere of the wavenumber domain for each frequency.
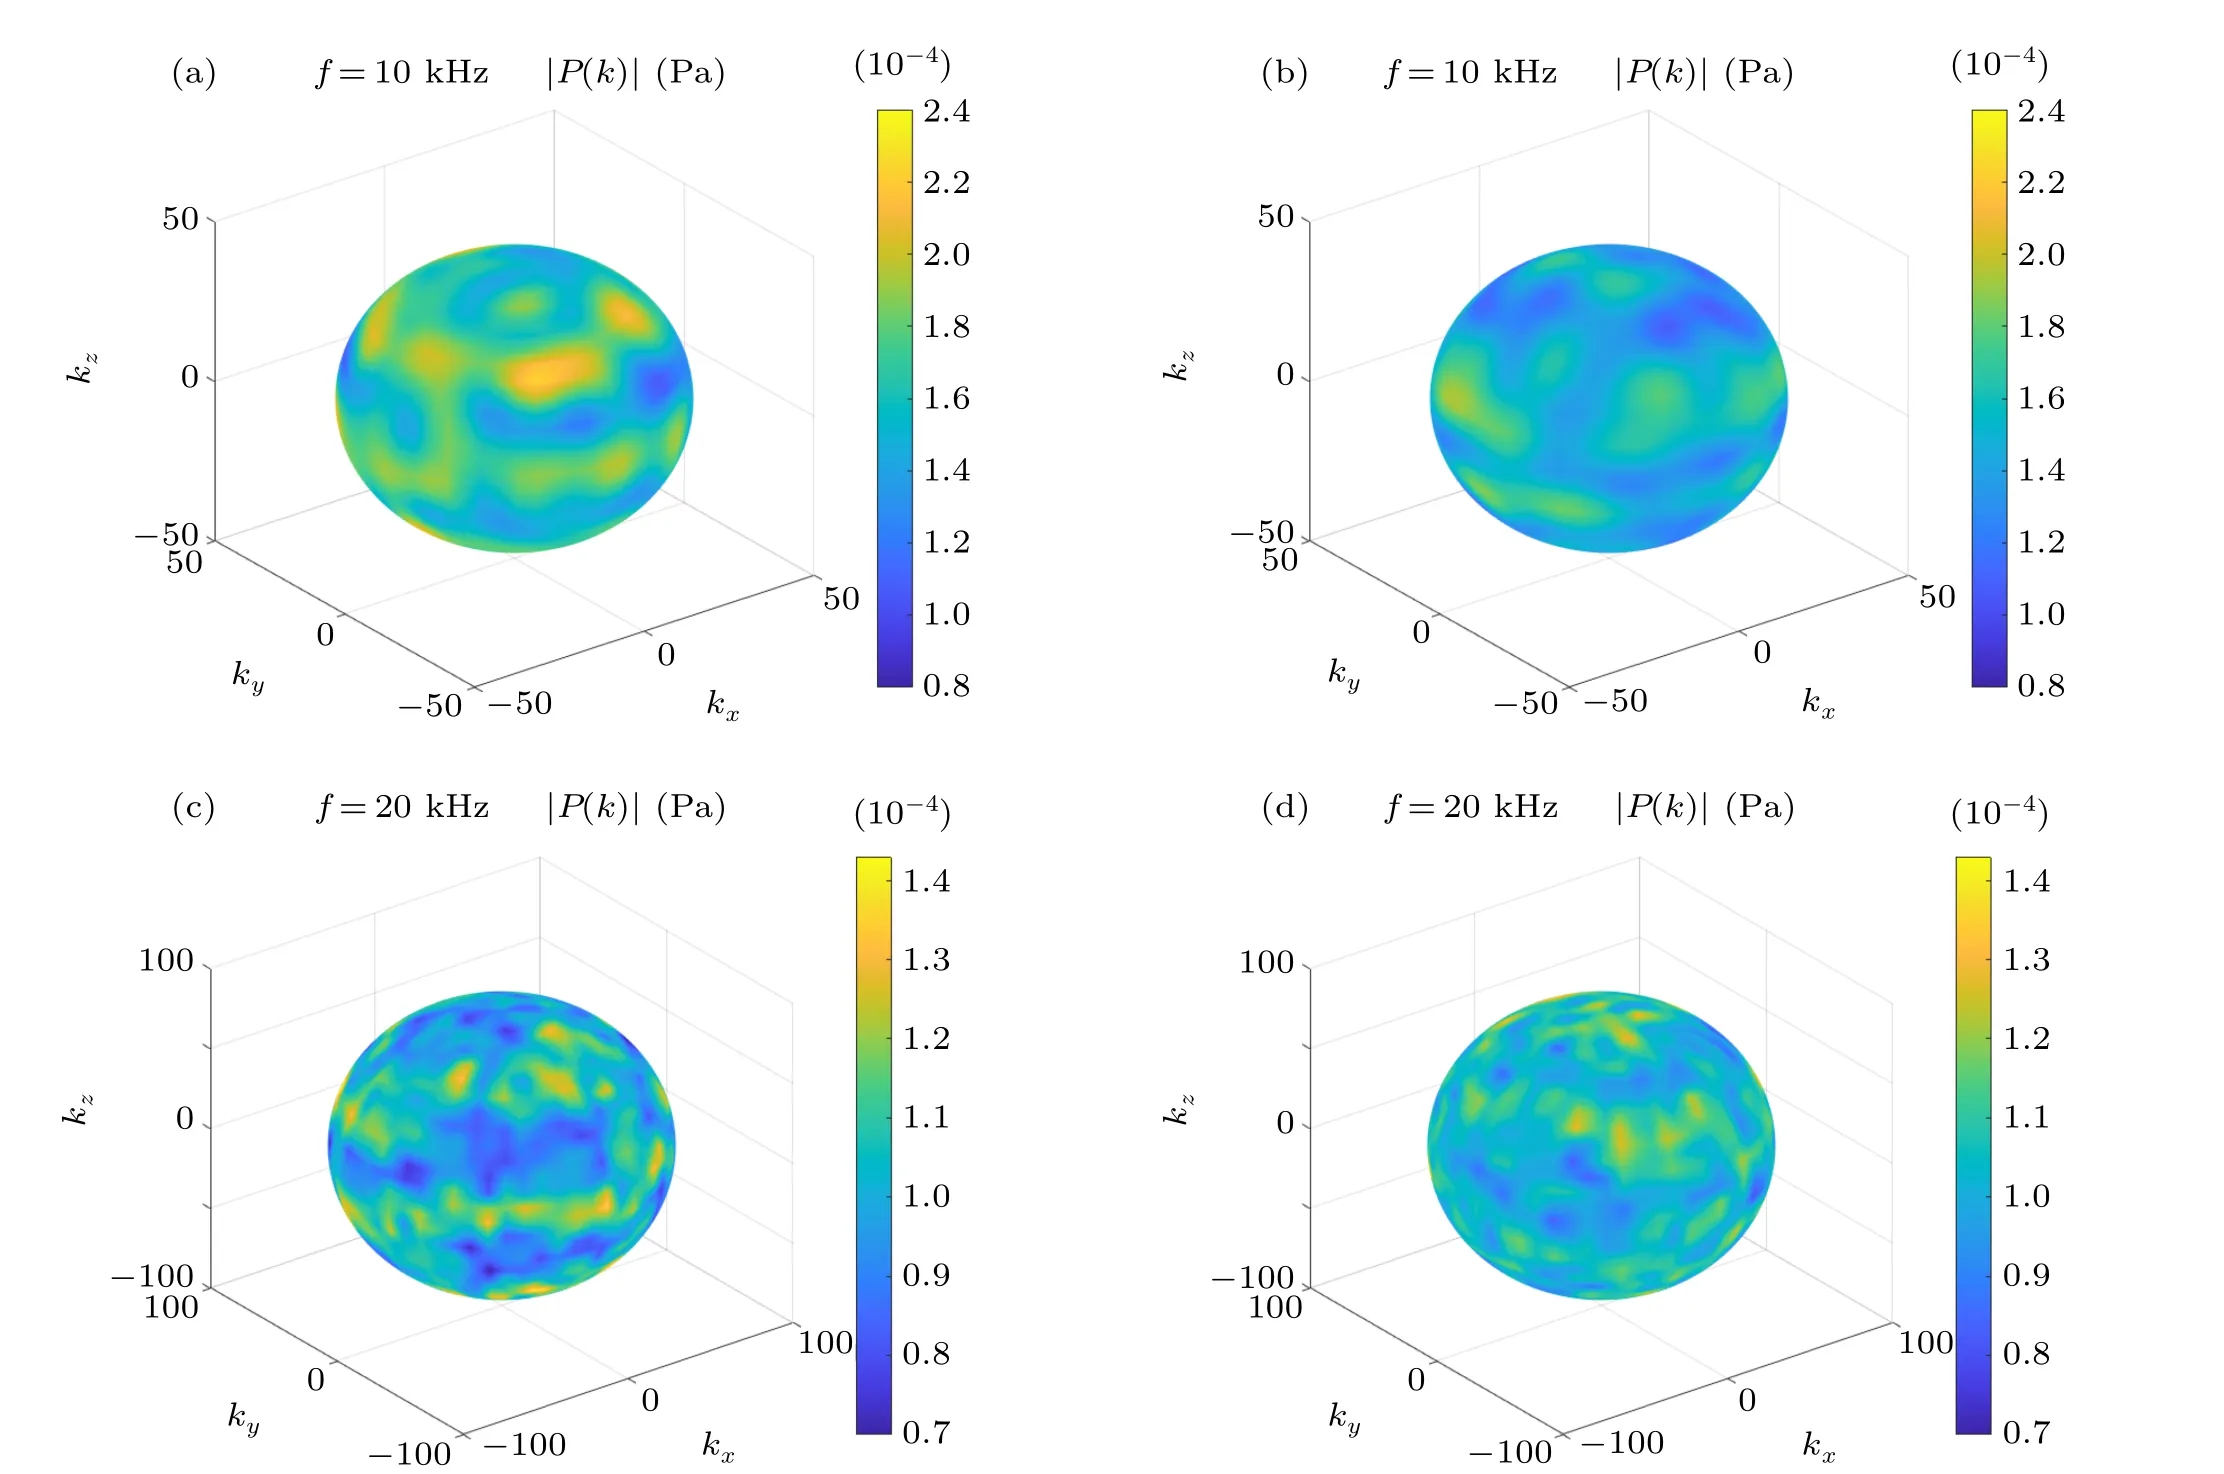
Fig.7. Absolute sound pressure sphere in the wavenumber domain for(a)a steady surface at a frequency of 10 kHz,(b)a randomly fluctuating surface at a frequency of 10 kHz,(c)a steady surface at a frequency of 20 kHz and(d)a randomly fluctuating surface at a frequency of 20 kHz.
For instance, the absolute sound pressure spheres in the wavenumber domain at frequencies of 10 kHz and 20 kHz with a steady surface and random surface were plotted by nearestneighbor interpolation, as shown in Fig. 7. At these two frequencies,when the surface is steady,the wavenumber spectra have obvious bright and dark parts, indicating a large energy flow in some particular directions and poor isotropy. When the surface is fluctuating, the sound rays no longer propagate in specific directions but propagate randomly in other directions. Therefore, there is no longer obvious sound pressure fluctuation in the wavenumber domain,which indicates better isotropy.
Then, by expanding the magnitude of the wavenumber spectrum into a series of spherical harmonics,the isotropy indicatori(k0) is calculated using Eqs. (8)–(10). The spherical harmonic expansion was truncated atn=10. The isotropy indicator with respect to frequency for the two scenarios is shown in Fig.8(a). The root-mean-square values of the sound pressure in the wavenumber domain at a bandwidth of 100 Hz were calculated and used to obtain the isotropy indicator at the corresponding center frequency. The isotropy indicator at a bandwidth of 100 Hz is shown in Fig.8(b). Analysis of these figures shows that regardless of whether the bandwidth was 1 Hz or 100 Hz,the isotropy of the sound field improved when the surface was fluctuating with a frequency above 10 kHz.If the bandwidth widens, then the isotropy of the sound field improves.
The above analysis shows that generating randomly fluctuating waves on the surface of the water contributes to the random reflection of sound rays in all directions and helps to improve both the uniformity and isotropy.
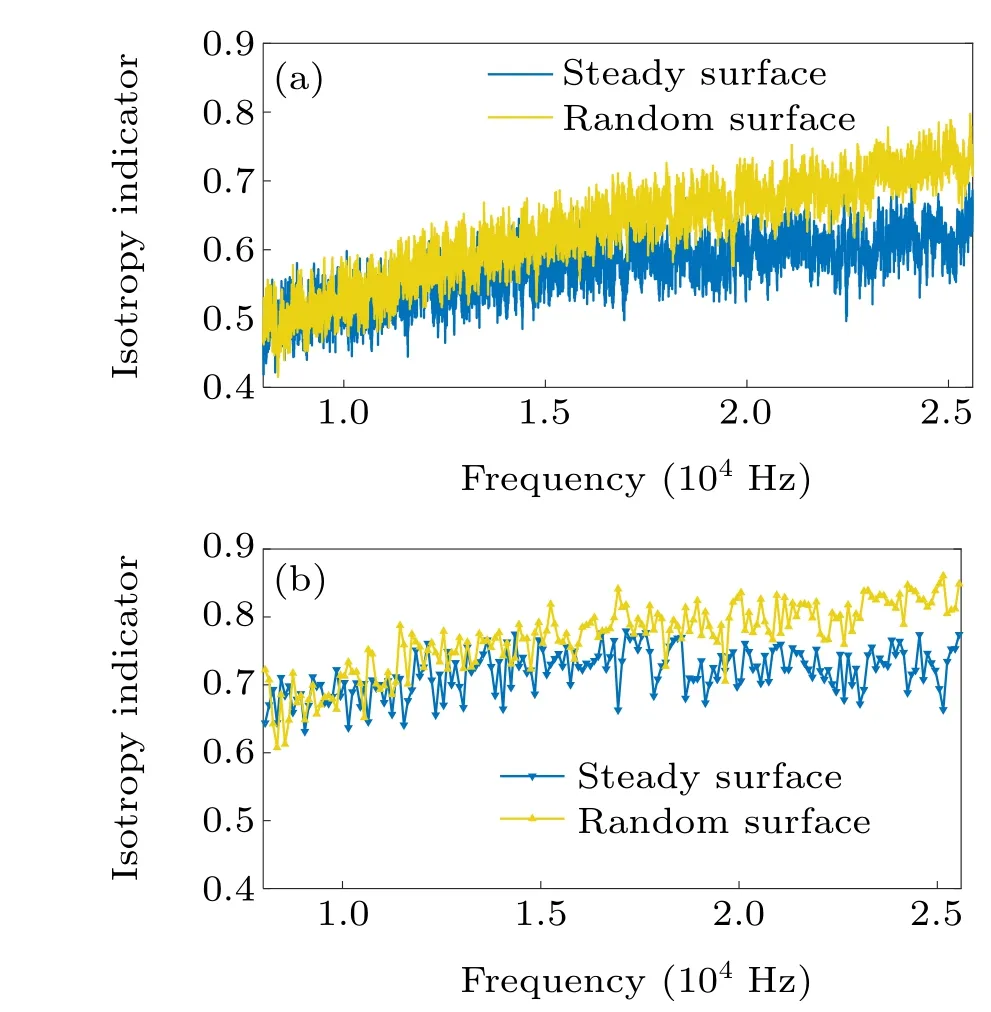
Fig.8. Curves of the isotropy indicator with a bandwidth of(a)1 Hz and(b)100 Hz.
4. Discussion and conclusion
In this work,a randomly fluctuating surface was proposed as an effective means of improving narrow-band diffusion in a reverberation tank. As a key issue, the randomly fluctuating surface was generated by making waves on the water surface of the tank. It was found that when the wavelengths of the sound and water waves were close to each other, the randomly fluctuating surface markedly improved the diffusion in the reverberation tank. The waves could be generated by means other than the water pump used in the present experiments; for example, the wave machines that are often used in swimming pools would be feasible for making large-scale waves that in turn are conducive for improving diffusion at low frequencies. For various measurement needs (e.g., target scale, frequency range), there is flexibility in choosing a reverberation tank of the appropriate size and then using the appropriate method to make waves with the appropriate wavelength. Future research will involve exerting precise control over wave parameters (e.g., amplitude, period) by means of adjustable equipment and studying the quantitative influence of doing so on acoustic measurements. Besides, appropriate roughness can be added to the sidewalls of the tank or pool for the further improvement of sound diffusion.
In summary,this paper analyzed the sound diffusion in a reverberation tank, using two practical indicators: uniformity(evaluated by the standard deviation of the absolute pressure field)and isotropy(evaluated by the analysis of the wavenumber spectrum in the spherical harmonics domain). Experiments were conducted in a tank of size 1.2 m×1 m×0.8 m with a steady surface and a randomly fluctuating surface,and the results showed that in the analyzed frequency band,when the surface was fluctuating randomly with wavelengths of about 0.05 m–0.15 m, the uniformity and isotropy were both improved above a frequency of 10 kHz. These two indicators support each other in that the randomly fluctuating surface significantly improves the diffusion of the sound field and considerably improves the capability of measuring underwater acoustic characteristics in reverberation tanks. Appendix C shows the improvement of randomly fluctuating surface on measurements of sound power in a reverberation tank.
Acknowledgment
Project supported by the National Natural Science Foundation of China(Grant No.11874131).
Appendix A:Analysis of background noise
The background noise levels were measured in the following two scenarios: when the water pump is not working and the water pump is working. The noise produced by the water pump is meanly in the low-frequency range. As shown in Fig.A1,the background noise level was no more than 70 dB in both scenarios above the frequency of 8 kHz.

Fig.A1. Background noise levels for(a)a steady surface and(b)a randomly fluctuating surface.
Figure A2 shows the sound pressure levels measured at one position in the reverberation tank without and with the water pump. Above a frequency of 8 kHz,the sound pressure levels in the two scenarios were generally more than 100 dB,which ensures that the signal-to-noise ratio is enough for the measurements.
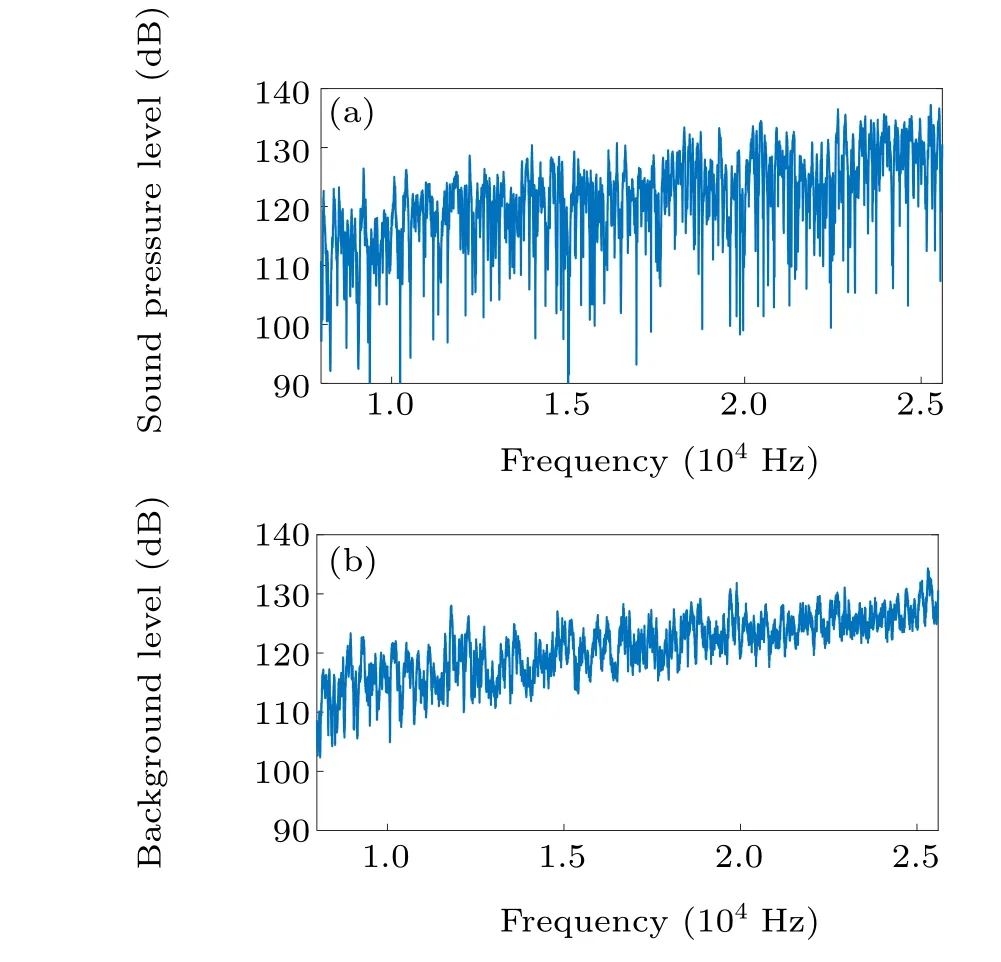
Fig. A2. Sound pressure levels for (a) a steady surface and (b) a randomly fluctuating surface.
Appendix B:Measurement of sound power level in an anechoic pool
When an omnidirectional source radiates sound energy uniformly in all directions, the sound power is given by the following equation,whereRis the distance between the sound source and the observation point:

The radiated sound power was measured in an anechoic pool[see Fig. B1(a)], with a size of 25 m×15 m×10 m and a lower-limit frequency of 2 kHz.The spherical omnidirectional underwater sound source was driven to emit a broadband noise signal (0 kHz–25.6 kHz). One hydrophone was located 1 m from the sound source to measure the source level. The freefield sound power level SWL calculated by the source level SL according to Eq.(16),is shown in Fig.B1(b).
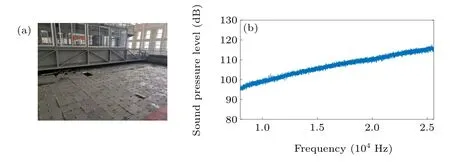
Fig.B1. (a)Photo of anechoic pool and(b)the sound power level measured in the anechoic pool.
Appendix C:Measurement of sound power level in a reverberation tank
The relationship between the sound pressure level SPL measured in a reverberation tank and the sound power level SWL of the underwater source is given by

where ΔCis a correction value that is affected only by the properties of the tank and the location of the source.[11]As long as there is a sound source with known radiated sound power,the correction value ΔCcan be obtained by measuring this sound source in the reverberation tank in the two scenarios of a steady surface and a random surface. Once ΔChas been determined for a known sound source, the sound power level of an unknown source can be easily obtained by measuring the sound pressure level of the latter in the same reverberation tank.
The sound pressure levels of the test source used in the present experiments were measured in the reverberation tank with a steady surface and a random surface. Two different measurement methods were used: (i) straightforward measurement (one hydrophone was used to measure 30 s signals straightforwardly at a fixed position in the reverberation area);(ii) spatially averaged measurement (six hydrophones were used to measure 30 s signals at fixed positions in the reverberation area,and the results were averaged).
The other known sound source was used to obtain the correction value ΔC,then according to Eq.(17),the sound power levels in four scenarios were obtained as shown in Fig.C1.

Fig. C1. Sound power levels: (a) straightforward measurement in a tank with a steady surface;(b)straightforward measurement in a tank with a randomly fluctuating surface;(c)spatially averaged measurement in a tank with a steady surface; (d) spatially averaged measurement in a tank with a randomly fluctuating surface.
Figures C1(a) and C1(b) show that with straightforward measurement in the tank, the sound power level measured in the steady tank fluctuated greatly, whereas the randomly fluctuating surface reduced the fluctuation significantly. Figures C1(c)and C1(d)show that when spatial averaging is used,the randomly fluctuating surface can also reduce the fluctuation of the curves of the sound power level. It is clear that the measurement accuracy was improved considerably in the tank with the randomly fluctuating surface,thereby offering significant improvements in underwater acoustic measurements.
杂志排行
Chinese Physics B的其它文章
- Ergodic stationary distribution of a stochastic rumor propagation model with general incidence function
- Most probable transition paths in eutrophicated lake ecosystem under Gaussian white noise and periodic force
- Local sum uncertainty relations for angular momentum operators of bipartite permutation symmetric systems
- Quantum algorithm for neighborhood preserving embedding
- Vortex chains induced by anisotropic spin–orbit coupling and magnetic field in spin-2 Bose–Einstein condensates
- Short-wave infrared continuous-variable quantum key distribution over satellite-to-submarine channels
