Numerical Simulation of Dynamic Response of Saturated Sand During Shield Construction*
2022-06-21WANGJingyueGEXinshengSHANGZhuoWUPingZHANGJun
WANG Jingyue, GE Xinsheng, SHANG Zhuo, WU Ping, ZHANG Jun
(1.College of Civil Engineering,Taiyuan University of Technology,Taiyuan,Shanxi 030024,China;2.Taiyuan Taigong Tianhao Civil Engineering Testing Co., Ltd.,Taiyuan,Shanxi 030024,China;3.Shanxi Transportation Research Institute Group Co.,Ltd.,Taiyuan,Shanxi 030024,China)
Abstract:In order to study the disturbance of the liquefiable stratum caused by the vibration induced by construction of the shield machine, the construction process of the shield tunnel was simulated based on the finite difference software FLAC 3D. A sinusoidal velocity boundary that simulates the vibration of shield construction is applied in the horizontal direction of the excavation surface, and dynamic response analysis is carried out to analyze the excess pore water pressure, acceleration, and vertical effective stress time-history curves. The research results show that in the liquefiable stratum, the vibration induced by shield construction will form a certain liquefaction area in the soil in front of the excavation face. The area has not developed to the ground. The area where the vibration induced by shield construction has a great influence on the excess pore water pressure of the soil is below the excavation surface. This area is vortex-shaped. The excess pore water pressure of the overlying soil layer on the excavation surface increases, and the vertical effective stress decreases. The horizontal vibration wave induced by shield construction has no obvious attenuation in the horizontal direction, but has obvious attenuation during the propagation to the ground surface. In the area where the peak value of soil acceleration is large, the soil liquefaction is serious.
Keywords:shields;tunnels;saturated sand;numerical simulation;excess pore water pressure
0 Introduction
The research of shield tunnel has been attached great importance to by scholars in related fields[1]. However, there are few researches on soil liquefaction caused by shield construction in liquefiable strata. Although the range of soil liquefaction caused by shield construction is small, the harm caused by shield construction cannot be ignored[2-3]. The soil liquefaction is caused by the fluctuation of the cutter head torque and the pressure of the soil chamber, the rotary shear of the cutter and the vibration of the shield machine when the earth pressure balance shield machine drives into the liquefaction stratum. In the process of Shanghai Yingbin No.3 tunnel passing through Hongqiao Airport, soil liquefaction was caused by shield construction, and the settlement of ground surface after construction reached 50mm, which was five times of the specified limit of 10mm[4].
If you want to get systematic law through model experiments, it costs a lot of money and a lot of time. Therefore, numerical calculation is used for the study. Numerical analysis is an effective method to study the sand liquefaction problem. In Wang’s research[5],by using two-dimensional finite-difference FLAC software and Finn constitutive model, the effective stress, pore water pressure and effective stress of the monitoring site were analyzed to study the vibration liquefaction of sand. In Zhang’s research[6],the liquefaction model of caisson wharf in Hanshin earthquake was established by using FLAC 3D software, and the simulation results were in good agreement with the measured data. The finite difference method can be used to simulate the liquefaction process of sand. In Shi’s research[7],the results of numerical analysis on seismic liquefaction characteristics of soil layers in typical drilling locations of shield tunnel under the Kanapuri River in Bangladesh were consistent with those of the Sino-American standard method, which also confirms the reliability of using FLAC 3D software to simulate sand liquefaction. In Niu’s researches[8-10], the regular sine wave was used to simulate the seismic load and FLAC 3D software was used to study the liquefaction characteristics of sand foundation reinforced by piles. By comparing with shaking table tests, the effectiveness of numerical simulation method was proved. In Pan’s research[11],FLAC finite difference program was used to solve the soil liquefaction problems, which proved the applicability of the software in soil liquefaction problems.
This paper takes Shanghai Yingbin No.3 tunnel as the engineering background, using FLAC 3D finite difference software analyzes the dynamic response of soil disturbance during shield construction, applies regular sine wave in the horizontal direction of excavation surface, simulates the vibration wave induced by shield construction, and discusses the variation of pore pressure ratio, excess pore water pressure, acceleration and effective stress during shield construction in the liquefiable stratum.
1 Principle of numerical analysis
1.1 Dynamic analysis method
A completely nonlinear dynamic analysis method was adopted to simulate the liquefaction of soil[12], considering the coupling analysis of dynamic and seepage flow. Dynamic analysis is based on static analysis, so before dynamic calculation, static mechanical calculation and seepage calculation should be carried out to get the correct stress field and seepage field. The grid size, boundary conditions, material parameters, damping types and seismic wave adjustment should be considered before dynamic calculation.
1.2 Sand liquefaction criteria
In the FLAC 3D numerical calculation, the concept of excess pore water pressure ratio is often used to describe liquefaction due to the influence of calculation accuracy. In three dimensional numerical calculation, the pore pressure ratioruis calculated as follows:
(1)
The saturated sand changes from solid to liquid during seismic liquefaction. If the viscous force of liquid is not considered, the shear strength becomes 0. In this case, the principal stress of soil in the three directions is equal to the pore water pressure, and the effective principal stress in the three directions is 0. Therefore, when the pore pressure ratio is exceeded, the saturated sand liquefies. Otherwise, it doesn’t liquefy.
1.3 Finn’s pore pressure model
The essence of Finn’s model is to add a rising mode of dynamic pore pressure on the basis of Mohr-Coulomb’s model, and assume that the rising of dynamic pore pressure is related to the increment of plastic volume strain.
The plastic volumetric strain increment is only a function of the total cumulative volumetric strain and shear strain:
(2)
where,Δεvdis plastic volumetric strain increment,γis shear strain,εvdis cumulative volumetric strain,C1,C2,C3,C4is the model constant.
The numerical accuracy of wave propagation in soil is affected by the frequency components of the input waveform and the characteristics of wave velocity in soil. The size of the model grid must be less than 1/10~1/8 of the wavelength corresponding to the highest frequency of the input waveform.
2 Project overview
Shanghai Yingbin No.3 tunnel adopts the construction of 14.27m earth pressure balance shield across the whole core area of Hongqiao Airport, with the maximum settlement of 10mm. Early engineering used in Shanghai bund successful propulsion parameters in tunnel engineering, but have taken place in the earth’s surface subsidence, ground surface settlement of the typical duration curve is shown in Fig.1, you can see shield tunnel incision before the arrival of the surface subsidence happened 10mm, after the shield tail out reached 30mm and 50mm, post-construction settlement of shield has to stop before entering the airport.
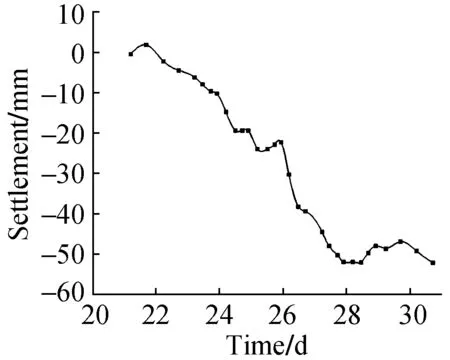
Fig.1 Typical surface subsidence curve
3 Establishment of computational model
3.1 Model size and layout of monitoring points
Referring to Shanghai Yingbin No.3 tunnel, the diameter of the model tunnel is 14m, the buried depth is 20m, the model size is 90m×60m×1m, and the groundwater level is -2m. Monitoring points are set in front of the excavation and in the soil covering of the tunnel,which can monitor the disturbance liquefaction of soil before, after the arrival of the shield machine, as shown in Fig.2. It is used to monitor the changes of the excess pore water pressure ratio, excess pore water pressure, effective stress and acceleration of the excavation surface and the soil body on the excavation surface under shield construction induced vibration.
The man allowed his voice to shake for the first time as he brushed the back of his hand up the side of his whiskered face and across his left eye. I . . . I want this for my son s grave and I don t want it to make a mess in the mausoleum.
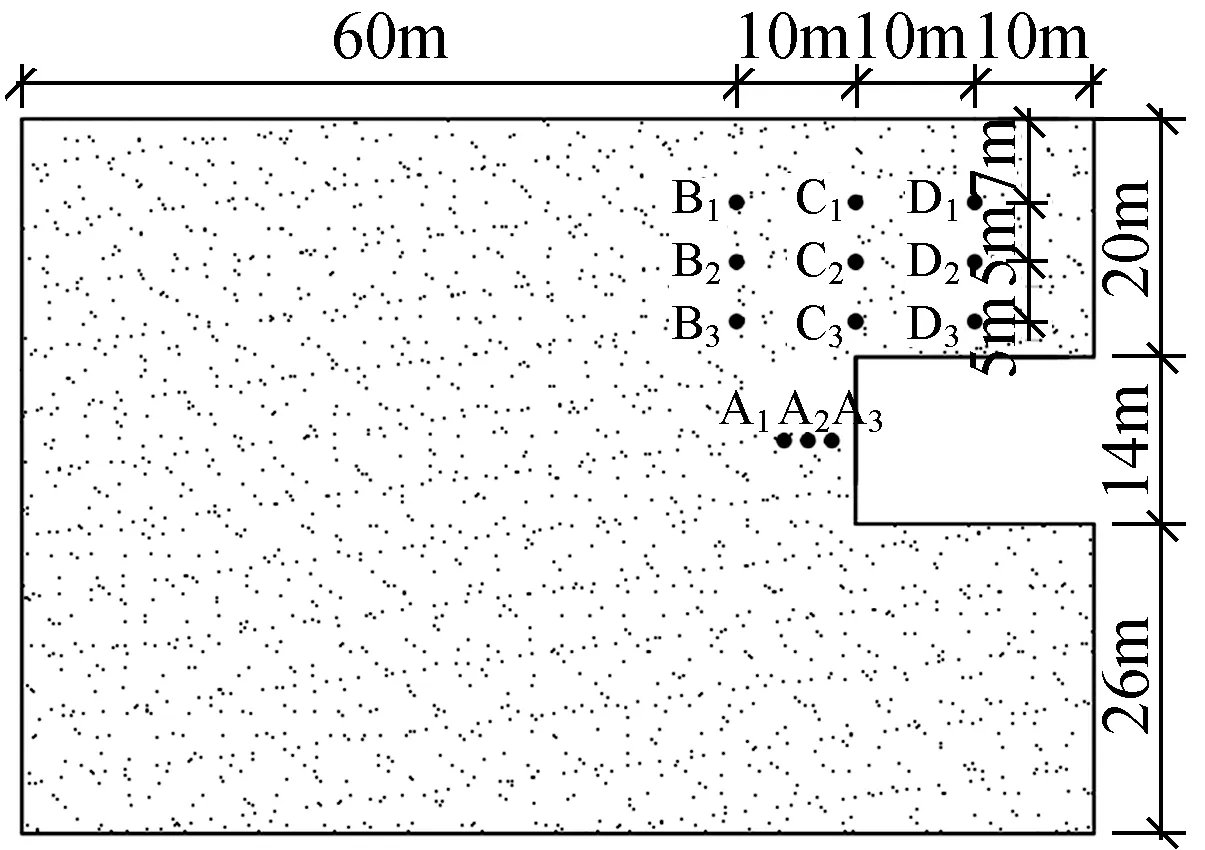
Fig.2 Arrangement of monitoring points
3.2 Basic assumptions of the model
1) The coefficient of permeability and the coefficient of compression are constant, and the coefficient of permeability is equal in all directions.
2) Soil particles and pore water are incompressible.
3) The soil is completely saturated and the flow of water in the soil obeys Darcy’s law.
3.3 Boundary conditions
In dynamic problems, there is wave reflection on the boundary, which affects the results of dynamic analysis. FLAC 3D achieves free field boundary conditions by generating two dimensional and one dimensional grids around the model to reduce wave reflection on the model boundary. In this paper, the power source is applied at the center of the excavation surface, so there is no need to set free field boundary.
Because groundwater is abundant in the liquefiable strata, the numerical calculation is carried out by means of the dynamic-seepage coupling method. There are usually two assumptions for the boundary conditions of the excavation surface in fluid-structure interaction calculation. The pore pressure of the excavation surface is 0 or the excavation surface is impervious to water. The seepage boundary conditions in this paper are as follows: around and at the bottom of the model, the pore pressure is set as the pervious boundary of fixed static water pressure, the groundwater level is the free boundary, the fixed pore water pressure is 0, and the excavation surface is the impervious boundary.
3.4 Dynamic load and mechanical damping
A sinusoidal velocity boundary was applied in the horizontal reverse direction (xdirection) at the center of the excavation surface. The velocity time-history gradually increased from 0~2s to the maximum and remained stable for a certain time (2~20s), and then gradually decreased to 0 (20~30s). The velocity time-history curve is shown in Fig.3. Local damping is adopted, and the damping coefficient is 0.314. In the calculation process, only one-way and vertical sinusoidal incoming are considered, and two-way and three-way incoming are not considered.

Fig. 3 The velocity time-history curve
4 Analysis of simulation results
4.1 Excess pore water pressure ratio
The cloud map of excess pore water pressure ratio is shown in Fig.4. We can see that the party of excess pore water pressure ratio above 0.6 forms a regional party in front of the excavation, the excess pore pressure ratio of 1 shows that the soil liquefaction phenomenon completely, the model of dynamic load at the center of the excavation face, square in front of the excavation areas formed the liquefied area, the liquefaction area is irregular. Liquefied area above the excavation surface is formed by the protruding. However, the liquefaction zone did not develop to the ground surface, and the excess pore pressure ratio of the liquefaction zone before excavation was above 0.8.
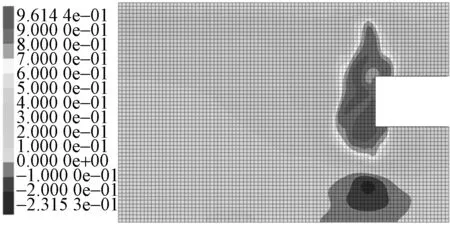
Fig. 4 Cloud map of excess pore water pressure ratio
The time-history curves of excess pore water pressure ratio at each monitoring point is shown in Fig.5. We can see that only the soil overlaid directly above the excavation face (points C1,C2,C3) liquefaction is obvious, before excavation points B1, B2, B3and the rear points D1, D2, D3, the liquefaction effect is not obvious. Square before excavation points A1,A2,A3,the excess pore water pressure ratio increased to 8.5 along the smooth curve. For points D1,D2,D3and points B1,B2,B3, the time-history curves of excess pore water pressure ratio show slightly different growth trends. The monitoring excess pore water pressure ratio of points D1, D2, D3are not more than 0.5. The time-history curves of excess pore water pressure ratio of points B1, B2, B3have an obvious inflection point. After arrive of shield machine by minimal impact to the disturbance of soil liquefaction, shield machine before the arrival of the disturbance of soil liquefaction degree, arrived on the excavation face of shield machine patch of body and overlying soil disturbance appear obvious liquefaction phenomenon, the excavation front side 6m completely within the scope of soil liquefaction, shield machine is directly above 8m range of soil liquefaction completely.

Fig. 5 Time-history curves of excess pore water pressure ratio
4.2 Excess pore water pressure and vertical effective stress
The cloud map of excess pore water pressure is shown in Fig.6. We can see that in the center of the excavation face after applying power, excess pore water pressure of the model cloud has changed significantly, in a large area of the excavation front side to produce excess pore water pressure, soil excavation front side underside of pore water pressure in soils is not dissipate, the formation of excess pore water pressure vortex area, the centre area excess pore water pressure, the biggest circumferential diffusion gradually decreases.
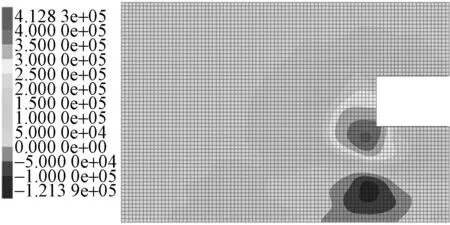
Fig. 6 Cloud map of excess pore water pressure(Unit:Pa)
In the process of dynamic application, the time-history curves of excess pore water pressure and vertical effective stress of the soil body before excavation and overlying soil body are shown in Fig.7 and Fig.8.
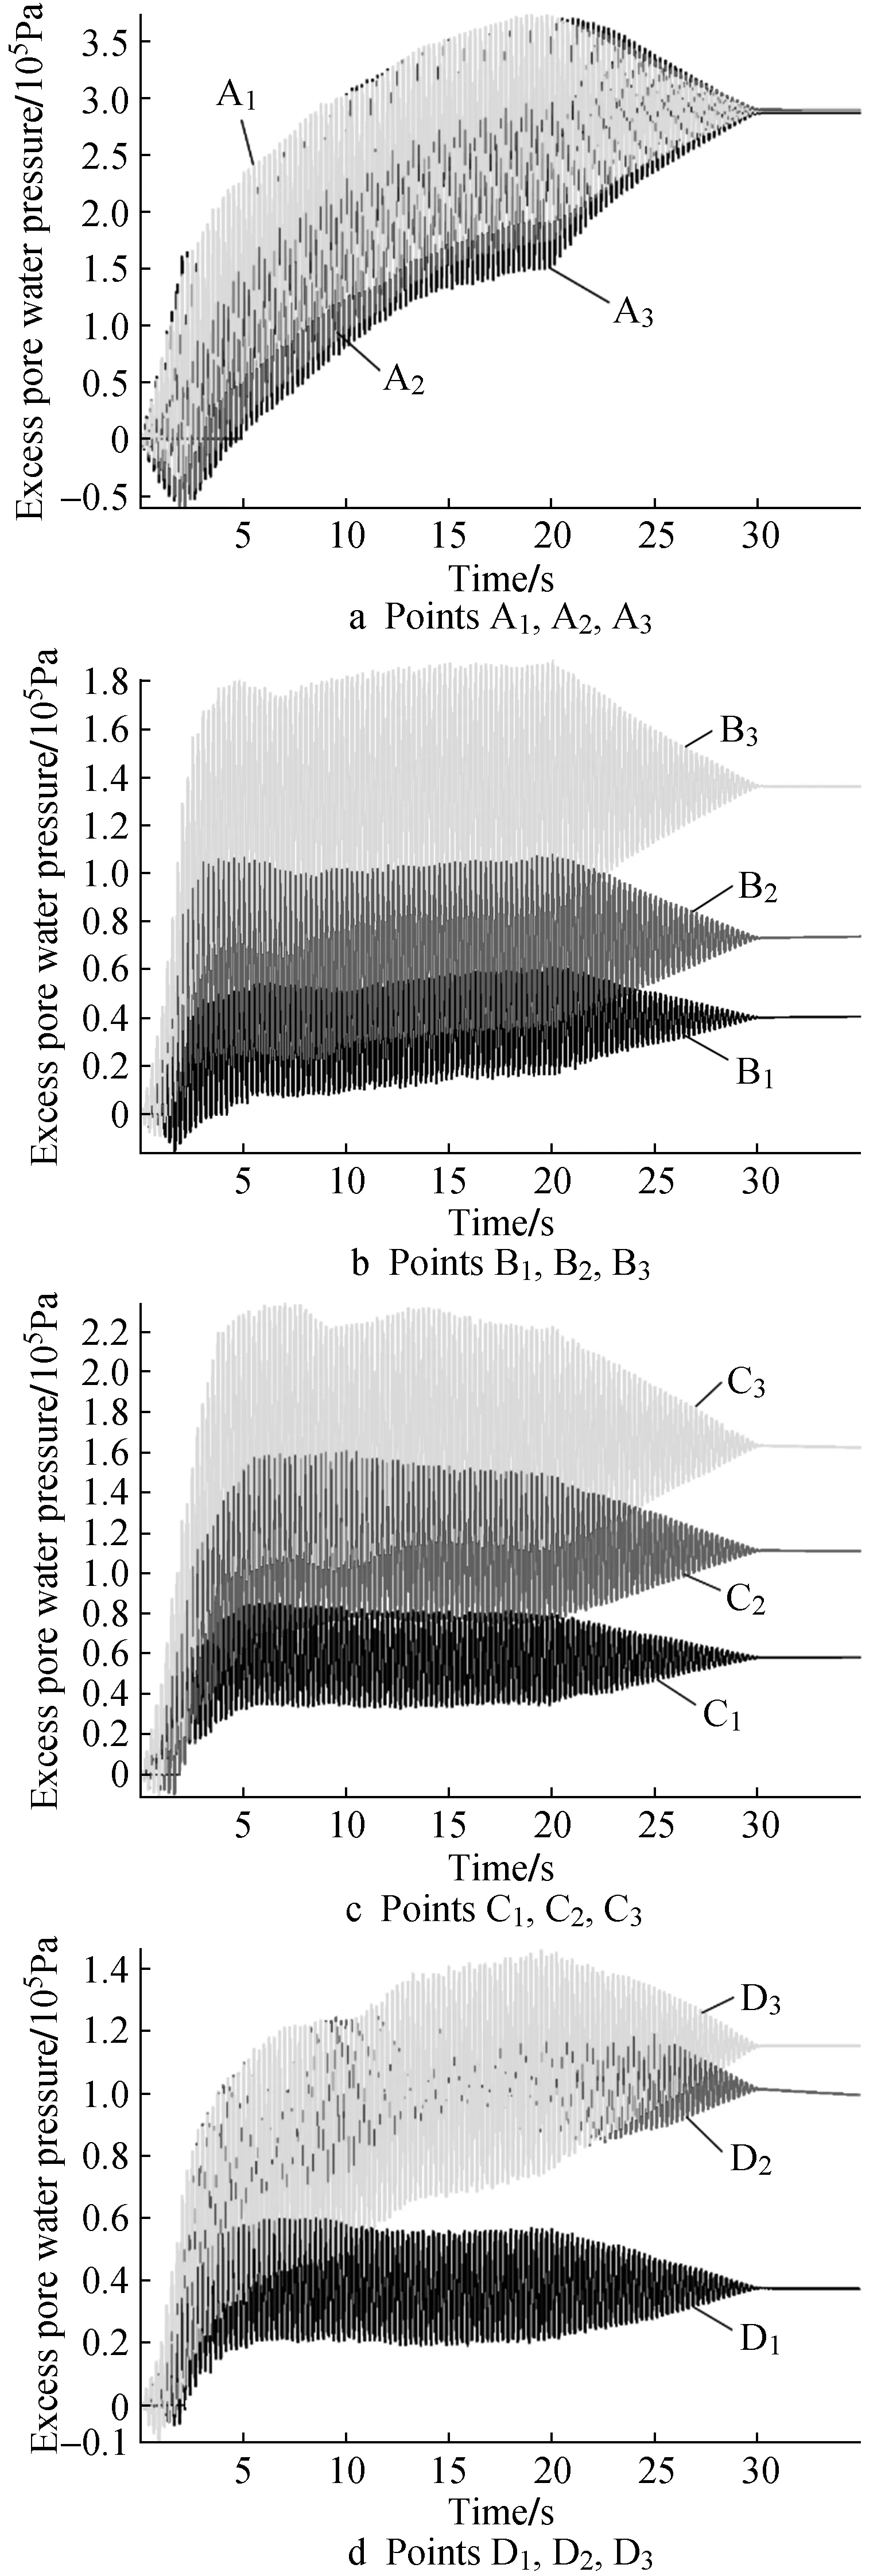
Fig. 7 Time-history curves of excess pore water pressure
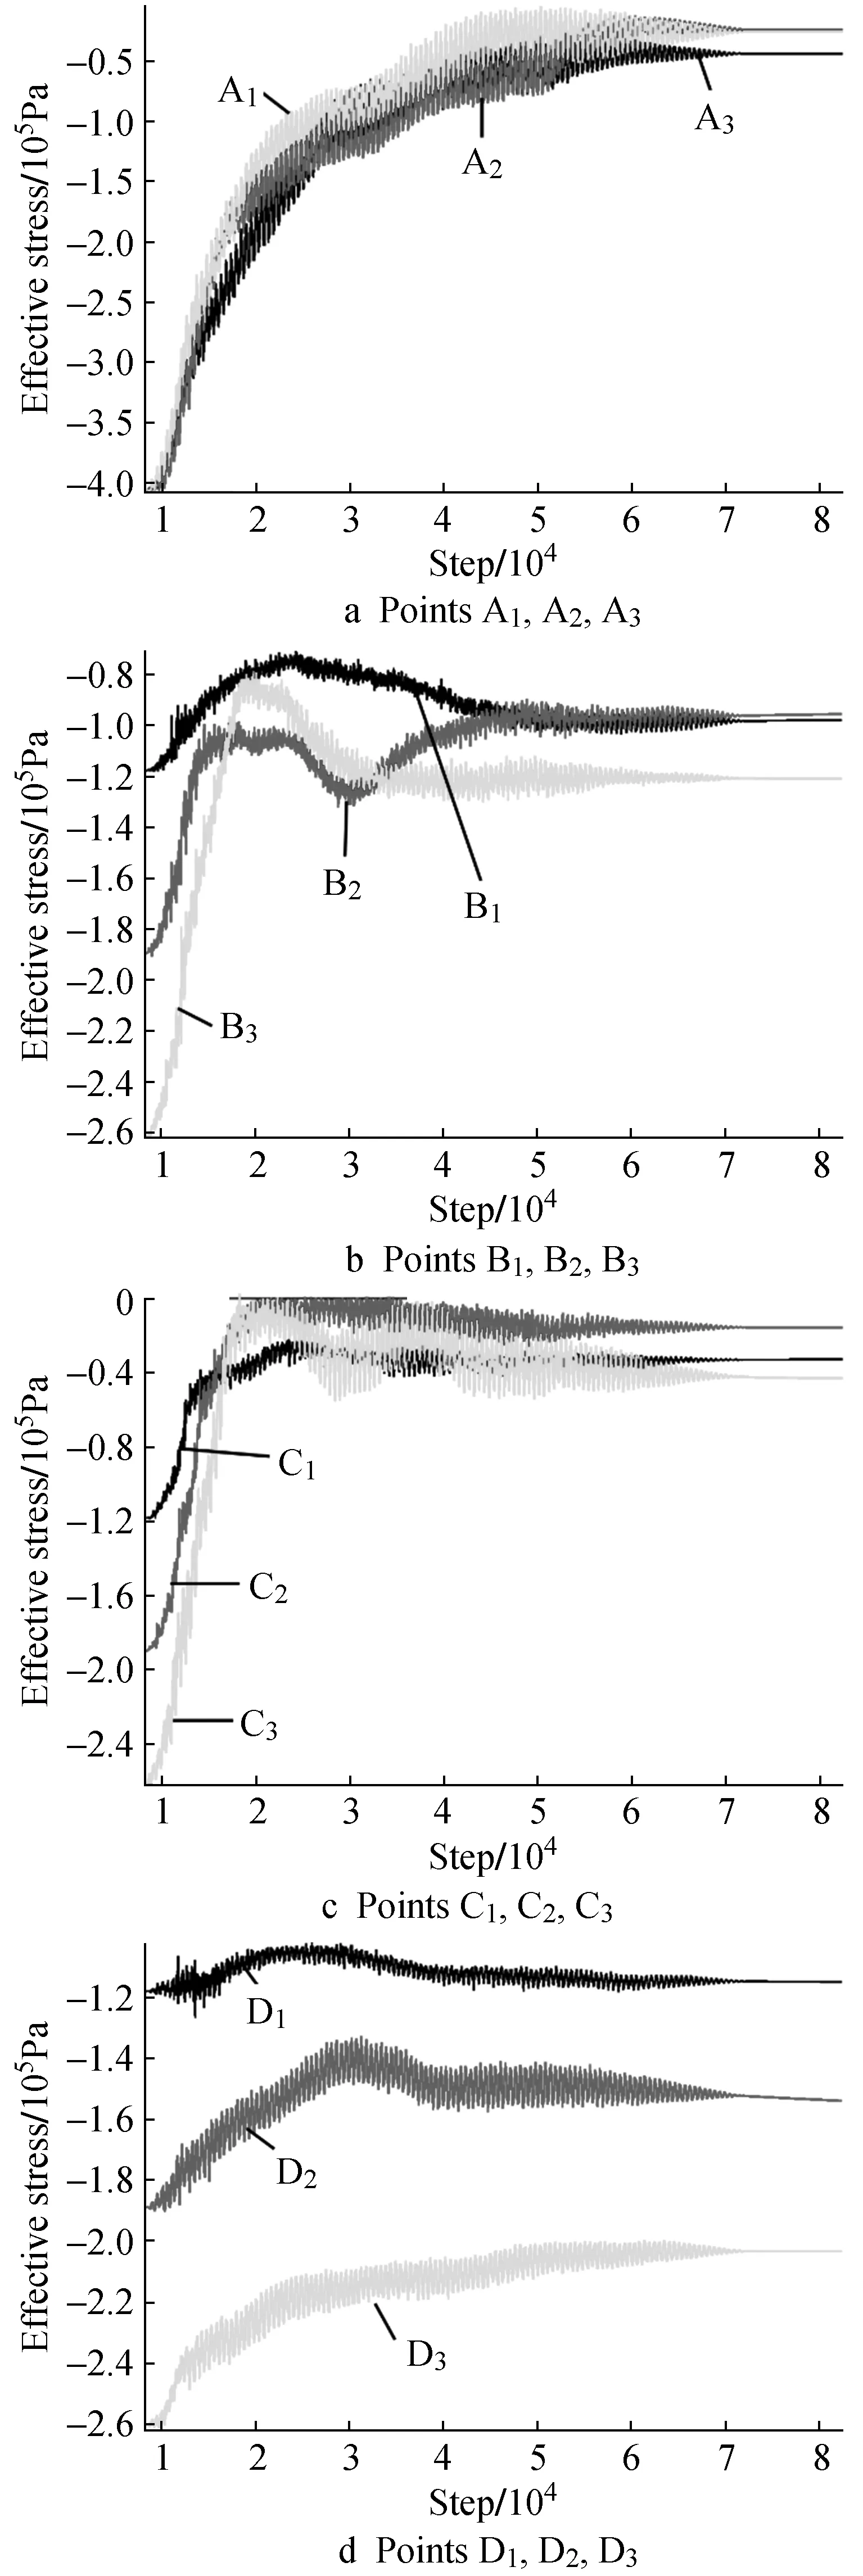
Fig. 8 Time-history curves of vertical effective stress
It can be seen from Fig.7, the excess pore water pressure at all the monitored points increases during the process of power application. Since the model boundaries are impervious and there is no other drainage treatment measures, the excess pore water pressure does not dissipate significantly. The time-history curves of excess pore water pressure of points A1,A2,A3are relatively close, with slow growth and no obvious inflection point. The final stability value of vertical excess pore water pressure is close. The excess pore water pressure of points C1, C2, C3increases with time with a similar trend, but with the increase of the distance from the power application point, the final stable value of excess pore water pressure decreases. The time-history curves of excess pore water pressure of points B1,B2,B3are close to each other, and the final stable value of excess pore water pressure increases with the increase of burial depth.
Especially the saturated loose sand, silt soil, under vibration load, pore water pressure in soil accumulated gradually, according to the principle of vertical effective stress in saturated soil and cohesionless soil shear strength formula of effective stress drop, when the pore water pressure accumulates to the total stress and the effective stress is 0, that is, when the shear strength is 0, the soil particles are in a suspended state and the soil loses its bearing capacity.
It can be seen from Fig.8 that vertical effective stress at the monitored points decreases in the process of dynamic application and stabilizes at a certain value over time, but the vertical effective stress does not decrease to 0, indicating that the soil is damaged by liquefaction and not completely liquefied. For points D1,D2,D3and points B1,B2,B3,the decrease trend of vertical effective stress are different, indicating that the effective stress of soil after the shield machine passes through the construction process is different from that before the shield machine arrives. The decrease value of vertical effective stress of soil after the shield machine passes through the construction process is small. The vertical effective stress of soil before and above excavation decreases obviously, almost to 0, and the soil is completely liquefied.
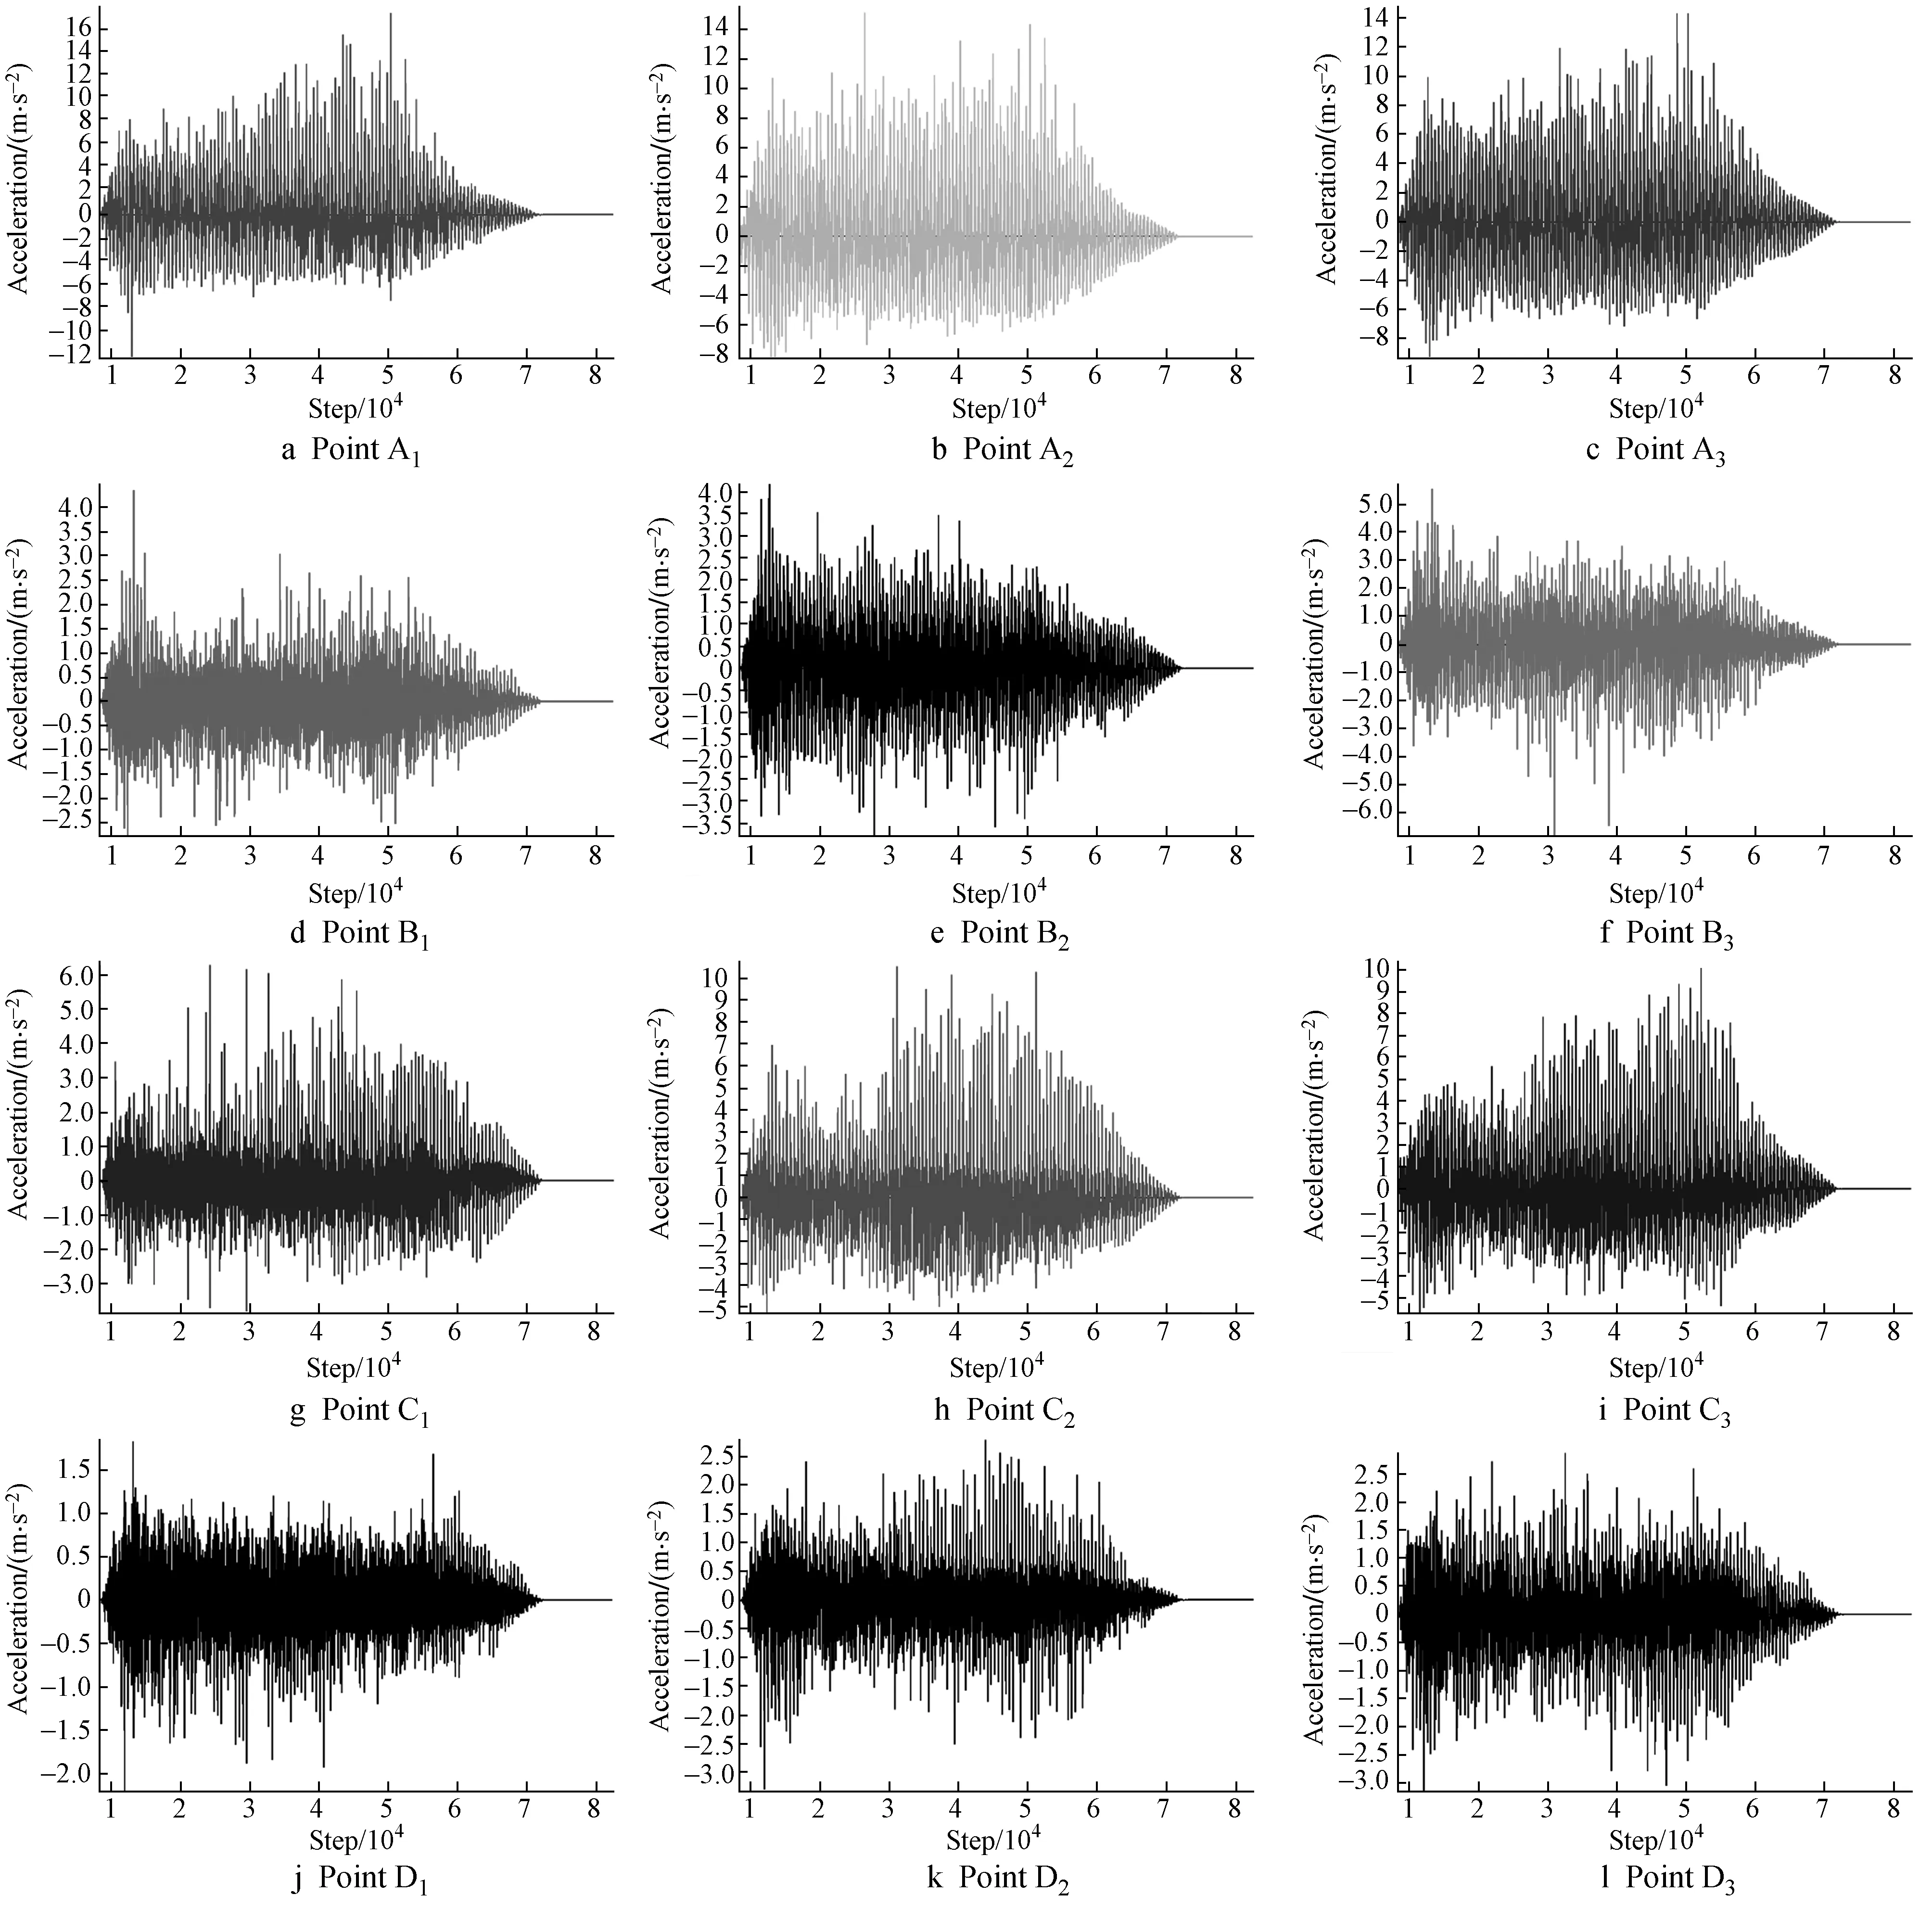
Fig. 9 Acceleration time-history curves
4.3 Acceleration
The acceleration time-history curves of the monitoring point is shown in Fig.9. It can be seen from Fig.9, the maximum acceleration values of points A1,A2,A3are relatively close, indicating that the attenuation of horizontal sinusoidal wave in the soil propagation process in front of the excavation surface of shield tunnel is small, so the soil in front of the excavation surface is seriously liquefied. The distances between points D3and B3from the dynamic action point are equal, but the maximum acceleration value is different, which is related to the propagation direction and propagation path of the wave. The maximum acceleration values of points C2and C3are close to each other, and the soil appears to be liquefied. The maximum acceleration value of point C1is small, indicating that the sine wave is more attenuated when it is transmitted to point C1. The propagation attenuation of the wave induced by shield construction in the horizontal direction is not obvious, but there is obvious attenuation during the propagation to the ground surface.
4.4 Comprehensive analysis
The excess pore water pressure peak, acceleration peak, vertical effective stress reduction value and final value were statistically analyzed, as shown in Fig.10.
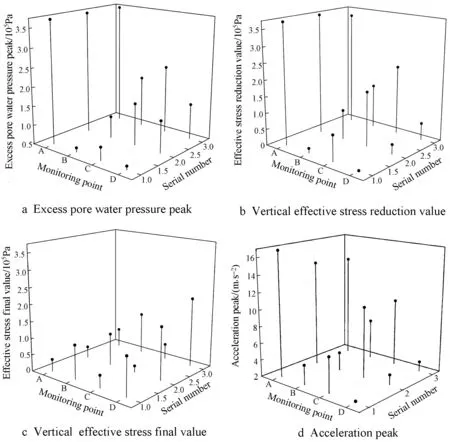
Fig.10 Peak contrast curves
It can be seen from Fig.10, the excavation front patch of excess pore water pressure peak is the largest, the monitoring points buried depths are the same, the peak are same,the excess pore water pressure peak in overlying soil with buried depth increases. The peak value of ertical excess pore water pressure and the decreasing value of vertical effective stress show the same trend, which is consistent with the principle of effective stress. The final value of vertical effective stress monitored by points A1, A2, A3and C1, C2, C3is the smallest, close to 0, and the soil is completely liquefied. Points A1, A2, A3have the largest acceleration peaks, followed by points C1, C2, C3. The acceleration peaks of points B1, B2, B3and points D1, D2,D3are smaller. It shows that the soil in front of the shield machine is most affected by the vibration disturbance of shield construction, followed by the soil directly above the excavation surface, which is consistent with the previous law in the liquefaction area.
5 Conclusion
FLAC 3D finite difference software was used to establish the tunnel excavation model, and the sinusoidal wave simulating shield construction vibration was applied the excavation surface. Through the analysis of the calculated cloud map and the results of each monitoring point, the following conclusions were obtained.
1)The vibration induced by the shield machine construction forms a certain liquefaction area in the soil in front of the excavation face, and the liquefaction area of the soil directly above the excavation face is prominent. The soil within the range of 6m in front of the excavation face and 8m above the excavation face was completely liquefied, and the liquefied area did not develop to the ground. Corresponding measures should be taken when the shield machine is constructed in the liquefiable stratum.
2)The area where the vibration induced by shield construction has a great influence on the excess static pore water pressure of the soil is below the excavation surface. The region is vortex-shaped, and the excess static pore water pressure in the center of the region is relatively large, and the diffusion gradually decreases to the surrounding area.
3)The greater the burial depth, the greater the peak value of excess pore water pressure monitored at the monitoring point, and the greater the reduction in vertical effective stress. The maximum value of the acceleration of the soil directly in front of and directly above the excavation surface is large, the final value of the vertical effective stress is small, which is close to 0, the peak value of the excess static pore water pressure is large, and the soil is completely liquefied.
4)In the process of shield construction, the liquefaction damage is most obvious in the soil in front of the excavation front and in the soil directly above. The soil liquefaction damage before the shield arrives is more obvious than that after the shield passes.
5)In the soil directly in front of the excavation face in liquefiable strata, the attenuation of vibration wave propagation in the horizontal direction induced by shield construction is not obvious. In the soil directly above the excavation surface, the vibration wave induced by shield construction is more attenuated during the propagation to the ground.
