Development of a low-background neutron detector array
2022-06-18YuTianLiWeiPingLinBingShuiGaoHanChenHaoHuangYuHuangTaoYuJiaoKuoAngLiXiaoDongTangXinYuWangXiaoFangHanXiongHuangJieRenLongHuiRuXiChaoRuanNingTaoZhangZhiChaoZhang
Yu-Tian Li· Wei-Ping Lin· Bing-Shui Gao, · Han Chen ·Hao Huang · Yu Huang · Tao-Yu Jiao · Kuo-Ang Li · Xiao-Dong Tang,·Xin-Yu Wang · Xiao Fang· Han-Xiong Huang · Jie Ren· Long-Hui Ru ·Xi-Chao Ruan · Ning-Tao Zhang · Zhi-Chao Zhang
Abstract A low-background neutron detector array was developed to measure the cross section of the 13C(α,n)16O reaction, which is the neutron source for the s-process in AGB stars,in the Gamow window(Ec.m.=190±40 keV)at the China Jinping Underground Laboratory(CJPL). The detector array consists of 24 3He proportional counters embedded in a polyethylene cube. Owing to the deep underground location and a borated polyethylene shield around the detector array, a low background of 4.5(2)/h was achieved. The 51V(p, n)51Cr reaction was used to determine the neutron detection efficiency of the array for neutrons with energies En<1 MeV. Geant4 simulations are shown to effectively reproduce the experimental results. They were used to extrapolate the detection efficiency to higher energies for neutrons emitted in the 13C(α,n) 16O reaction.The theoretical angular distributions of the 13C(α,n)16O reaction were shown to be important in the estimation of the uncertainties of the detection efficiency.
Keywords Underground laboratory · Neutron detector ·Low background · 3He Counter
1 Intr oduction
The13C(α,n)16O reaction is the dominant neutron source for the slow neutron capture process (s-process), which synthesizes roughly half of the elements heavier than iron in the Universe [1]. The main site of the s-process is the‘‘He intershell’’of the asymptotic giant branch(AGB)stars where the temperature is 0.1 GK. This corresponds to a Gamow window of 190±40 keV for13C(α,n)16O reaction,which is far below the Coulomb barrier. Theoretical calculations predicted a cross section as low as ~10-14barn at 190 keV[2,3].The13C(α,n)16O reaction is also the main neutron source for the intermediate neutron capture process(i-process), with a typical temperature of 0.2 GK [4, 5]. A reliable direct measurement is still missing within the corresponding energy range of 0.2–0.54 MeV.To push the direct measurements of the cross section toward the Gamow Window, high-intensity beams and the low-background neutron detector array are indispensable.
Present measurements performed at ground laboratories are limited by the cosmic-ray-induced background. With a typical background counting rate of a few hundred per hour(e.g., [6, 7]), those measurements only reached a lower limit of Eα~400 keV with a cross section of ~10-10barn. The China JinPing underground Laboratory (CJPL)[8] with approximately 2400 m rock overburden (6700 m water equivalent) shields against most of the cosmic rays.The ultra-low background provides new opportunities for neutrino physics [9], dark matter [10, 11], and direct cross section measurements of the key reactions in nuclear astrophysics [12, 13]. The Jinping Underground Nuclear Astrophysics experimental facility (JUNA) [12, 13] has been initiated to measure important stellar nuclear reaction rates, taking advantage of the low-background environments in CJPL. The present JUNA project includes12C(α,γ)16O,13C(α,n)16O,19F(p,γ)20Ne,and25Mg(p,γ)26Al reactions [12, 13]. A high-intensity accelerator capable of delivering proton and α beams up to 10 mA in the energy range of 0.05–0.4 MeV has been built for JUNA[12].This has made it possible to measure the13C(α,n)16O cross section at the region of the s-process Gamow window when combined with a high-efficiency and low-background neutron detection system.
This paper describes the development and characterization of a low-background neutron detector array for the cross section measurement of the13C(α, n)16O reaction.
2 Design of the detector array
The detector array consists of 243He-filled proportional counters (manufactured by GE-Reuter Stokes), embedded in a 50 × 50 × 50 cm3polyethylene cubes. Each proportional counter was filled with3He and argon gases at pressures of 4 bar and 2.4 bar, respectively. The active length of each counter was 30 cm, with a diameter of 2.54 cm. A schematic representation of the detector array is shown in Fig. 1. The 24 proportional counters are evenly distributed in two concentric rings with radii R1= 8.5 cm and R2= 13 cm, respectively. The radius of the two rings was optimized using Geant4 simulations, following the same procedure as that in [14], to obtain the maximum detection efficiency for 2.0-MeV isotropic neutrons. A central bore hole with a diameter of 10 cm was created to accommodate the beam line and target. Neutrons from the13C(α, n)16O reaction with energies of 2–3 MeV are first moderated by the polyethylene cube and then captured by the proportional counters. To shield against environmental neutrons, the polyethylene cube is wrapped with a 5 cmthick 7% borated polyethylene layer.

Fig. 1 (Color online) Schematic view of detector array. In panel a,the borated polyethylene shield (black brick), positions of the 3He counters (red tubes), and central bore holes are indicated. The traces of the two neutron events are shown as green curves.Panel b presents a three-dimensional view of the detector array

Fig. 2 (Color online) a Typical energy spectrum measured using the detector.A cut as shown in panel b was applied to select neutrons(see text). The dashed lines indicate the regions of interest between 0.64–0.8 MeV. The inset shows an energy spectrum in the wider energy range without cuts. b Raise time versus energy in two dimensions plots measured using a detector array. β/γ, neutron and alpha, and alpha-regions are indicated in the plot
The signal of each detector was processed using a charge-sensitive preamplifier (model CAEN A1422). The output waveforms were digitized and recorded using a XIA Pixie-16 100 MHz card. Figure 2a shows a typical energy spectrum measured by the detector array using a252Cf source.The‘‘Neutron and alpha’’cut shown in Fig. 2b was used in the plot to select the neutron events (see the following sections for details). The peak at 0.76 MeV corresponds to full-energy events, where the triton and proton produced from the3He + n →p + t reaction deposit all their kinetic energies in the sensitive region of the counter.If the proton or triton hits the wall of the detector before depositing all their kinetic energies in the sensitive region,the detector records only part of the reaction Q value.Those are wall-effect events that correspond to the flat region with lower energies starting from 0.18 MeV in the spectrum.The argon gas filled in the proportional counters has little effect on the neutron detection efficiency but can significantly decrease the track lengths of the produced proton and triton, and therefore reduce the wall effect. By defining a region of interest around the full energy peak between 0.64 and 0.8 MeV (ROI) as indicated in Fig. 2a,we find that 81.0±0.4% of the detected events are located in it.
3 Background measurements
Stainless steel is chosen as the wall material of the proportional counters because it has a significantly lower α emission rate compared to aluminum[15,16].The inset in Fig.2a shows an energy spectrum up to 7 MeV measured at the CJPL. The events located beyond the neutron full-energy peak are mainly due to the α radioactivity from the wall material of the counters. The α spectrum has a relatively flat distribution below ~3 MeV and exhibits a peak at 5 MeV,a typical energy of α decays from U/Th nuclides.Below the 0.3 MeV energy region, numerous β/γ events exist, overlapping with the neutron events. Following the procedure described in Ref. [15], the β/γ events can be well separated from neutrons in the raise time versus the energy two-dimensional plot as shown in Fig. 2b taken at the CJPL.
To characterize the background of the detector array,ground and underground measurements were performed at the China Institute of Atomic Energy and the A1 hall of the CJPL,respectively.Neutron events were selected using the‘‘neutron and alpha’’ cut from the rise time versus energy two-dimensional plot as shown in Fig.2b.Such events also include contributions from the α background. To disentangle the α background from the ‘‘neutron and alpha’’events, a flat α energy spectrum is assumed [15, 16] in the energy range 0.18–2.0 MeV. The total background inside the ‘‘neutron and alpha’’ cut is shown in Fig. 2b measured at CJPL for the whole array as 4.5(2)/h,of which 1.94(5)/h is from the α background. The above α background is evaluated using the α counts in the energy range 1.0–2.0 MeV,which was assumed to have the same α emission rate as 0.18–0.8 MeV. This assumption was verified using a4He proportional counter, as discussed below. The total background was more than two orders of magnitude lower than the result of 1238(11)/hour obtained from groundmeasurement.
A4He counter, which has exactly the same parameters as the3He counters but filled with4He gas instead of3He,manufactured by the same supplier was used to investigate the α background in more detail. The4He counter is insensitive to neutrons but expected to have similar α background shape as the3He counters. The α background rate, with a 28.9-h measurement time in CJPL, was found to be 4.24±0.48 and 4.22±0.38 MeV-1h-1,in 0.18–0.8 and 1.0–2.0 MeV energy regions, respectively. This indicates that the two energy regions have the same α emission rates. However, we found an α emission rate of 2.63(30)/hour using the same neutron cut as the3He counters in the raise time versus the energy plot. This is approximately a factor of 30 higher than the3He counters. It should be noted that the α emission rate of 1.94(5)/h quoted above includes the background of the 243He counters while the 2.63(30)/h is only for one4He counter. This implies that the α background could differ significantly even for the same type of wall material. This has to be carefully evaluated at the manufacturing stage to achieve a low α background.
To further reduce the α background, one can choose events within the ROI only[see Fig. 2a].Consequently,the α background was reduced by 74% at the cost of losing only approximately 19% of the neutron detection efficiency. This corresponds to a background of 2.5(1)/h, of which 0.50(1)/h is from the α background. A better approach to the α-background suppression is to use a plastic scintillator as the moderator, where most of the α background can be eliminated via coincident measurements [17]. The α background is the intrinsic properties of the proportional counters used in the array,which does not change with environments. However, the neutron background may change with different environments and therefore should be characterized for each use.
4 Efficiency calibration
4.1 51V(p, n)51Cr Experiment and simulation

Fig. 3 Emitted neutron energies from the 51V(p,n)51Cr reaction as a function of the proton beam energies. The height of the bars represents the energy spread of the emitted neutrons. The two components of the neutron energies at Ep = 2.45 and 2.6 MeV correspond to the transitions feeding the ground and the first-excited states of 51Cr
The detection efficiency of the array was calibrated at the nuclear physics experiment (NPE) terminal of the 3-MV tandetron accelerator [18] at Sichuan university. The detection efficiency hereafter includes both full-energy and wall-effect events. Quasi-mono-energetic neutrons were produced using the51V(p, n)51Cr reaction (Q=-1534.8 keV) at incident energies between 1.7 and 2.6 MeV with a step of 0.15 MeV. The51V(p, n)51Cr reaction is widely used in the calibration of the neutron detectors[14, 16, 19–22] owing to the slow variation in the neutron intensity and energy with the angle, and the well-known target preparation and utilization. Figure 3 shows the emitted neutron energy as a function of the incident proton beam energy. When the incident energy is above 2.33 MeV,neutrons from the transitions feeding the first excited state of51Cr (Ex= 749 keV) were mixed with those feeding the ground state. However, as pointed out in Ref.[16], the contribution from the transitions to the first excited state is negligible for incident energies up to 2.6 MeV [19], which was also confirmed in the present work(see discussions in the following sections). The proton beams were focused on a target with a diameter of less than 5 mm.(full width at half maximum).The beam spots were monitored using the fluorescence target with a beam position monitor located 1.5 m upstream the target for each beam energy.
Vanadium targets with thicknesses of 110 μg/cm2were used in the measurements. They were produced by evaporating natural vanadium on 1-mm-thick tantalum disks with a diameter of 30 mm. The target thickness corresponds to an energy loss of 8 ~11 keV for proton beams with energies of 1.7–2.6 MeV. The beam intensity varied from 4 μA to 120 nA as the beam energy increased from 1.7 to 2.6 MeV, making the counting rate of the detector array remain at approximately 104/s with a dead time of less than 1% for all beam energies. A direct water cooling of the reaction target was used to reduce the sputtering and target loss. The possible contribution of the beam induced background was evaluated with a blank tantalum target at the beam energy of 2.0 MeV.The background contribution was found to be less than 1%.
The total number of emitted neutrons was determined based on the activation method as described in Ref. [16].The number of radioactive products51Cr equals to the number of emitted neutrons, during the reaction.51Cr decays via the electron capture with a half-life of T1/2=27.7025(24) days, and has a branching ratio of B =9.91(1)% to decay to the first excited state of its daughter nuclei51V,which is followed by the emission of a 320-keV γ ray. Offline measurements of the γ ray were conducted using a GEM-series HPGe detector whose relative efficiency was 30%. The absolute efficiency of the HPGe detector was measured at a distance of 20 cm using137Cs[1.534(19)×105Bq] and152Eu [5.72(6)×104Bq] γ-ray sources. The distance of 20 cm is large enough to avoid pileups of the cascading γ rays from the sources. A51Cr γ source was produced by a51V(p, n)51Cr reaction. Its activity was measured at a position of 20 cm and then used to determine the efficiency of the 320-keV γ line at a position of 10.2 cm (η320), where all the irradiated targets were placed for off-line measurements. η320was determined to be 0.498(7)% at 10.2 cm. Because the beam current was stable within the irradiation time, the number of emitted neutrons was determined by the offline measurement of the 320 keV γ ray with the activation formula[16]

where Nγ,ti,tc,and tw are the number of the detected 320-keV γ rays, the activation time, the counting time, and the waiting time elapsed between the end of irradiation and the start of the counting, respectively. λ = (ln2)/T1/2is the decay constant of51Cr. After the dead time correction, the detection efficiency of the neutron detector is calculated as

where Nn is the detected number of neutrons by the detector array.
Because the energy of the neutrons emitted in the51V(p,n)51Cr reaction is only up to ~1 MeV,it is still far below that of the13C(α, n)16O reaction. The Monte Carlo simulation code, Geant4 [23, 24] of version 10.6 was used to determine the neutron detection efficiency at neutron energies above 1 MeV.

Fig. 4 (Color online) Detector setup used in the simulations for the 51V(p, n)51Cr reaction
The detailed detector setup used in the simulation is shown in Fig. 4. The beam pipe, target backing, and water cooling loops were included in the simulation, which resembles the physical setups. An overestimation of the neutron detection efficiency was obtained from the simulation compared to the experimental results. Similar overestimations have also been observed in several other setups[14, 16]. This overestimation may be because some of the neutrons are absorbed by small contaminants in the moderating polyethylene. Instead of using a normalization factor, we added a small amount of boron into the moderating polyethylene in the simulation to consider the neutron absorption effects.Figure 5a shows the reduced χ2,obtained by comparing the simulated and measured detection efficiencies, as a function of the boron mass fraction. The minimum of χ2was found at the boron mass fraction of 0.054% by fitting the curve using a parabola.The simulated total, inner-ring, and outer-ring detection efficiencies are shown in Fig. 5b.An estimation of the first excited state contributions was also carried out using the first excited state neutron component estimated from a statistical model calculation, calibrated using experimental data[19]and TALYS[25].The simulated total efficiencies with the first excited state neutron contributions are also shown by the blue short-dashed curve in Fig. 5b. The maximum deviation between the simulation with and without the contribution of the first excited state was 0.9%,which is negligible compared to the experimental uncertainty of 3.7%.
The boron contaminant affects not only the total efficiency but also the ratio Rin/out of the detection efficiencies of the inner- and outer-ring detectors. With the boron mass fraction obtained above, the measured ratio Rin/out was also well reproduced using the two simulations (see Fig. 5c). Except for the first point, the simulation results are 1%–3%lower than those of the experiment at Ep<2.4 MeV. Isotropic angular distributions were used in the simulations. The discrepancy in Rin/out between the simulations and experiment is probably due to the non-isotropic distribution of the emitted neutrons. For Ep = 2.45 and 2.6 MeV,the discrepancy between the simulated(with ground state neutrons) and the measured Rin/out ratios increase to 1.6% and 5%, respectively. This is due to the opening of the decay channel to the first excited state in51Cr (see Fig. 3). Considering the first excited state neutrons estimated from TALYS,the discrepancy is reduced to 0.6%and 2.3%for Ep=2.45 and 2.6 MeV,respectively,as shown in Fig. 5c.
The contribution from the decay channel to the first excited state is negligible regarding the total detection efficiency although its effects on the Rin/out is larger. The total, inner-ring, and outer-ring detection efficiencies for monoenergetic neutrons up to 4.5 MeV with an isotropic angular distribution were also simulated, as shown in Fig. 5d.
The dependence of the detection efficiency on the source position was measured by placing the detector array at different positions along the beam line (Z axis) using the51V(p, n)51Cr reaction at Ep = 2 MeV. Position Z = 0 corresponds to the target being at the center of the array.Moving the detector array forward in the beam direction corresponds to positive Z values and backward corresponds to negative Z values. The relative efficiencies at different positions were normalized using integrated incident beam currents on the target. The results for the total, inner-ring,and outer-ring detectors are shown in Fig. 6, together with the Geant4 simulations. In Fig. 6, the measured total efficiency at Z = 0 was normalized to the simulated value.Overall good agreements were found between the measurements and simulations.

Fig. 5 (Color online) a Reduced χ2, obtained by comparing the simulated and measured total detection efficiencies, as a function of the boron mass fraction.The curve is a parabolic fit of the reduced χ2.b Measured and simulated total, inner-ring, and outer-ring detection efficiencies as a function of the proton beam energy in the 51V(p,n)51Cr reaction. The blue short-dashed curve represents the simulation with the first excited state neutrons.The first excited state neutron component was estimated from a statistical model calculation calibrated using experimental data [19]. c Measured and simulated inner-to-outer ring ratios Rin/out at different proton-beam energies.d Simulated total, inner-ring, and outer-ring detection efficiencies for monoenergetic neutrons with isotropic angular distributions. The neutron range indicated by 13C(α, n)16O corresponds to the α energy range Eα = 300–800 keV
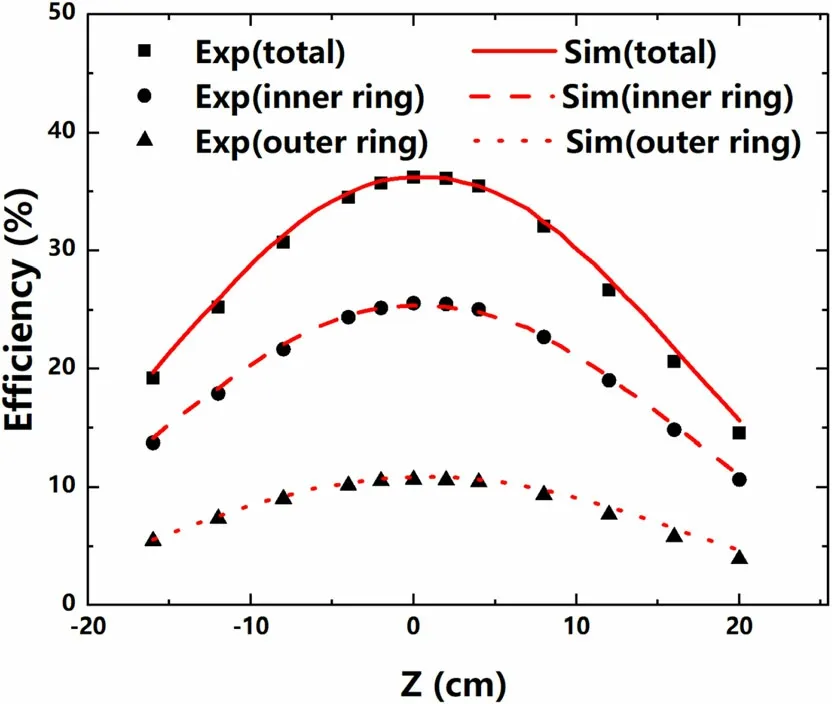
Fig. 6 (Color online) Detection efficiencies of the total (solid squares),the inner-ring(solid circles),and outer-ring(solid triangles)detectors as functions of the target position. The statistical errors are smaller than the symbol size. The solid, dashed, and long dashed curves are those from the Geant4 simulations
Considering the average deviation between the experimental data and simulations in Figs. 5b and 6, the difference between the Geant4 simulations and experimental results is 2.8%, which reflects one of the systematic uncertainties of our simulation and is quoted as the uncertainty of the Geant4 simulations.
4.2 Extrapolating the detection efficiency for the study of the 13C(α, n)16O reaction at stellar energies
It should be noted that the simulated efficiency in Fig.5 cannot be directly applied to the13C(α, n)16O reaction in which the emitted neutrons are neither mono-energetic nor isotropic. The asymmetry in the efficiency curves, shown in Fig. 6, indicates that the simulation predicts a slightly higher detection efficiency for the neutrons emitted at backward angles than that at forward angles. Because the angular distribution of the13C(α, n)16O reaction is not measured at low energies close to the Gamow window,theoretically predicted angular distributions were used in our simulations.Legendre polynomials up to the third order were used in calculating the angular distributions.Figure 7 shows the Legendre polynomial coefficient a1used in the angular distributions of the13C(α, n)16O reaction as a function of the beam energies in (a) and the representative angular distributions obtained at beam energies of 0.2,0.7,1.0534, and 1.2 MeV in (b). Adopting the angular distributions in Refs. [26, 27], the angular distribution effect on the efficiencies is corrected in our Geant4 simulations.

Fig. 7 (Color online) a Legendre polynomials coefficient a1 used in the angular distributions of the 13C(α,n)16O reaction as a function of the beam energies.The red curve is from Paris/Hale ENDF-8[26]and the black dots are from Ref. [27]. To match the excitation energy of 17O recommended by NNDC [28], the Legendre polynomials coefficients at approximately 1.05 MeV and 1.33 MeV are shifted to 2.4 keV and 1.7 keV, respectively, to higher energy. b Representative angular distributions obtained at beam energies of 0.2, 0.7,1.0534, and 1.2 MeV
The detection efficiencies were simulated using both isotropic and calculated angular distributions in the incident α energies between 0.2 and 3.15 MeV. In the simulation,the narrow resonances are ignored.Figure 8a shows the simulated efficiencies using isotropic and calculated angular distributions. For α energies between 0.3 and 0.8 MeV, the difference is 0.19%–2.28%, which is relatively small. However, above 0.8 MeV, the difference increases with a maximum of 4%.To evaluate the effect of the sharp resonance,we also simulated the detection efficiency at the energy where the a1coefficient reached its maximum at approximately E =1.0534 MeV, as shown in Fig. 7a. The resulting efficiency was 11% less than that with an isotropic angular distribution. Therefore, the angular distribution effect needs to be carefully evaluated for experiments aimed at achieving high precision.
The effects of the angular distributions were further evaluated by comparing the simulated and measured ratios of the inner- and outer-ring detection efficiencies Rin/out.As shown in Fig. 8b, the Rin/out is insensitive to the angular distribution and the simulations in both cases agree reasonably with the measured values from an underground measurement. The difference between the measured and simulated Rin/out values was ~ 4%. An alternative method for extrapolating the total detection efficiency was carried out as follows. The inner-ring detection efficiency was extrapolated to the neutron energy range relevant to the13C(α, n)16O reaction. The total detection efficiency was then obtained using the measured Rin/out values from an underground measurement. The difference in the total detection efficiency between the two extrapolation methods is ~ 2.5%, which is considered as another systematic uncertainty.

Fig. 8 (Color online) a Simulated detection efficiencies using isotropic (red dashed line) and theoretically predicted (blue solid line) angular distributions. b Simulated ratios Rin/out using both isotropic(red dashed line)and theoretically predicted(blue solid line)angular distributions. The solid triangles represent the measured Rin/out from an underground measurement
Considering the uncertainties of the Geant4 simulations(2.8%), extrapolation (2.5%), neutron angular distribution(2.3%), and detection efficiency of the HPGe detector (1.5%), the overall uncertainty of the detection efficiency for the13C(α,n)16O reaction in the energy range Eα=300–800 keV is determined as 5%. Excluding the narrow resonances, the maximum uncertainty of the neutron angular distributions is 4% if the energy range is extended to 2.4 MeV. According to the ENDF angular distribution, the maximum uncertainty of the neutron angular distributions at energies greater than 2.4 MeV is 12%.
5 Summary
A high-efficiency and low-background neutron detector array consisting of 243He proportional counters embedded in a polyethylene moderator was developed for the cross section measurement of the13C(α, n)16O reaction at the China Jinping underground laboratory.Because of the deep underground location and 5-cm-thick borated polyethylene shield, a low background of 4.5(2)/hour was achieved, of which 1.94(5)/hour was from the internal α radioactivity.The51V(p, n)51Cr reaction was used to calibrate the neutron detection efficiency of the array for neutrons with energies of En<1 MeV. For En >1 MeV, Monte Carlo simulation code Geant4 was used to extrapolate the detection efficiency. Specifically, an energy dependent detection efficiency, which can be directly applied to the13C(α, n)16O reaction, was obtained from the simulation.The effects of the angular distribution of the13C(α,n)16O reaction on the detection efficiency, which were overlooked in previous works, were evaluated in the present work and were shown to be non-negligible.
AcknowledgementsThe authors thank the staff of the 3 MV tandetron accelerator facility of Sichuan University for their support during the experiment. The authors also thank Carl Brune for estimating the neutron angular distribution corrections.
Author ContributionsAll authors contributed to the study conception and design. Material preparation, data collection, and analysis were performed by Yu-Tian Li, Tao-Yu Jiao, Bing-Shui Gao, and Wei-Ping Lin. The first draft of the manuscript was written by Yu-Tian Li,Bing-Shui Gao,Wei-Ping Lin,and all authors commented on previous versions of the manuscript. All authors read and approved the final manuscript.
杂志排行

Nuclear Science and Techniques的其它文章
- Dication-accelerated anion transport inside micropores for the rapid decontamination of pertechnetate
- Iterative Bayesian Monte Carlo for nuclear data evaluation
- Sparing lung tissue with virtual block method in VMAT planning for locally advanced non-small cell lung cancer
- Decomposition of oil cleaning agents from nuclear power plants by supercritical water oxidation
- Signal modeling and impulse response shaping for semiconductor detectors
- Nuclear mass based on the multi-task learning neural network method