Trends in carbon sink along the Belt and Road in the future under high emission scenario
2022-06-07JingPengLiDnXiTngFuqingYng
Jing Peng , Li Dn , , Xi Tng , Fuqing Yng
a CAS Temperate East Asia Regional Center and Key Laboratory of Regional Climate-Environment for Temperate East Asia, Institute of Atmospheric Physics, Chinese Academy of Sciences, Beijing, China
b Laboratory of Cloud-Precipitation Physics and Severe Storms (LACS), Institute of Atmospheric Physics, Beijing, China
Keywords:Carbon sink Soil respiration Climate change CO 2 concentration Biological nitrogen fixation Atmospheric nitrogen deposition
ABSTRACT Over the past three decades, the drawdown of atmospheric CO2 in vegetation and soil has fueled net ecosystem production (NEP).Here, a global land-surface model (CABLE) is used to estimate the trend in NEP and its response to atmospheric CO 2 , climate change, biological nitrogen (N) fixation, and N deposition under future conditions from 2031 to 2100 in the Belt and Road region.The trend of NEP simulated by CABLE decreases from 0.015 Pg carbon (C) yr − 2 under present conditions (1936–2005) to − 0.023 Pg C yr − 2 under future conditions.In contrast, the trend in NEP of the CMIP6 ensemble changes from 0.014 Pg C yr − 2 under present conditions to − 0.009 Pg C yr − 2 under future conditions.This suggests that the trend in the C sink for the Belt and Road region will likely decline in the future.The significant difference in the NEP trend between present and future conditions is mainly caused by the difference in the impact of climate change on NEP.Considering the responses of soil respiration (RH)or net primary production (NPP) to surface air temperature, the trend in surface air temperature changes from 0.01°C yr − 1 under present conditions to 0.05°C yr − 1 under future conditions.CABLE simulates a greater response of RH to surface temperature than that of NPP under future conditions, which causes a decreasing trend in NEP.In addition, the greater decreasing trend in NEP under future conditions indicates that the C–climate–N interaction at the regional scale should be considered.It is important to estimate the direction and magnitude of C sinks under the C neutrality target.
1.Introduction
The carbon (C) cycle at regional scales is one of the main sources of uncertainty identified in the Sixth Assessment Report of the Intergovernmental Panel on Climate Change (IPCC AR6) ( Canadell et al., 2021 ).For example, disputes are ongoing about whether the Amazon basin –one of the most important regions globally in terms of gross primary production (GPP) –is a C sink or source ( Phillips et al., 2009 ; Brienen et al.,2015 ; Gatti et al., 2021 ).Therefore, regions with more complex climate and topography, including East Asia, northern Africa, and western Europe, are affected by the strong interaction between land and atmosphere ( Dan et al., 2020 ).Thus, it is very important to accurately quantify the size and direction of C sinks ( Friedlingstein et al., 2006 ,2020 ; Cox et al., 2013 ; Ahlström et al., 2015 ; Fernández-Martínez et al.,2019 ).IPCC AR6 shows that, due to the lack of long-term, continuous and intensive temporal and spatial observed data of regional biogeochemical fluxes and C pool sizes ( Zhao et al., 2005 ; Le Quéré et al.,2009 , 2013 ; Phillips et al., 2009 ), there is great uncertainty regionally in C sink trends ( Canadell et al., 2021 ).Therefore, it is difficult to accurately assess the trends of regional C sinks at present, and especially in the future.Overall, this line of study is one of the important ways to improve the prediction and projection capabilities of earth system models(ESMs).
Over the past few decades, Chinese scientists have carried out a series of studies, including assessments of GPP, net primary production (NPP),soil respiration (RH), and net ecosystem production (NEP) ( Piao et al.,2009 ; Hu et al., 2010 ; Peng et al., 2014 ; Peng and Dan, 2015 ; He et al.,2019 ; Yuan et al., 2019 ).The results have shown that there are large uncertainties from different models ( Friedlingstein et al., 2013 ; Fernández-Martínez et al., 2019 ; Arora et al., 2020 ).At the same time, most lack the ability to quantitatively estimate the contribution of atmospheric nitrogen (N) deposition and biological N fixation (BNF) ( Peng et al., 2020 ).With this in mind, we selected regions (0°–60°N, 0°–150°E) mainly covered by the countries of the so-called “Belt and Road ”, including eastern Asia, central Eurasia, northern Africa, and western Europe.There are about 65 countries along the Belt and Road, together comprising 62%of the world’s population and covering about one third of the world’s total land area.Therefore, under the target of C neutrality, estimation of the C sink trends for such a key region is crucial.Specifically, we used the C sink (NEP = NPP − RH) to assess the C sink trend in this region under future conditions from 2031 to 2100.Not only does this region contain a large proportion of the world’s population, but it is also home to a diverse range of vegetation types (Fig.S1).Therefore, this region is a useful reference point for numerous types of ecosystems that can also be found in other regions.
This study is based on the work of Peng et al.(2020) , which used a land-surface model coupled with BNF.The aim was to improve the accuracy of C fluxes through a more complete set of N processes and improve our understanding of future changes in the potential of regional C sinks.This work is expected to serve as a useful reference for accurately assessing the trends in biochemical fluxes in China and its surrounding regions under the C neutral target.
2.Model, data, and experiments
CABLE is the abbreviation for the Australian Community Atmosphere–Biosphere–Land Exchange model.CABLE includes a biogeochemical model, which predicts both canopy leaf area index(LAI) and maximal leaf carboxylation rate (Vcmax).It uses a function of leaf C pool size to calculate canopy LAI, and applies leaf N and phosphorus (P) concentrations to estimate Vcmax ( Wang et al, 2010 ).It has previously been used to assess the impact of BNF on terrestrial C ( Peng et al., 2020 ), as well as to estimate annual GPP ( Beer et al.,2010 ), global evapotranspiration ( Zhang et al., 2013 ) and biogeochemical fluxes, and pool sizes of C and N ( Wang et al., 2010 , 2011 ).The version used for this study includes a global N cycle ( Wang et al., 2011 ;Peng et al., 2020 ).Also, N:P ratios were fixed for all pools, meaning the variation in the P cycle was not included.See Peng et al.(2020) for further details.
The meteorological inputs from 1901 to 2005 were generated by variables of the Global Carbon Project–Trends in the Land Carbon Cycle data ( Qian et al., 2006 ).From 2006 to 2100, they were generated (at the same spatial resolution) using the Community Earth System Model(CESM), version 1.0, under the Representative Concentration Pathway(RCP) 8.5 ( Hurrell et al., 2013 ) high emission scenario.
Here, we compared the strength of the c sink from CALBE with that of the ensemble from the sixth phase of the Coupled Model Intercomparison Project (CMIP6) ( Table 1 ).To measure the influence of CO2concentration, climate change, BNF, and atmospheric N deposition on C sink trends, we simulated the C sink trends for the periods 1936–2005 and 2031–2100 in several experiments, as follows: with (simulation 1)and without changes in atmospheric CO2concentration (simulation 2),without changes in climate change (simulation 3), without changes in BNF (simulation 4), or without changes in N deposition (simulation 5),after 1901 ( Table 2 ).The differences between simulations 1 and 2, simulations 1 and 3, simulations 1 and 4, and simulations 1 and 5 provide results on the impact of atmospheric CO2, climate change, BNF, and increasing N deposition on the C sink, respectively.

Table 1 Details of the models used in this study.

Table 2 Details of five simulations performed using CABLE.

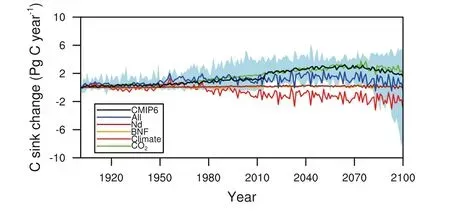
Fig.1.Annual C sink from 1901 to 2100 estimated by CMIP6 and CABLE across the Belt and Road regions.Effect of varying atmospheric CO 2 (green line), climate change (red line), BNF (orange line), and N deposition (brown line) and all factors combined (blue line) on the C sink during the same period as estimated using CABLE (units: Pg C yr − 1 ).
3.Results
3.1. Estimated C sink
Under present conditions, the trends in surface air temperature, CO2concentration, and N deposition were estimated as inputs, where BNF was a diagnostic variable simulated by CABLE ( Peng et al., 2020 ).This period was chosen such that our results were comparable with those from the business-as-usual C emissions (RCP 8.5) scenario during future conditions from 2031 to 2100.
Over the period 1936–2005, the results showed increasing trends of surface air temperature (0.012°C yr−1; Fig.S2), atmospheric CO2concentration (1.02 ppmv yr−1), BNF (0.10 Tg N yr−1), and N deposition(0.45 Tg N yr−1) in the Belt and Road region.By comparison, the estimated trends in this region of surface air temperature, CO2concentration, BNF, and N deposition were found to differ considerably under future conditions (2031–2100), being 0.054°C yr−1, 7.13 ppmv yr−1,0.16 Tg N yr−2, and 0.08 Tg N yr−2, respectively.
In order to estimate the general capabilities of CABLE, the NEP of the CMIP6 ESM ensemble was compared with the CABLE simulation( Fig.1 ).As can be seen, the trends in the C sink at the regional scale varied considerably among the different simulations in response to these changes.From 1936 to 2005, CABLE predicted a trend in the C sink of 0.015 Pg C yr−2, while the CMIP6 ensemble simulated a slightly smaller increasing trend of regional NEP than CABLE over the same period.In contrast, the regional NEP trend simulated by CALBE and CMIP6 decreased by − 0.023 and − 0.009 Pg C yr−2from 2031 to 2100, respectively.
The trends of NEP simulated by CABLE and the CMIP6 ensemble in the Belt and Road region under future conditions differ to those under the present conditions (Fig.S3).Over the historical period from 1936 to 2005, CABLE simulated a slightly upward trend in the Belt and Road region, as did the CMIP6 ensemble.However, under future conditions,CABLE simulated a clear decreasing trend of NEP, while the CMIP6 ensemble simulated a smaller one.

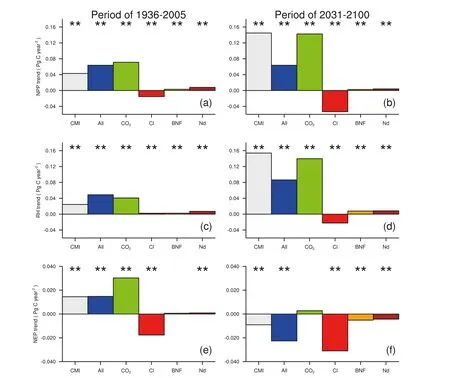
Fig.2.Trend of regional (a, b) NPP, (c, d) RH, and (e, f) NEP estimated from the CMIP6 ensemble (CMI) and CABLE (All (all of the factors), CO 2 , Cl (climate), BNF,and ND (nitrogen deposition)) under present conditions from 1936 to 2005 and future conditions form 2031 to 2100.A double asterisk ( * * ) indicates that the trend is statistically significant at the 0.05 level using the Student’s t -test.
3.2. Changes of trends in C fluxes under future conditions
To quantify the impact of modeling NPP and RH on the terrestrial C sink, we simulated NPP and RH for the period 1901–2100 in five experiments, in order to separate the effects of CO2concentration, climate change, BNF, and N deposition ( Fig.2 ).Based on the results, we estimate positive trends of 0.064 Pg C yr−2and 0.0489 Pg C yr−2from 1936 to 2005 for NPP and RH simulated by CABLE, respectively.As a result, a positive trend in the regional C sink resulted from the greater increasing trend in NPP.Under future conditions, CABLE estimated an increasing trend in NPP of 0.064 Pg C yr−2over time, whereas it estimated a greater increasing trend in RH of 0.086 Pg C yr−2.
With increasing atmospheric CO2concentration, CABLE predicted an increasing trend in NPP and RH from 1936 to 2005 of 0.071 and 0.041 Pg C yr−2, respectively ( Fig.1 and Fig.2 ).Both NPP and RH were simulated to have greater increasing trends in the Belt and Road region under future conditions at 0.143 and 0.140 Pg C yr−2, respectively.The increasing trend of RH was smaller than that of NPP in response to the increase in atmospheric CO2from 2031 to 2100.
In contrast, the responses of the simulated trends of NPP and RH to climate change using CABLE differed considerably in both direction and magnitude for the Belt and Road region ( Fig.2 ).CABLE predicted decreasing trends of NPP under both present and future conditions.The simulated responses of the trend in RH to climate change under present conditions differed to those under future conditions.For example, the slightly increasing trend in RH under present conditions transformed into a significant decreasing trend under future conditions.Under future conditions, CABLE simulated a much greater decrease in the RH trend than the NPP trend.
Under both present and future conditions, the simulated trends of NPP or RH were less responsive to changes in BNF than atmospheric CO2or climate change.Increased BNF caused a much greater increasing trend of RH than NPP, which in turn resulted in a decreasing trend of NEP.One of the reasons for this might be the positive feedbacks of BNF on terrestrial C ( Peng et al., 2020 ).Changes in the NPP or RH trend caused by N deposition under future conditions correspond well to the changes caused by BNF.

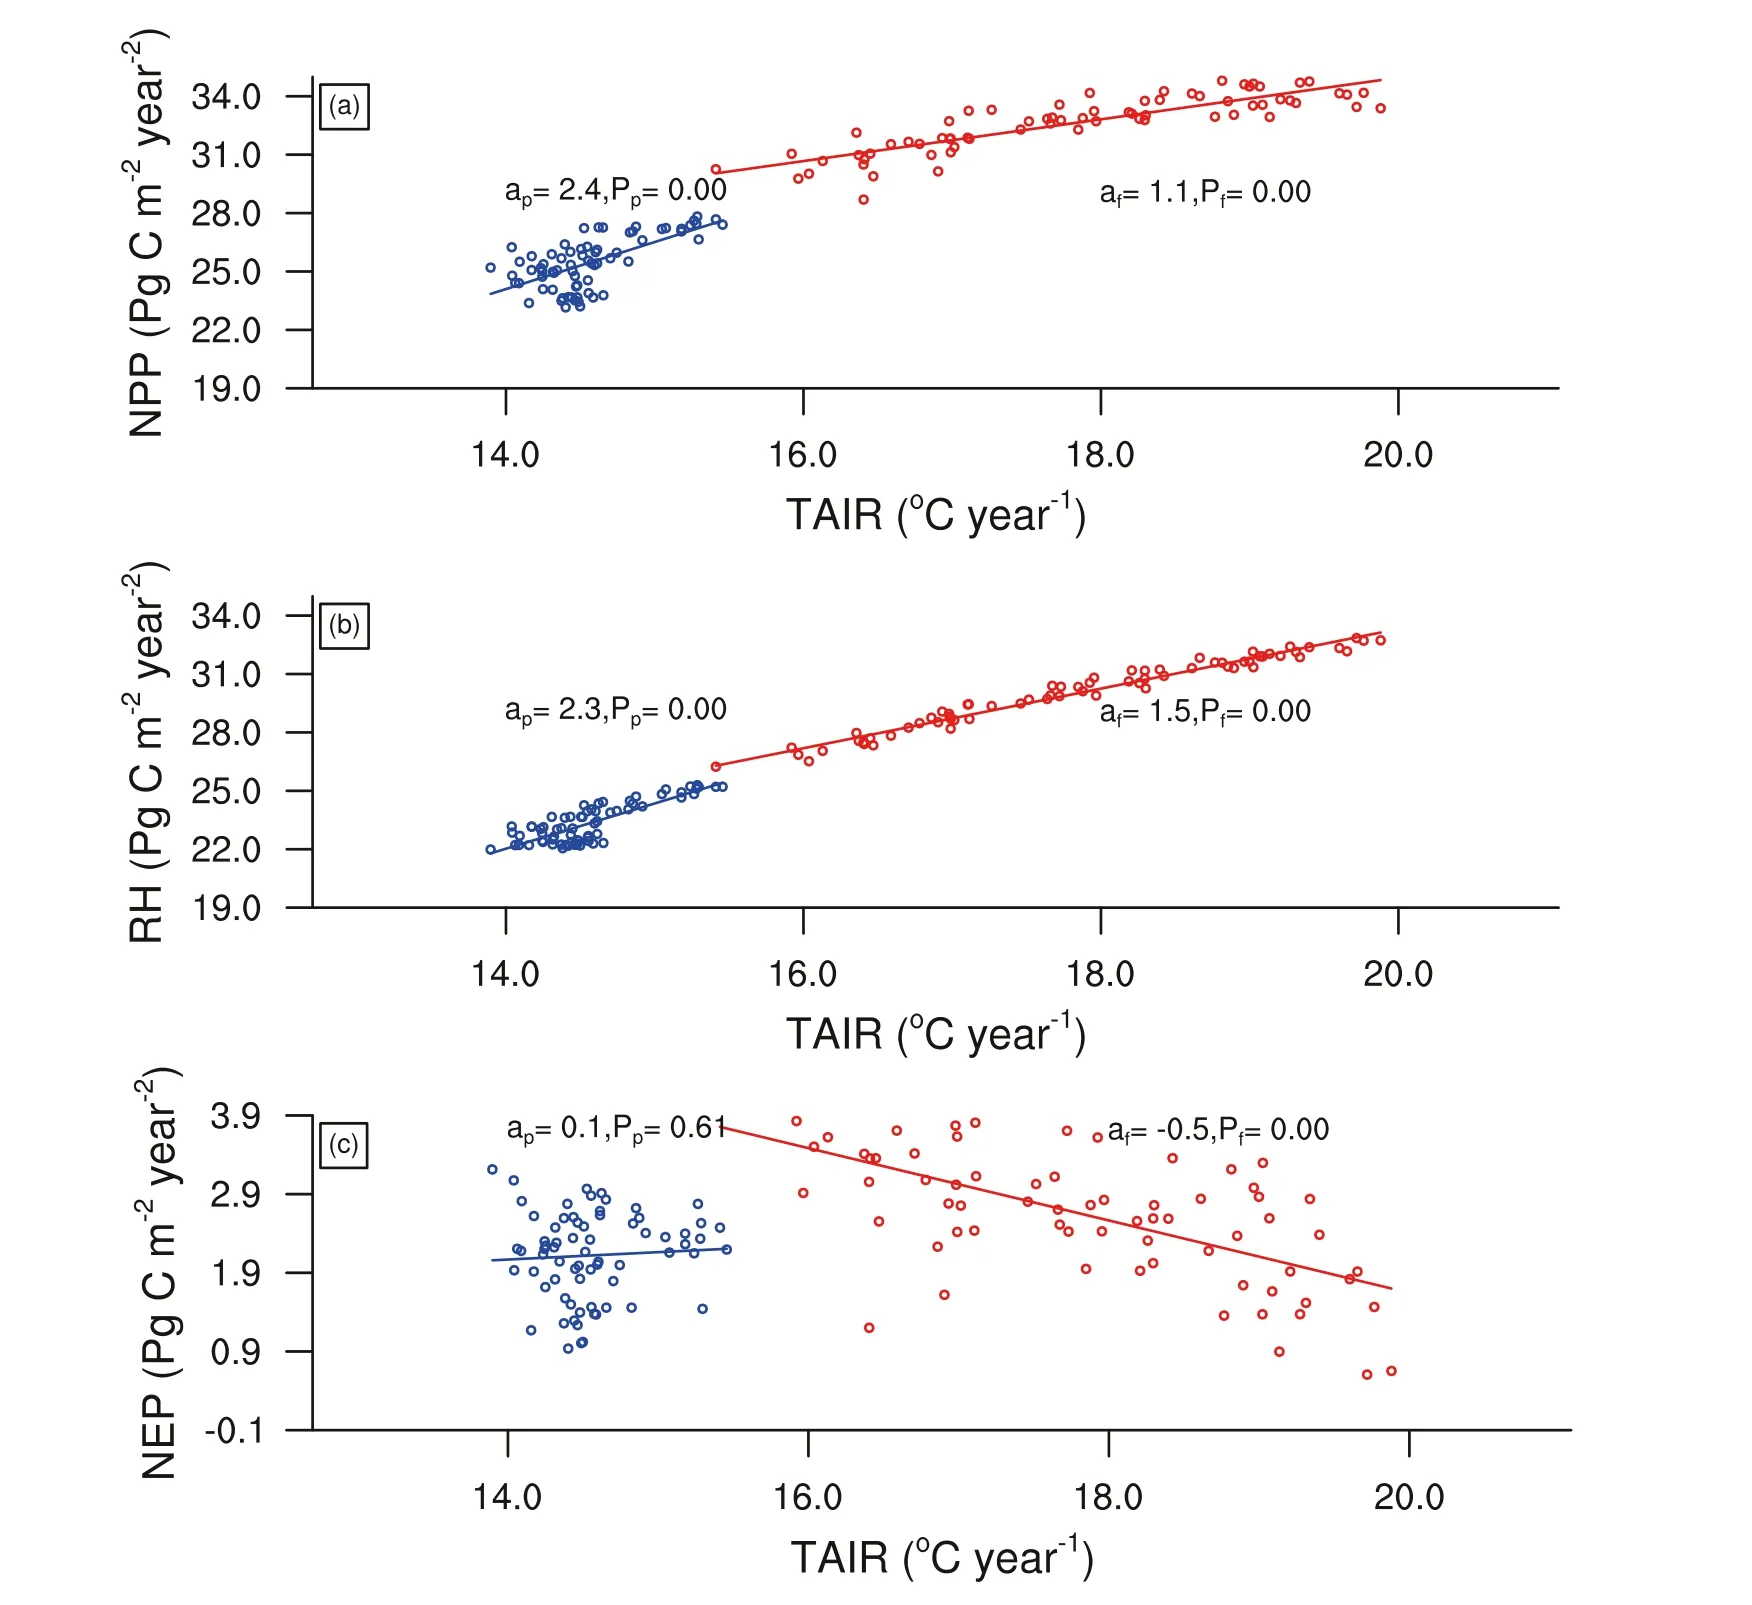
Fig.3.Response of the trend of (a) NPP, (b) RH, and (c) NEP to surface air temperature (TAIR) under present conditions from 1936 to 2005 (blue) and future conditions from 2031 to 2100 (red).The notation a p means the sensitivity of NPP, RH, or NEP to TAIR under present conditions.a f is similar to a p , except for future conditions.P p indicate the levels of statistical significance of the correlations between NPP and TAIR, RH and TAIR, or NEP and TAIR under present conditions.P f is similar to P p , except for future conditions.
3.3. Response to CO 2 , climate change, BNF, and N deposition
Simulations of the effects of changes in climate, atmospheric CO2,BNF and N deposition ( Fig.2 ) on the C sink were performed.With increasing atmospheric CO2concentration, an increasing C sink trend was predicted under present conditions, whereas the trend from 2031 to 2100 caused by CO2concentration for the Belt and Road region was negative.The decreasing trend of NEP from 2031 to 2100 for the Belt and Road region resulted from a greater increasing trend of RH than NPP caused by the increasing CO2concentration.CO2stimulates photosynthesis less than RH, causing a decreasing NEP trend ( Schimel et al.,2015 ; Fernández-Martínez et al., 2019 ).
The responses of the simulated C sink trend to climate change in the two periods differed considerably in magnitude for the Belt and Road region, although the direction was similar.CABLE predicted a decreasing trend under present and future conditions.Under future conditions,the simulated response of the negative trend of NEP to climate change was greater than that under present conditions.The much greater decreasing trend of NEP was caused by the decreasing trend of NPP being stronger than that of RH under future conditions.The general negative impact of climate on NEP may be due to the fact that higher temperatures have a greater effect on ecosystem respiration than on photosynthesis ( Fernández-Martínez et al., 2019 ).
The contribution of BNF to the trend of NEP only accounted for 4.3%under present conditions, while BNF resulted in 22.8% of the decreasing trend of NEP under future conditions.The relatively smaller effect of enhanced BNF on the increasing trend of NPP than that on RH resulted in the decreasing trend of NEP in response to increasing BNF.Overall,N deposition was simulated to have the smallest effect on NEP trends across the Belt and Road regions ( Fig.3 ).
4.Discussion and conclusions
The trend in NEP simulated by CABLE was estimated to change from 0.015 Pg C yr−2under present conditions to − 0.023 Pg C yr−2under future conditions, and the greatest influence on the decreasing trend of NEP under future conditions was found to be climate change.
Under future warming, the response of NPP to surface air temperature can contribute significantly to the predicted decreasing trend of NPP and therefore the decreasing trend of NEP ( Ballantyne et al., 2017 ).Here, we have shown a more positive response of RH to surface air temperature than that of NPP under future conditions ( Fig.3 ).
The trend of NEP simulated by the CMIP6 ensemble was larger than that simulated by CABLE, which was also reported for the C sink as sim-ulated by CMIP5 models ( Friedlingstein et al., 2013 ; Arora et al., 2020 ).This difference accounts for the present performance of the limitation of N on the modeling of C fluxes.Specifically, four out of the seven CMIP6 ESMs used in this study did not consider the N cycle.This might result in the C sink obtained from the CMIP6 ensemble being greater than that from CABLE.
Disclosure statement
No potential conflict of interest was reported by the authors.
Funding
This study was funded by the National Natural Science Foundation of China [grant numbers 41630532 , 41975112 , 42175142 , and 42175013 ].
Supplementary materials
Supplementary material associated with this article can be found, in the online version, at doi: 10.1016/j.aosl.2022.100149 .
杂志排行
Atmospheric and Oceanic Science Letters的其它文章
- Revisiting the size of nonspherical particles recorded by optical array probes with a new method based on the convex hull
- Effects of spring Arctic sea ice on summer drought in the middle and high latitudes of Asia
- Detection of the synoptic southeastward-extending Siberian cold high during 1978–2017
- Parameterizations of different hydrometeor spectral relative dispersion in the convective clouds
- Impact of intensity variability of the Asian summer monsoon anticyclone on the chemical distribution in the upper troposphere and lower stratosphere
- Inversion method for multi-point source pollution identification: Sensitivity analysis and application to European Tracer Experiment data
