Impact of intensity variability of the Asian summer monsoon anticyclone on the chemical distribution in the upper troposphere and lower stratosphere
2022-06-07KhngPngJiliLuoJiyiMuXioqunCoHongyingTinLinShngYnnGuo
Khng Png , , Jili Luo , , Jiyi Mu , Xioqun Co , , Hongying Tin , Lin Shng ,Ynn Guo
a College of Meteorology and Oceanography, National University of Defense Technology, Changsha, China
b Key Laboratory of Semi-Arid Climate Change and College of Atmospheric Sciences, Lanzhou University, Lanzhou, China
c College of Computer, National University of Defense Technology, Changsha, China
d Shandong Provincial Climate Center, Jinan, China
e Trainer Simulation Training Center of Naval Aeronautical University, Huludao, China
Keywords:Asian summer monsoon anticyclone Intensity index Chemical distribution Deep convection
ABSTRACT During the Asian summer monsoon (ASM) season, the process of stratosphere–troposphere exchange significantly affects the concentration and spatial distribution of chemical constituents in the upper troposphere and lower stratosphere (UTLS).However, the effect of the intensity of the Asian summer monsoon anticyclone (ASMA)on the horizontal distribution of chemical species within and around the ASMA, especially on the daily time scale, remains unclear.Here, the authors use the MERRA-2 reanalysis dataset and Aura Microwave Limb Sounder observations to study the impact of ASMA intensity on chemical distributions at 100 hPa during the ASM season.The intraseasonal variation of ASMA is classified into a strong period (SP) and weak period (WP), which refer to the periods when the intensity of ASMA remains strong and weak, respectively.The relatively low ozone (O 3 )region is found to be larger at 100 hPa during SPs, while its mixing ratio is lower than during WPs in summer.In June, analysis shows that the O3 horizontal distribution is mainly related to the intensity of AMSA, especially during SPs in June, while deep convections also impact the O 3 horizontal distribution in July and August.These results indicate that the intraseasonal variation of the ASMA intensity coupled to deep convection can significantly affect the chemical distribution in the UTLS region during the ASM season.
1.Introduction
The Asian summer monsoon anticyclone (ASMA), one of the major atmospheric circulation systems in the Northern Hemisphere (NH), is caused by adiabatic heating during the Asian summer monsoon (ASM)season ( Hoskins and Rodwell, 1995 ; Randel and Park, 2006 ; Bian et al.,2012 ).This stable circulation system behaves as a transport barrier to constrain air mass, and thereby prevents chemical constituents from being transported upwards from the surface by deep convection and other processes ( Li et al., 2005 ; Park et al., 2008 , 2009 ; Ploeger et al., 2017 ;Nützel et al., 2019 ).On the one hand, the confinement of ASMA causes the mixing ratios of various tropospheric tracers (such as carbon monoxide (CO)) to remain relatively high and the mixing ratios of stratospheric tracers (such as ozone (O3)) to be relatively low within the anticyclone( Li et al., 2005 ; Park et al., 2009 ; Garny and Randel, 2013 ; Pan et al.,2016 ; Luo et al., 2018 ).On the other hand, ASMA is identified as an important pathway for the transport of tropospheric constituents into the stratosphere through rapid convective transport and slow large-scale transport ( Li et al., 2005 ; Randel and Park, 2006 ; Park et al., 2007 , 2008 ;Randel et al., 2010 ; Ploeger et al., 2015 ; Pan et al., 2016 ; Garny and Randel, 2016 ).
The intensity of ASMA was defined to study its features.Ren et al.(2019) showed that the movement of the ASMA center is associated with the day-to-day variability of its intensity.Yuan et al.(2019) pointed out that CO and carbonaceous aerosols tend to be more abundant in the Asian tropopause aerosol layer when the intensity of ASMA increases.However, the characteristics of the ASMA intensity variation during different intraseasonal periods are still unclear,and the impacts of ASMA’s day-to-day intensity variation on the distribution of chemical constituents in the upper troposphere and lower stratosphere (UTLS) region are poorly understood.Basha et al.(2020) suggested that different phases need to be considered when interpreting the variability of pollutants and trace gases inside the anticyclone.Therefore, it is of great scientific significance to understand the ASMA intensity variation in different intraseasonal phases and the resulting chemical transport in the UTLS.
Satellite measurements have provided the most direct and accurate observations for the study of chemical constituent distributions in the UTLS region during the ASM season ( Park et al., 2007 ; Randel et al.,2010 ; Ploeger et al., 2015 ; Santee et al., 2017 ; Luo et al., 2018 ).Considering the limited horizontal resolution of the Aura Microwave Limb Sounder (MLS) dataset, here, we combine the MLS data with NASA’s Modern Era Retrospective Analysis for Research and Applications, version 2 (MERRA-2) reanalysis product, which has a high horizontal resolution and has been widely applied to investigate daily variations of chemical constituent distributions in the UTLS during the ASM season.One significant advantage of the MERRA-2 reanalysis data is that O3is included in the data it assimilates, which has proven to be very useful in many studies ( Molod et al., 2015 ; Reichle et al., 2017 ; Yuan et al.,2019 ).The purpose of the present study is to diagnose the effect of the anticyclonic intensity on the distribution and variation characteristics of chemical substances during the intraseasonal oscillation period of ASMA.The analysis combines O3data in the MERRA-2 reanalysis product with O3and CO in the MLS satellite data.Comparative analysis of O3from two different datasets can provide us with more insights into the impact of the daily ASMA intensity on constituent transport processes and reveal how the ASMA intraseasonal variation restrains the diffusion of its interior air.The relationship between constituent transport and the anticyclonic intensity variability will provide a theoretical basis for further study of the process of stratosphere–troposphere exchange during the ASM season.
2.Data and methods
2.1. Data
In this study, we use daily data extracted from MERRA-2.This dataset provides three-hourly global conventional meteorological data,i.e., geopotential height (GPH) and mixing ratios of chemical species like O3( Reichle et al., 2017 ).The MERRA-2 reanalysis product has a spatial resolution of 1.25° latitude × 1.25° longitude and 42 vertical levels(1000–0.1 hPa) ( Molod et al., 2015 ).Our investigation focuses on the NH summer seasons (June–August) during 2004–2018.The study area covers 0–60°N and 60°W–180°E, where the strongest dynamic circulation and the intraseasonal oscillation of ASMA occur ( Krishnamurti and Ardanuy, 1980 ; Hsu and Plumb, 2000 ; Ortega et al., 2017 ).
CO and O3data at 100 hPa from MLS version 4, level 2, during 2004–2018 are compared with MERRA-2 data to further verify the robustness of the reanalysis data.Since the MLS dataset has a relatively low daily sampling density ( ∼240 limb scans per orbit with ∼3500 profiles during both the daytime and nighttime) ( Luo et al., 2018 ), we remapped the MLS data to regular 2° latitude × 3° longitude grids.
Interpolated (2.5° longitude × 2.5° latitude) daily mean outgoing longwave radiation (OLR) data were obtained from the Climate Diagnostics Center of the National Oceanic and Atmospheric Administration.
2.2. Methods
2.2.1.Classificationofstrongandweakperiods
Following the approach proposed by Qian et al.(2002) , the daily ASMA intensity index (I) is defined as the value of the maximum GPH at 100 hPa in the region of 0–50°N and 0–150°E using the MERRA-2 reanalysis data.
To better distinguish the daily variation of ASMA intensity in June–July–August (JJA) and determine the relatively stronger/weaker ASMA periods, the daily intensity (I) and 15-yr averaged daily intensity (Ia) of ASMA in JJA for 2004–2018 are used to classify the intensity of ASMA on each day into two categories: “strong ” and “weak ”.Strong intensity is defined asIson a specific day being greater thanIaon this day.Weak intensity is defined asIwon a specific day being less thanIaon this day.
We define the longitude of the maximum GPH (I) in the study area as the central longitude of ASMA.If the zonal movement of the ASMA center exceeds 35° of longitude over 7 consecutive days, then the consecutive days are defined as a period of ASMA oscillation, noting that the longest number of days for each period has no limitation.Based on the classification of ASMA intensity, a period during which the ASMA intensity always remains in the strong intensity category (Is) is defined as a strong period (SP); similarly, a period during which the ASMA intensity always remains in the weak intensity category (Iw) is defined as a weak period (WP).
2.2.2.BoundaryofASMA
GPH is an appropriate variable that can be used to define areas outside ASMA ( Randel and Park, 2006 ; Bian et al., 2012 ; Basha et al.,2020 ), and a certain range of GPH is taken as the diffusion condition for external chemicals.We defined the boundary of ASMA at 100 hPa as the region enclosed by the 16700-gpm contour of GPH.Also, we use GPH = 16670 gpm to define the outer region of ASMA at 100 hPa mainly because the climatological mean GPH contours less than 16670 gpm are often not closed in some cases (not shown).
2.2.3.Correlationcalculation
We use the term “chemical_concentration ” to indicate mixing ratios of chemical species including O3at each grid.
We define “Inside ” as

which is the “chemical_concentration ” averaged over the grid points whose GPH is greater than 16700 gpm.It represents the concentration within the anticyclone.
“Outside ” is defined as

which is the “chemical_concentration ” averaged over the grid points whose GPH is greater than 16670 gpm and GPH is less than 16700 gpm.It represents the concentration in the margin of the anticyclone.
Ultimately, the algorithm for the correlation calculation is expressed(based on daily data) as

where ValueIis the variation of daily ASMA intensity in JJA of 2004–2018, and Value■Inside−Outside■is the absolute difference between O3“inside ” and “outside ” of ASMA.
3.Results
We first divide the intensity into two categories (strong and weak)based on the 15-yr averaged daily intensity classification discussed in section 2.2.1 to remove the annual cycle of the ASMA intensity.Then,we use the criteria mentioned in section 2.2.1 to characterize the period of ASMA.
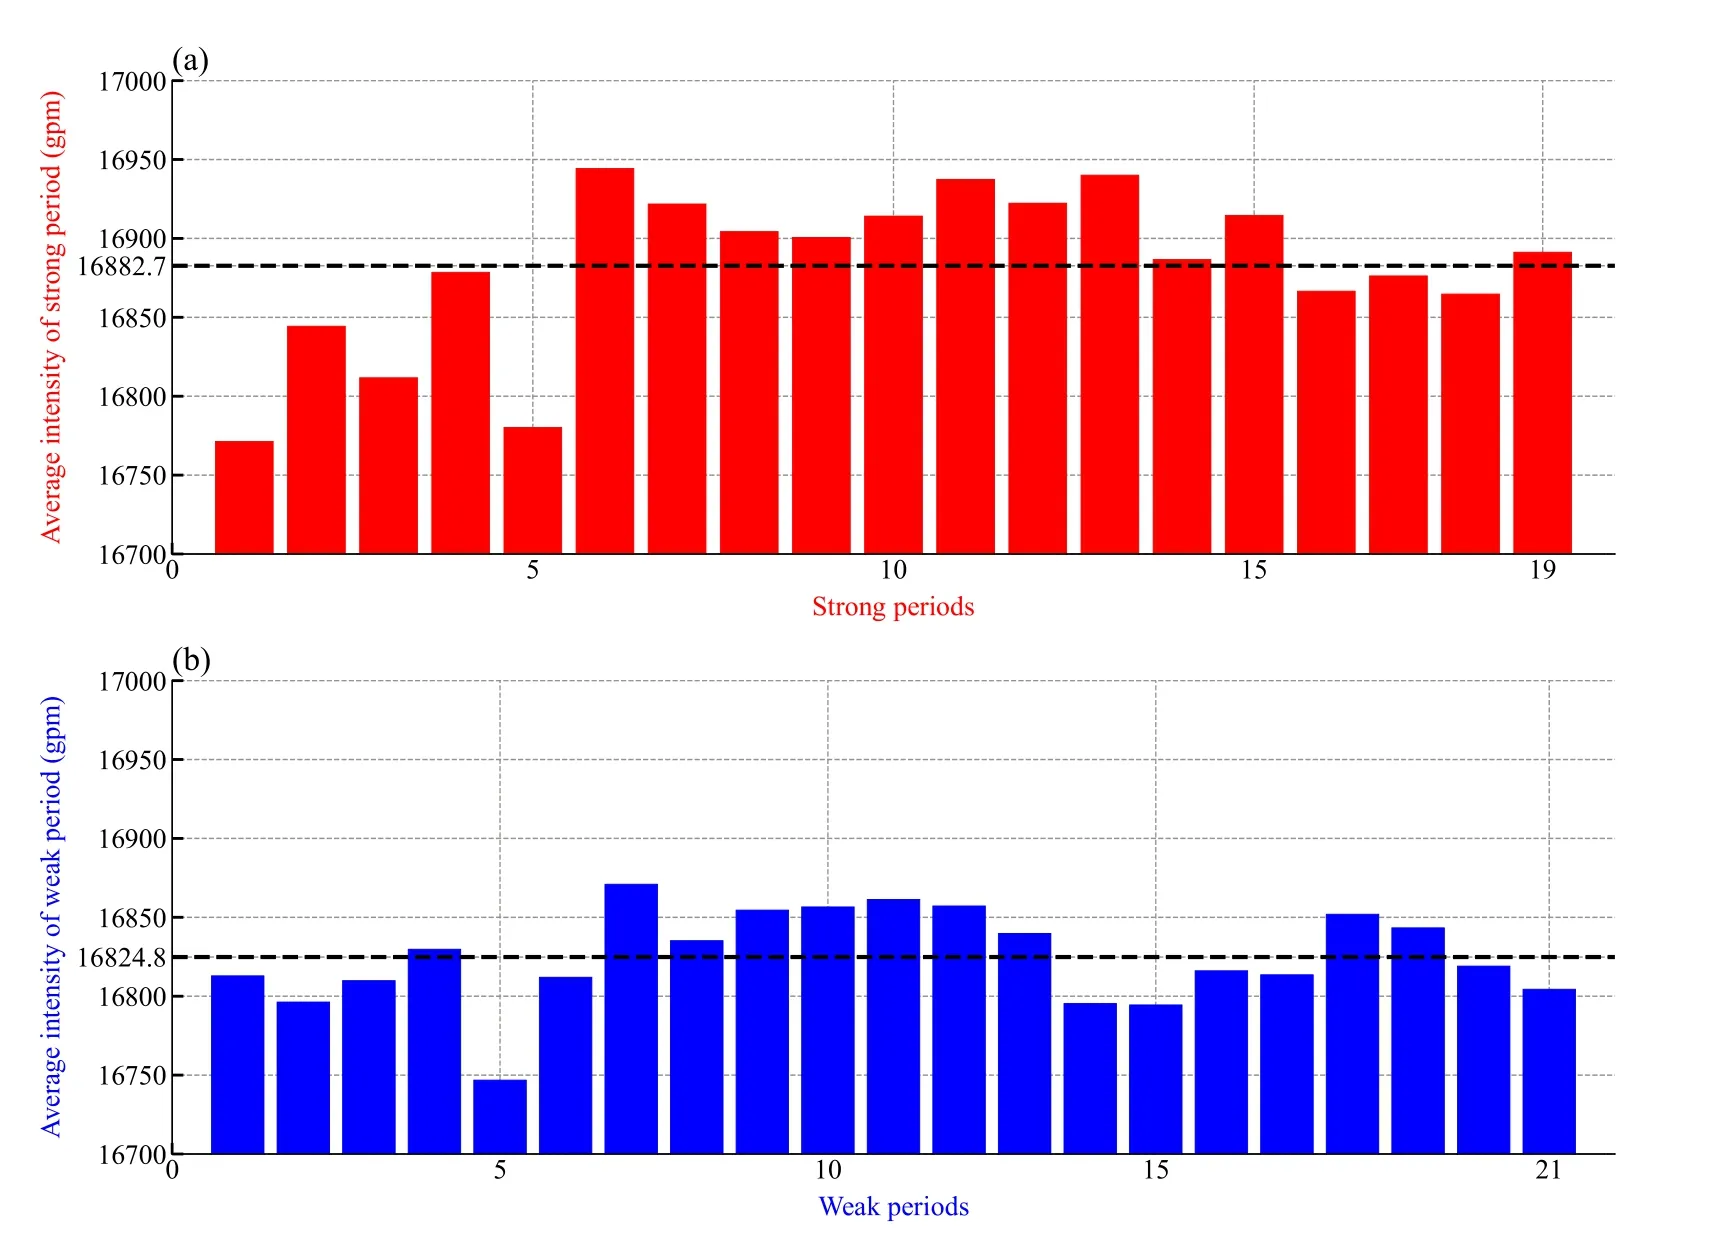
We ultimately identify 19 SPs and 21 WPs in the 15 years between 2004 and 2018.The averaged ASMA intensity for the selected SPs/WPs is shown in Fig.1 .The mean intensity during SPs is 16882.7 gpm, while that during WPs is 16824.8 gpm.It is evident that most of the average intensity during SPs is greater than that during WPs, which also verifies the rationality of theIaselected in the present study.

Fig.1.Average ASMA intensity of (a) 19 strong (red bars) periods and (b) 21 weak (blue bars) periods identified between 2004 and 2018.

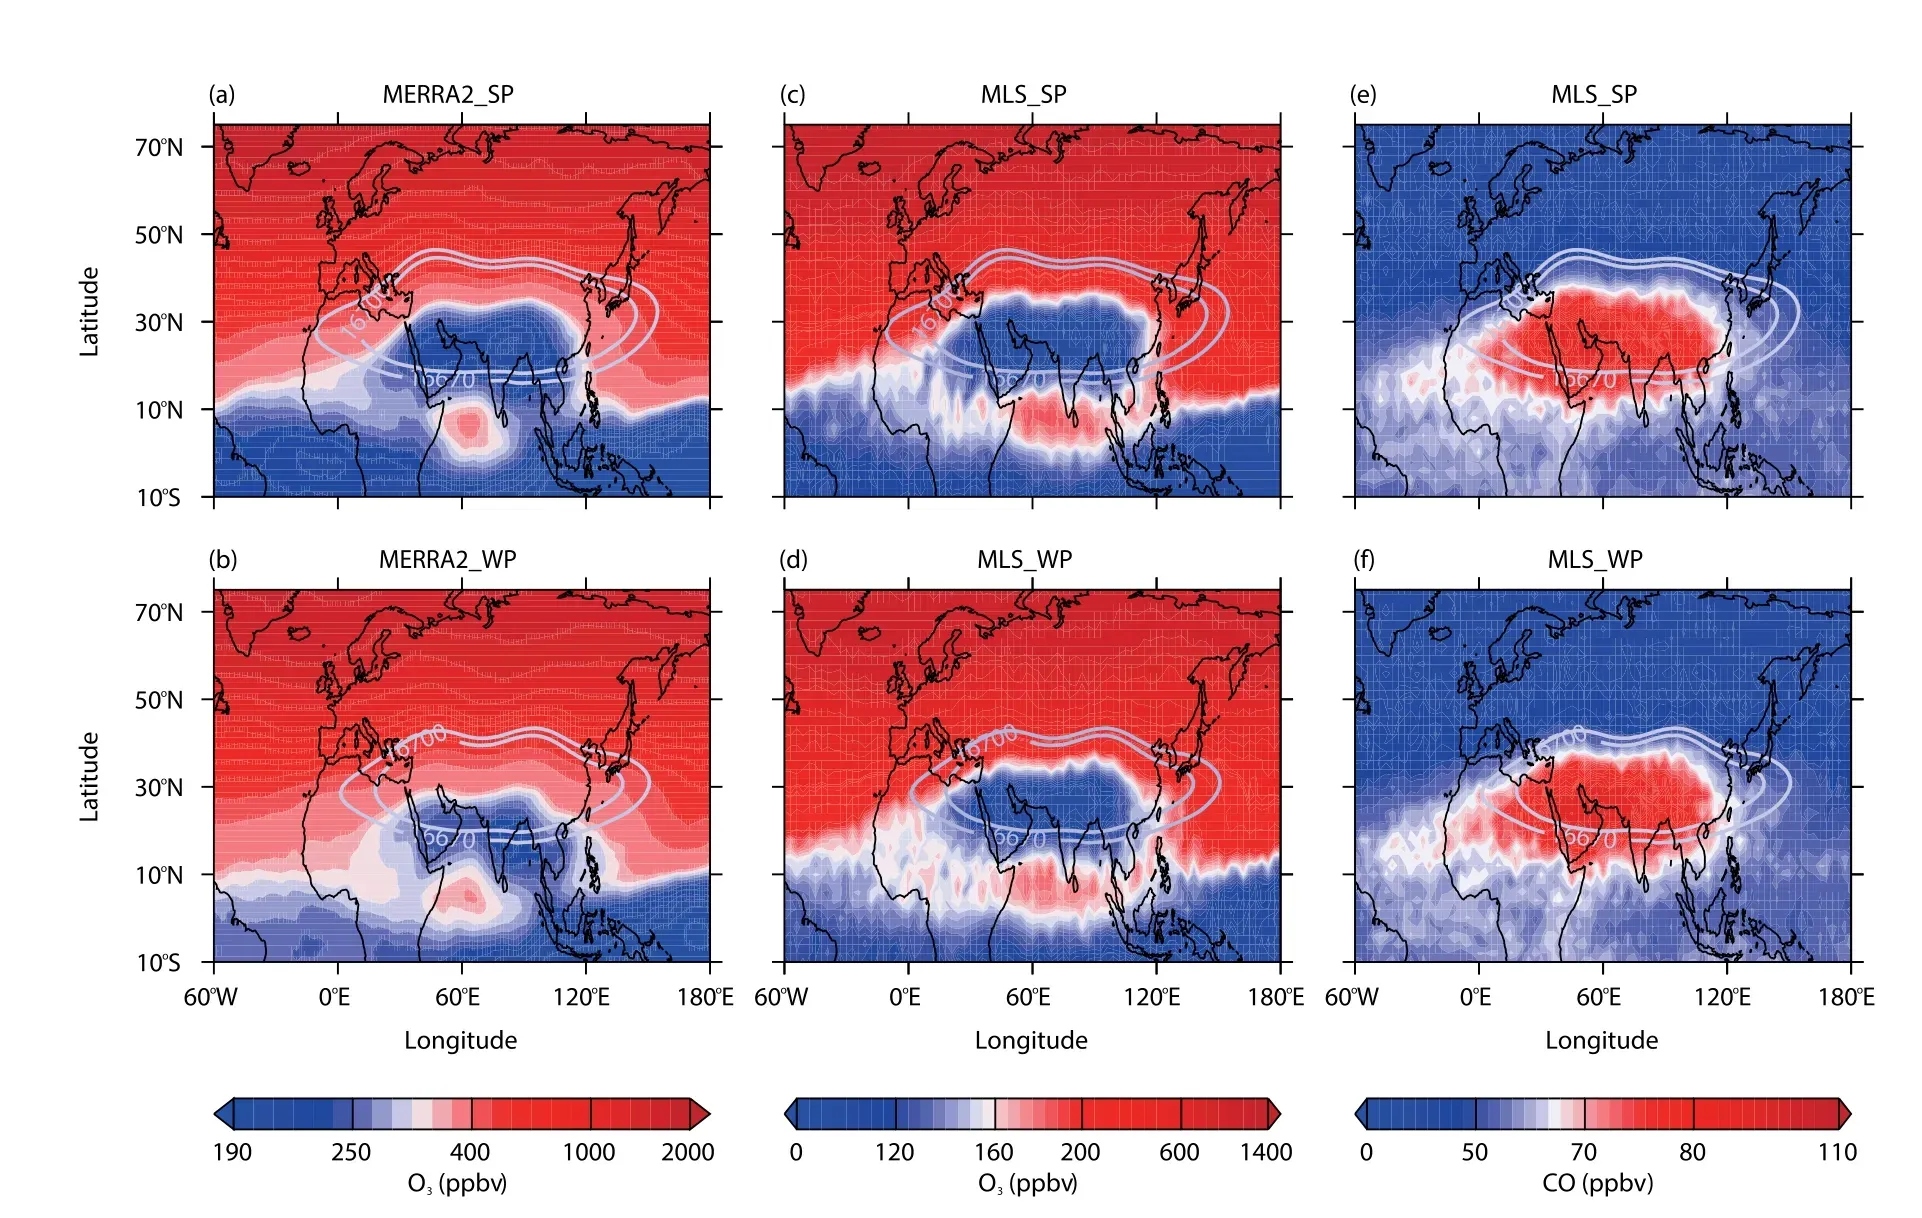
Fig.2.Horizontal distributions in strong periods and weak periods of (a, b) MERRA-2 O3 , (c, d) MLS O 3 , and (e, f) MLS CO mixing ratio (ppbv) at 100 hPa during 2004–2018.The upper panels are for averages in strong periods and the lower panels for weak periods.Superimposed white solid contours in (a–f) indicate the interior boundary of ASMA at 100 hPa (defined as GPH = 16700 gpm) and the outside edge of ASMA (defined as GPH = 16670 gpm).The MLS O 3 and CO daily composite maps that include all the selected periods are remapped to 3° longitude × 2° latitude grids.Note that we use different color scales of O 3 for different datasets due to the different resolutions of MERRA-2 and MLS.

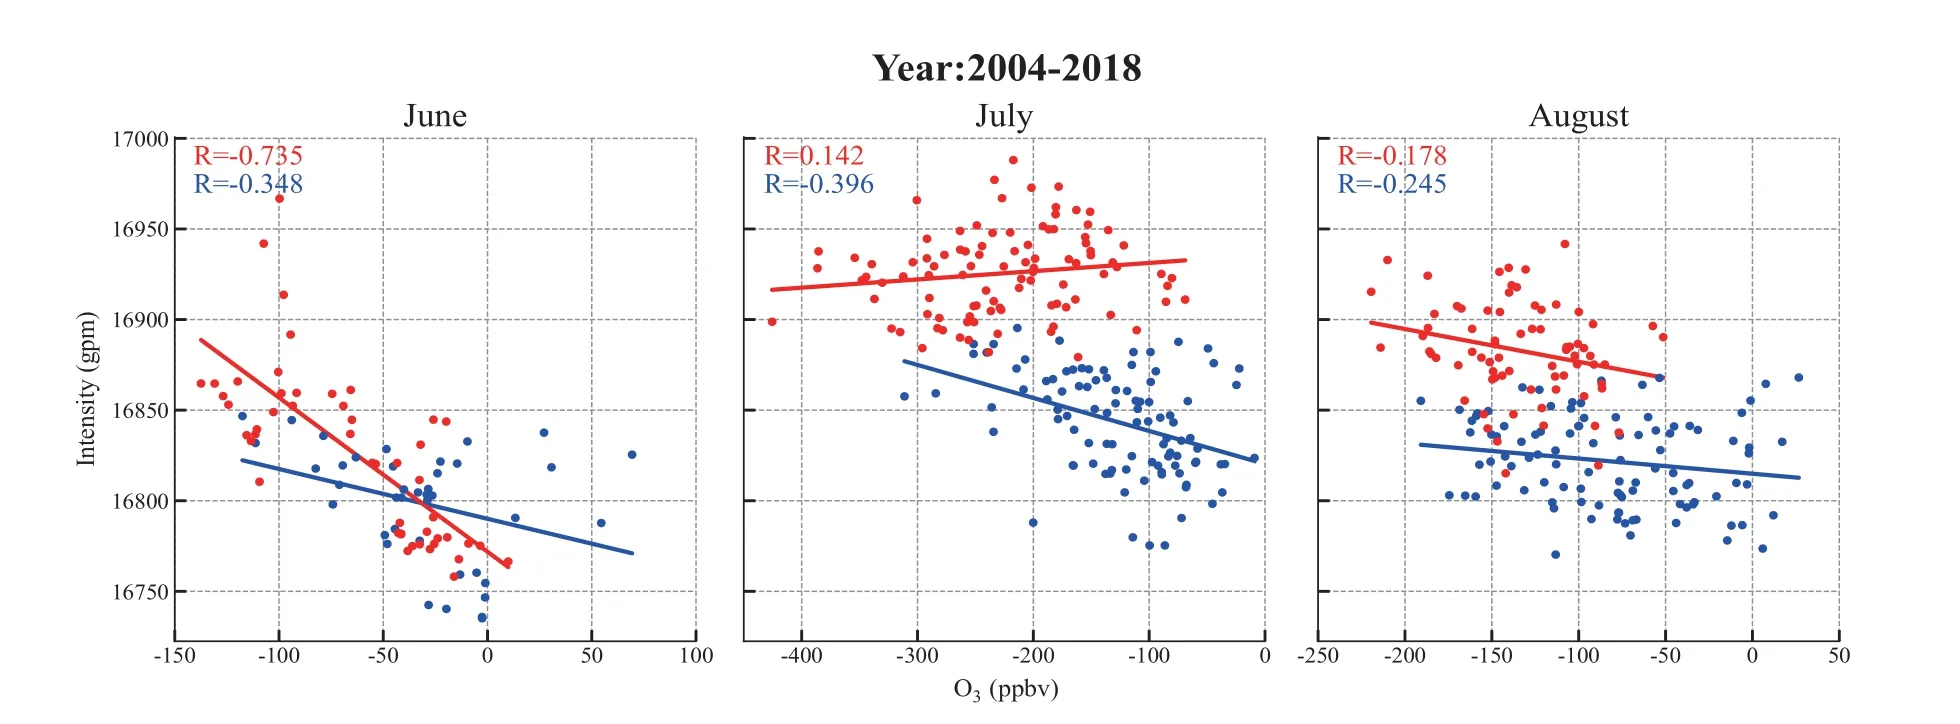
Fig.3.Scatterplots of daily intensity of ASMA at 100 hPa versus the daily inside-minus-outside O 3 difference in June, July, and August.Each red point indicates one day in SPs, and each blue point indicates one day in WPs.

Fig.4.Mean horizontal distributions of O 3 mixing ratio (ppbv) at 100 hPa in strong periods (left) and weak periods (right) for June (upper), July (middle), and August (lower) during 2004–2018.The black dashed contour and the black solid contour represent 16700 gpm and 16670 gpm, respectively.The green solid contours represent deep convection (OLR ≤ 205 W m − 2 ).
Fig.2 shows the composite horizontal distributions of O3from MERRA-2 and O3and CO from MLS at 100 hPa averaged over SPs and WPs of the 15 years from 2004–2018.Consistent with previous studies, the above data show a minimum O3and a maximum CO within the ASMA region ( Li et al., 2005 ; Randel and Park, 2006 ; Park et al.,2009 ; Garny and Randel, 2013 ) in both SPs and WPs.However, both datasets show that the relatively low O3or high CO region within ASMA is smaller during WPs than during SPs ( Fig.2 (a–d)).Consistently, a smaller relatively low O3or high CO mixing ratio region corresponds to higher O3or lower CO during WPs than during SPs.In addition to the above difference, we also found that although the relatively low O3or high CO within the ASMA may mix with the outside air to the south of the anticyclone in both SPs and WPs, differences are evident between them, i.e., the difference of the O3mixing ratio in the south of ASMA and to its south is larger in SPs than during WPs.Hence, we further investigate the differences in the O3mixing ratios “inside ” and “outside ” of the anticyclone from MERRA-2 and their correlations with the intensity of ASMA in SPs/WPs in each month of JJA.
Fig.3 shows scatterplots of daily ASMA intensity and the differences in the O3mixing ratio between “inside ” and “outside ” of ASMA in June,July, and August during 2004–2018.It shows that the correlations are− 0.735 and − 0.348 in SPs and WPs for June, respectively.That is to say,a stronger intensity of ASMA is accompanied by larger differences in the O3mixing ratio “inside ” and “outside ” of the anticyclone.Moreover, the intensity of ASMA plays a more important role in the O3horizontal distribution at 100 hPa in SPs in June.In July and August, the correlations of the intensity of ASMA and the O3difference are weaker than June,especially in SPs.
To identify the cause of the differences in the correlation coefficients in Fig.3 , we compared the composite O3horizontal distributions at 100 hPa for SPs and WPs in each month of JJA ( Fig.4 ).It is clear that the relatively low O3region within the anticyclone is larger in SPs and smaller in WPs for all months, which is in good agreement with the result shown in Fig.2 .The horizontal distribution of O3to the south of the anticyclone also differs in SPs and WPs in each month.The OLR can serve as a proxy for deep convection in the tropics, with lower OLR values corresponding to enhanced convective activity.It is shown that deep convections located in the southeast of the anticyclone are strongest in July in both SPs and WPs.The relatively low O3in the southeast of the anticyclone is associated with the deep convective region in July and August, resulting in the relatively low correlation of the intensity of ASMA and the O3difference “inside ” and “outside ” of the anticyclone in these two months.Deep convections are weak in June and lead to the intensity of ASMA playing a dominant role in affecting the O3horizontal distribution.
4.Conclusions
In this study, we define an ASMA intensity index and classify the ASM season into strong periods and weak periods (SPs/WPs) based on the specified criteria for the index.The daily ASMA intensity index and the 15-yr averaged daily threshold (Ia) are used to classify the intensity and then define the SP and WP together with the central longitude variation.A total of 19 SPs and 21 WPs from 2004 to 2018 are identified for further analysis.
The relationship between ASMA intensity and chemical distributions(O3and CO) at 100 hPa is investigated based on the daily composite analysis of SPs and WPs using O3data from MERRA-2 and MLS as well as CO from MLS during the ASM seasons from 2004 to 2018.Both tracers show different horizontal distributions in WPs and in SPs.A larger relatively low O3(high CO) region and lower O3(higher CO) mixing ratio within ASMA are found in SPs.
In our analysis of monthly and periodic chemical distributions, June,July, and August are used to distinguish the situations between SPs and WPs.We propose a correlation analysis method that uses the ASMA intensity, OLR, and differences between tracer concentrations inside and outside ASMA.The monthly distributions illustrate that the minimum range of O3tends to be larger in SPs than that in WPs, which have a good agreement with the composite period.Moreover, the concentration extent of chemicals varies with ASMA intensity variation in June but is also impacted by deep convection in July and August.The relative contribution of AMSA intensity and deep convections may need further exploration.The conclusions of this study are based on an analysis of daily ASMA intensity and the distribution of atmospheric components.Further studies of the underlying dynamical mechanisms are necessary.
Funding
This research is sponsored by Strategic Priority Research Program of the Chinese Academy of Science [grant No.XDA17010106], the National Key Research and Development Program of China [grant Nos.2018YFC1505703 and 2018YFC1506704].
杂志排行
Atmospheric and Oceanic Science Letters的其它文章
- Revisiting the size of nonspherical particles recorded by optical array probes with a new method based on the convex hull
- Effects of spring Arctic sea ice on summer drought in the middle and high latitudes of Asia
- Detection of the synoptic southeastward-extending Siberian cold high during 1978–2017
- Parameterizations of different hydrometeor spectral relative dispersion in the convective clouds
- Inversion method for multi-point source pollution identification: Sensitivity analysis and application to European Tracer Experiment data
- Response of a westerly-trough rainfall episode to multi-scale topographic control in southwestern China
