Top-down strategy for bamboo lignocellulose-derived carbon heterostructure with enhanced electromagnetic wave dissipation
2022-04-27ShaoxiangCaiHanYanQiuyiWangHeHanRuLiZhichaoLou
Shaoxiang Cai,Han Yan,Qiuyi Wang,He Han,Ru Li,Zhichao Lou,5,*
1 School of Textile Garment and Design,Changshu Institute of Technology,Changshu 215506,China
2 Jiangsu Co-Innovation Center of Efficient Processing and Utilization of Forest Resources,Nanjing Forestry University,Nanjing 210037,China
3 College of Materials Science and Engineering,Nanjing Forestry University,Nanjing 210037,China
4 Department of Materials Science and Engineering,Southern University of Science and Technology,Shenzhen,Guangdong 518055,China
5 College of Engineering,University of Georgia,Athens 30605,GA,USA
Keywords:Carbon heterostructure Conductive loss Pyrolysis Interface Bamboo lignocellulose Nanostructure
ABSTRACT Biomass-derived residue carbonization has been an important issue for‘‘carbon fixation”and‘‘zero emission”,and the carbonized products have multiple application potentials.However,there have been no specific research to study the differences in macro-and micro-morphology,electrical properties and many other aspects of the products obtained from carbonization of pure cellulose,pure lignin or their complex,lignocellulose.In this work,lignocellulose with cellulose to lignin mass ratio of 10:1 is obtained using p-toluenesulfonic acid hydrolysis followed by homogenization process at a controlled condition.Then,carbon heterostructure with fibers and sheets (CH-10) are obtained by pyrolysis at 1500 °C.Detailed results imply that the fiber-like carbon structure possesses high crystallinity and low defect density,coming from carbonization of the cellulose content in lignocellulose (LC) nanofibers.Correspondingly,the graphite-like carbon sheet with high defect density and low crystallinity comes from carbonization of the lignin content in LCs.Further investigation indicates CH-10 possesses enhanced polarization and moderate impedance matching which makes it an ideal candidate for electromagnetic wave (EMW) absorption.CH-10 exhibits an excellent EMW absorption performance with a minimum RL value of -50.05 dB and a broadest absorption bandwidth of 4.16 GHz at a coating thickness as thin as 1.3 mm.
1.Introduction
The main component of biomass materials is organic matter,which contains a large number of carbon elements and is an important carbon source[1,2].Since the concept of carbon neutralization has been widely accepted,in particular,the Chinese government has proposed to strive to achieve the peak of carbon by 2030,and to achieve carbon neutralization by 2060,how to make rational use of biomass materials,especially the reasonable treatment of increasingly serious biomass waste,and reduce the greenhouse gases generated by direct or indirect burning of biomass materials,to achieve ‘‘carbon fixation”and ultimately achieve‘‘zero emission”of carbon dioxide,is now not only an important environmental issue but also an important political issue[3,4].Biomass waste can be converted into biomass carbon by pyrolysis.Because biomass carbon has many advantages including porous,light weight,wide source,low cost,acid and alkali corrosion resistance,it can be widely used in biomedicine,energy,environment,aerospace and many other high-tech fields[5–10].Thus,using biomass waste as raw material to prepare biomass carbon materials can not only improve the added value,but also achieve carbon neutralization.
Most of the studies on the preparation of biomass-derived carbon materials rarely distinguish the effects of lignin and cellulose components in biomass materials on the properties of carbon materials[11,12].By now,the composition of pure carbonized lignin and carbonized cellulose has been studied thoroughly[13–15].There are two main differences between lignin-derived carbon(Clignin) and cellulose-derived carbon (C-cellulose):(1) the crystallinity and graphitization degree;(2) the submicroscopic structure.According to previous work,at lower temperature,the composition of C-lignin and C-cellulose is basically the same,mainly amorphous carbon [16].However,when the temperature rises to 1500 °C,the composition and structure of C-lignin and Ccellulose are opposite [17,18].It is generally known that lignin is formed by irregular polymerization of three monomers (pcoumaryl,coniferyl,and sinapyl alcohol)containing aromatic rings,which is suitable for the formation of 6-carbon atomic rings during carbonization;however,the accumulation of graphitized sheets destroys the graphitization process[19,20].Cellulose mainly forms a chain-like structure in the form of O-containing 6 membered(C)5-O rings,which is destroyed during pyrolysis and produce CO2,CH4or H2O;however,when a large number of such chain structures are carbonized at the same time,it is conducive to the formation of crystalline carbon structure[21].Therefore,as a composite of lignin and cellulose,the preparation and property adjusting of biomass-derived carbon materials must be carried out on the basis of knowing the content of polymer components in the biomass source.
In conclusion,biomass-based carbon materials should be considered as heterogeneous carbon materials instead of pure carbon materials.Thus,the interfacial effect,polarization effect and various matching effects should be paid more attention in the development of novel applications based on the response of biochar to external field [22,23].Almost all the natural lignin and cellulose are linked at more than two sites by ether bond or ester bond,which are accompanied by non-covalent bond,forming lignocellulose in biomass materials [24,25].As reported,lignocellulose(LC) nanofibers with different proportions of cellulose and lignin have been successfully isolated by organic acid hydrolysis followed with homogenization [26].In this work,LCs with the mass ratio of cellulose to lignin of 10:1 was extracted from bamboo.After that,the obtained LCs were further carbonized in noble gas at 1500 °C.On this basis,we analyzed the microstructure,chemical composition,and crystalline state of the carbonized products.The differences between the products and pure Clignin/C-cellulose in dielectric properties and polarization effect were investigated in-depth.Finally,the potential application prospect in the field of electromagnetic (EM) dissipation of such product is verified.
2.Materials and Methods
2.1.Materials
Bamboo residues were provided from Zhuangchi Home Technology Co.,Ltd.(Jiangxi,China).p-toluenesulfonic acid (p-TsOH)was analytical reagent and purchased from Aladdin Chemical Co.Ltd.,Shanghai,China.All aqueous solutions were prepared with deionized water from a Barnstead Nanopure Diamond Laboratory Water System.
2.2.Methods
2.2.1.Lignocellulosic nanofibers synthesis
LCs were isolated from bamboo fibers which were prefabricate by steam-explosion of natural bamboo residues at 190 °C for 10 min,according to our previous report [26].To specific,the bamboo fibers were treated with acid solution(60% (mass)) at 80 °C for 120 min under continuous stirring of 400 r.min-1.Then,the reaction was quenched by adding 50 ml DI (deionized).The residual solids were separated through filtration under vacuum and washed with DI water.Then,mechanical fibrillation was carried out by feeding 1% (mass) residual solid suspension into a high-pressure homogenizer (FB-110Q,Litu Mechanical Equipment Engineering Co.,Ltd,Shanghai,China) to produce LCs.
2.2.2.Pyrolysis treatment
The prepared LCs were put into a tubular furnace.After air being purged by N2flow for 30 min,the samples were heated to 1000°C at a heating rate of 10°C.min-1followed by 1-hour annealing.Then the samples were further heated to 1500°C with a heating rate of 5 °C.min-1followed by 2-hour annealing.Finally,the products were cooled down to ambient temperature under N2protection,which were named as CH-10.
2.3.Characterization
2.3.1.Atomic force microscopy (AFM)
An Asylum Research MFP-3D Bio AFM machine from Oxford Instruments Company was used to investigate the morphologies of LCs.A silicon cantilever tip with a spring constant of 26 N.m-1were used (Model:AC160TS-RS).Its corresponding radius is 7 nm.50–100 μl LCs solution diluted 1000 times with ultrapure water was dropped on the freshly curved mica surface.After incubation for 30 min,500 μl ultrapure water was sucked each time with a pipette to gently wash the mica surface.After repeated washing for 5 times,mica was installed on the substrate tray of AFM until the mica surface was naturally dried.All the images were taken under AC Air Topography format with a scanning rate of 0.5 Hz.The 1024 × 1024 points AFM images were processed by Software from Oxford.
2.3.2.Cellulose and lignin content testing
The chemical components of the untreated and synthesized magnetic wood were determined based on the procedure developed by the National Renewable Energy Laboratory [27].For details,the concentration of monosaccharides in the supernatants were determined using a high-performance liquid chromatography(HPLC)system with a refractive index(RI)detector,and 5 mmol.L-1H2SO4solution was used as the eluent at a flow rate of 0.6 ml.min-1.
2.3.3.Scanning electronic microscopy (SEM)
Morphologies of the samples were tested by environmental SEM(Quanta 200,FEI Company in Holland)with the magnification from 400 to 6000.
2.3.4.High-resolution transmission electron microscope (HR-TEM)
HR-TEM images were obtained by FEI Tecnai G2 F20 S-TWIN operated at 80–200 kV which are equipped with a Cs corrector for HR-TEM measurements.The samples were deposited from an aqueous suspension onto a carbon-Formvar-coated copper TEM grid.
2.3.5.X-ray diffraction (XRD) analyses
XRD pattern of each specimen with a mass of 200 mg was obtained on a Bruker D8 Advance powder X-ray diffractometer(Germany) employing Cu-Kα radiation (λ=0.154 nm) at 40 kV and 40 mA and being operated with a 2θ scanning range of 5°–90°.
2.3.6.X-ray photoelectron spectroscopy (XPS)
The XPS spectrum of each specimen was measured in an AXIS UltraDLD(Shimadzu,Japan)using an Al Ka X-ray source and operating at 150 W.
2.3.7.Raman spectroscopy
Raman spectra of each specimen was recorded using a Renishaw in-via Raman micro-spectrometer.A 50X objective was used with frequencies from 800 to 1800 cm-1with a spectral resolution of 2 cm-1,using a Renishaw in-via Raman micro-spectrometer which was equipped with a 785 nm laser.The average of 10 collected spectra for each sample was calculated to represent the Raman pattern of one sample.
2.3.8.Electromagnetic properties measurement
Samples with a filler loading rate of 15% (mass) were firstly mixed with paraffin and pressed into a toroidal shape (Φout:7.00 mm,Φin:3.04 mm).Then,an Agilent PNA N5224A vector network analyzer was introduced to test the relative complex permittivities (ε′,ε′′) and relative complex permeabilities (μ′,μ′′) of the mixture in a frequency range of 2–18 GHz using the coaxial-line method according to ASTM 893-1997,American Society Testing and Materials.Finally,the EMW absorbing performance of the specimens are evaluated by means of reflection loss (RL) values which are calculated according to the following Eqs.(1) and (2):

where Z0and Zinis the characteristic impedance of free space and the input impedance of the absorber respectively,εr(ε′-jε′′) is the relative complex permittivity,μr(μ′-jμ′′) is the relative complex permeability,f,d and c is the microwave frequency,the specimen thickness and the light velocity respectively.
3.Results and Discussion
3.1.Characterization of LCs
Before using high-resolution AFM to analyze the morphology of LCs,we first performed AFM imaging on pure lignin and pure cellulose,as shown in Fig.1(a)–(d).As predicted,lignin is observed to be in the form of particles (Fig.1(a)),while cellulose exists in the form of fibers (Fig.1(c)).In addition,dark signal points can be observed in AFM phase image for lignin molecules which are at the same position corresponding to the bright dots in AFM topography image(circled by yellow solid lines in Fig.1(a)and(b)).This is one of the characteristics of lignin under AFM[28].In contrast,in AFM phase image of cellulose(Fig.1(d)),the signal is brighter.The difference of the phase signals is mainly due to the difference of the interaction force between the substrate and the AFM probe.Therefore,the AFM morphology and phase imaging results of LC in Fig.1(e)–(h) is understandable.Specifically,classic nanofiber structures are observed in Fig.1(e) and(f).Different from cellulose,there are granular clusters on the surface of nanofibers.The enlarged AFM image of the area squared by solid yellow rectangle in Fig.1(f) is shown in Fig.1(h)along with the corresponding cross-section profile and phase image.The highlighted dots in topography image correspond to the observed peaks in the height curve and the dark contrast dots in AFM phase image one by one,indicating that on the surface of LCs,self-polymerizing lignin molecules are firmly modified on the surface of cellulose fibers by chemical bond interactions after hydrolysis treatments.

Fig.1.Characterization of LCs.AFM morphologic and phasic image for(a,b)lignin and(c,d)cellulose.(e,f)AFM morphologic image for LCs.(g)AFM phasic image for LCs.(h)High-resolution AFM images along with the corresponding cross-section profile following the red dashed line in AFM morphologic image.
XPS is introduced to further confirm the chemical components in resultant LCs.From the survey XPS spectra in Fig.S1(a)(in Supplementary Material) we may see that,all the samples contain C and O elements which are both main atoms of lignin and cellulose.Fig.S1(b)and(c)are the high-resolution XPS spectra of C 1s and O 1s,respectively.As shown in Fig.S1(b),the C 1s spectra for cellulose,lignin and LCs can be deconvoluted into three peaks at 284.8 eV,286.5 eV and 287.8 eV,corresponding to the C=O in lignin,the C-C and C-H in cellulose,and the C-O in phenols and ethers from lignin and cellulose,respectively [29].The percentage distribution of C=O in lignin,LCs and cellulose is 16.1%,12.0%and 7.4%.This decreasing trend was consistent with the decrease of lignin content in the samples.As shown in Fig.S1(c),the O 1s spectra for all the samples can be deconvoluted into three peaks at 532.0 eV,532.9 eV and 533.9 eV,representing the C=O in lignin,the C-O in holocellulose and the phenolic oxygen in lignin.It is obvious that from lignin to LC and to cellulose,the percentage distribution of C-O increases from 76.5%to 93.6%,while the total percentage distribution of C=O and phenolic oxygen decreases from 23.5% to 6.4%.
3.2.Morphological and componental characterization of CH-10
Fig.2(a)–(g)display the SEM images of C-lignin,C-cellulose and C-LCs with different magnifications.Different morphologies were observed after high-temperature pyrolysis.C-lignin exhibits block structure with smooth surface in Fig.2(a) and (b).According to previous report,these blocks are accumulation of well-ordered carbon with a graphite-like characteristic structure [30].However,disordered fibers were observed for C-cellulose in Fig.2(c) and(d).These fibers are interwoven and inlaid on the sheet.It can be understood that these sheets should be a kind of aggregation state of these fibers.At high temperature,the fibers form a piece through the C-C covalent bonds between the carbon atoms on their edges[31,32].Such certain correlation between the carbon precursor chemistry and the final morphology of carbonized material is also shown for CH-10.As shown in Fig.2(e),CH-10 is mainly represented by flake fragments in submicroscopic.At higher magnification in Fig.2(f) and (g) we may see fibrous flocs containing inside these fragments.The morphology of these fibers was similar to that observed in C-cellulose.As inserted in Fig.2(g),we can find that these fibers and sheets are not independent of each other,and contact surfaces among them are observed.At high temperature,the lignin and cellulose in LCs thermal-phase-transited into a complex which is illustrated in Fig.2(h).As displayed,CH-10 exhibits a rippled shape with curvatures.As we know,one-layer graphite sheet structure is composed of a hexagonal lattice of carbon atoms.The observed curvatures are attributed to the topological defects which are dominated by energetically favorable adjacent 5-and 7-atom carbon rings,forming dislocation cores in graphite-like carbon sheets [33].

Fig.2.Characterization of carbonized samples.SEM images for(a and b)C-lignin,(c and d)C-cellulose and(e)–(g)CH-10.(h)Schematic diagram of CH-10.(i)XRD patterns for carbonized samples.(j),(k) XPS patterns for carbonized samples.(l) Raman spectra for carbonized samples.
Fig.2(i) shows the XRD curves for carbonized samples.As predicted,two peaks are observed at 2θ=25.4° and 43.2°,representing the(0 0 2)and(1 0 1)plane of graphite carbon,respectively.It is worth noting that a diffraction peak at 2θ=~10.0° is observed for all the samples,and the corresponding intensity gradually decreases with the increase of cellulose proportion in carbon precursors.This peak represents the (1 1 1) plane of fullerenerelated cage-like structures,which is mainly caused by nonhexagonal defects in corrugated graphite sheets [34].Such decreasing peak intensity indicates that with the increase of cellulose content,the fluctuation of graphite-like carbon sheets caused by defects decreases gradually.From the survey XPS curves in Fig.2(j) we may see that the C/O ratios of the carbonized samples increase dramatically after pyrolysis.Accordingly,the highresolution C 1s XPS results in Fig.2(k)show that with the increase of cellulose content in the precursor,the C=O intensity increase from 8.5% to 14.0%,indicating the decrease of the defects.This is further proved by the Raman spectra in Fig.2(l).As shown in Fig.2(l),from C-lignin to CH-10 and to C-cellulose,the ID/IGvalue decreased from 1.46 to 1.28 and then to 1.05.As we know,the D-band at~1340 cm-1refers to the sp3atomic vibration of disordered graphite,and the G-band at~1590 cm-1refers to the sp2atomic in-plane vibration in a 2D hexagonal lattice.Thus,the intensity ratio(ID/IG)of corresponding peaks are important parameters to characterize the phase structure of carbon materials.The decreasing ID/IGvalue indicates the decrease of defects.This seemingly inconsistent situation further indicates that the accumulation of graphite flakes formed by carbonization of large number of lignin is more likely to produce defects.As the lignin content in the carbon source is reduced,the defects decrease.In other words,the defect density of the nanofibers formed by C-cellulose is lower.

Fig.3.Crystallization characterization of CH-10.(a)–(e) HR-TEM images of nanofibers in CH-10,along with corresponding SEAD pattern in (f).(g)–(h) HR-TEM images of nanosheets in CH-10,along with corresponding SEAD pattern in (i).(j) The theoretical model of graphene.
The carbon crystalline state of CH-10 was further studied by HR-TEM.Fig.3(a) shows the HR-TEM image of the selected fiber structure from CH-10 in large scales.Highly magnified HR-TEM images for the areas at the edge of the fiber are shown in Fig.3(b) and (c).Aromatic clusters with apparent orderly and continuous 6-carbon atomic rings as well as crystalline strips are found in Fig.3(c).In the HR-TEM images obtained by FEI Tecnai G2 F20 S-TWIN,the measured stripe distance is 0.2406 nm which is close to the theoretical distance of graphite in Fig.3(j).HR-TEM images of the middle part of nanofibers are shown in Fig.3(d) and (e).The observed aligned white dots in Fig.3(e)indicate that nanofiber is not single-layer graphite,and the adjacent benzene ring distance is 0.2671 nm,which is also close to the theoretical distance for the(0 0 2) crystal plane of graphene in Fig.3(j) [35].These results prove that the stripes and benzene rings of CH-10 belong to aromatic clusters.The electron diffraction pattern in Fig.3(f) further indicates that the nanofibers consist of hexagonal patterns of carbon atoms,which agrees with graphene.Fig.3(g) shows the TEM image of the selected sheet structure from CH-10 in large scales and Fig.3(h)is the HR-TEM image at the corresponding edge area.The electron diffraction pattern in Fig.3(i) indicates that the nanosheet consist of non-hexagonal pattern of carbon atoms[36].It is obvious in Fig.3(g)that visible(0 0 2)nanofringes which originate from the edges of curled graphite sheets perpendicular to the image plane,represent an edge-on view of stacked defective graphite-like layers.This suggests the random arrangement of these graphite-like carbon sheets in a turbostratic state [37].In addition,one can see that the nanosheets in CH-10 are characterized by numerous randomly curved atom-thick carbon layers.The HR-TEM images from nanosheets show few parallel lines in the stacks in Fig.3(g),further indicating the existence of a large number of domains composed of multiple carbon heterocycles.To sum up,the nanofibers in CH-10 have a higher degree of crystallinity than the nano sheets,implying higher graphitization degree which should attribute to better dielectric value.
3.3.Formation mechanism for CH-10
The composition and morphology of carbon materials are closely related to the materials before carbonization.Here,the precursor of CH-10 is lignocellulose,a complex of lignin and cellulose.Therefore,to explore the formation mechanism of CH-10,the understanding of the role of lignin and cellulose macromolecules in the carbonization process should be considered.As we know,lignin possesses branched and cross-linked structure,exhibiting structural and chemical variability.The three basic units,coumaryl alcohol,coniferyl alcohol and sinapyl alcohol contribute a large amount of aromatic ring structures,being beneficial for the formation of close packed graphene/graphite-stacked structures at high temperature [38].This is confirmed by the SEM images in Fig.2(a)and(b).Comparatively,cellulose possesses high crystallinity which consists repeating glucose units.Several possible interactions should happen during carbonization,including intermolecular dehydration through -H and -OH condensation,thermal cleavage of glycosidic linkage,and thermal scission of ether bonds and C-C bonds.As a result,O-containing groups are eliminated [39].At high temperature,the decomposition intermediates polymerize,resulting in the formation of graphene/graphite units as proved in Fig.2(c)and(d).Obviously,these stacking units can be ordered in long-range.Thus now,the formation of CH-10 is clear.In the process of high-temperature pyrolysis,the aromatic ring structure of lignin converts into a large range of accumulated graphite structure,while the pyrolysis products of cellulose repolymerize into a fiber structure with high crystallinity.Due to the chemical combination of lignin and cellulose,the pyrolysis product should be also a composite consisting of fiber structure and graphite lamellar structure with visible interfaces between them as proved in Fig.2(g).Inevitably,multiple carbon heterocycles and defects are produced due to stacking and interfacial interactions.The formation mechanism of CH-10 is diagrammed in Fig.4.
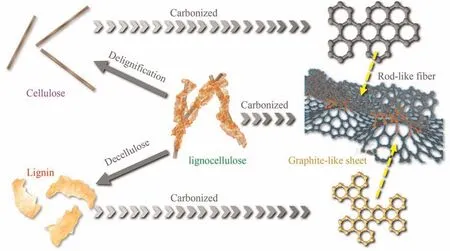
Fig.4.Diagrammatic sketch for CH-10 formation.
3.4.Electromagnetic characterization of CH-10
The permittivity parameters(ε′and ε′′)of the samples are tested under alternating EM field.ε′represents the electronic storage capacity while ε′′represents the electronic loss capacity of the sample.In general,higher graphitization level indicates stronger local conductivity and larger permittivity.Meanwhile,higher local defect density implies higher resistance.The induced current generated in the alternating EM field is easy to be converted into heat dissipation by eddy current loss effect [40].Fig.5(a) shows the ε′and ε′′values for C-lignin,and the ε′and ε′′values for CH-10 and C-cellulose are inserted in Fig.5(b) and(c),respectively.It is obvious that ε′and ε′′values of C-lignin vary from 3.8 to 4.1 and from 0.1 to 0.5,while the ε′and ε′′values of C-cellulose are much higher,varying from 12.5 to 29.4 and from 7.5 to 20.2.As discussed above,CH-10 can be treated as a complex of carbonized lignin and cellulose.Thus,its intermediate permittivity parameters are understandable.In order to further show the different dielectric properties of lignocellulose after carbonization compared with Ccellulose and C-lignin,the ε′and ε′′ratios of the C-cellulose and CH-10 to C-lignin are shown in Fig.5(d) and (e).From C-lignin to CH-10 and to C-cellulose,the lignin component in the precursor is gradually replaced by cellulose,that is,the glucose chain structure gradually replaces the multiple aromatic ring structure,which improves the crystallinity and conductivity of carbonized samples.From Fig.5(d)and(e)we may see that,the dielectric properties of the samples increase with the cellulose content in the precursor.

Fig.5.Conductivity characterization of the samples.(a)Permittivity parameters of C-lignin.(b and c)ε′/ε′0 and ε′′/ε′′0 ratios for C-lignin,CH-10 and C-cellulose,respectively.Insert:their corresponding exact parameters.(d)–(f) Cole-Cole plots for C-lignin,CH-10 and C-cellulose,along with their corresponding schematic diagram for dipolar polarization (g)–(i).
As we know,multiple polarization relaxation processes including interfacial polarization [41] and dipole polarization [42] may happen inside heterojunction structures.Due to the presence of abundant defects and multiple carbon heterocycles,electron scattering and electron accumulation are easy to occur during the transport of induced electrons in the samples,and several resonant peaks are observed on the real and imaginary part of the permittivity inserted in Fig.5(b)and(c).According to Debye relaxation theory [43],complex permittivity can be expressed as below:

where εsand ε∞are the static permittivity and relative permittivity in the higher frequency region,τ is polarization-relaxation time,respectively.According to Eq.(3),the real and imaginary parts are as below:

Thus,the mathematical connection between ε′and ε′′could be inferred as below:


Fig.6.EM dissipation performance of carbonized samples.3D (a)–(c) and 2D (d)–(f) colored images for EM absorption performances of C-lignin,C-cellulose and CH-10,respectively.(g and h) The curves of fE for C-cellulose and CH-10 with thickness below 2.0 mm.
Basically,each ε′vs ε′′plot semicircle which we call Cole-Cole semicircle,corresponds to a Debye relaxation.Fig.5(d–f) displays the plots ε′-ε′′for C-lignin,C-cellulose and CH-10,respectively.It is obvious in Fig.5(d)and(e),both C-lignin and C-cellulose possess two Cole-Cole semicircles.After cellulose was doped into lignin,the carbonized products show more Cole-Cole semicircles.It is clear from the schematic diagram in Fig.5(g) that the dipolar polarization is attributed to the defects and electronic density between different carbon atomic rings,which come from the lower crystallinity of C-lignin.Differently in Fig.5(h),the dipolar polarization in C-cellulose comes from the interface formed by the combination of two different graphite-like sheets.In each graphite region,the sheet consists of regular 6-carbon atomic rings,but on the interface,due to the stacking effect between two graphite layers,some defects and heterocycles are formed.For CH-10,there are many compound regions of the above three phases (Fig.5(i)),which leads to stronger dipolar polarization and more exhibited Cole-Cole semicircles.
3.5.EM dissipation applications
With the emergence of more and more advanced electronic equipment,people’s living efficiency has been greatly improved,but the problems of EM interference and EM pollution are becoming more serious[44,45].The effective way to solve this problem is to develop electromagnetic wave absorbers with light weight,thin thickness(Tm),high absorption capacity and wide effective absorption frequency band (fE) [46–49].Considering the characteristics such as light weight and physical and chemical stability,carbonbased EM absorber may be ideal candidates [50–52].The EM absorption performances for C-lignin,C-cellulose and CH-10 with the frequency of the applied alternating EM field from 2.0 GHz to 18.0 GHz and the coating thickness from 1.0 mm to 5.0 mm are displayed as 3-D colored maps in Fig.6(a)–(c),respectively.It is obvious that C-lignin no effective absorption performance with all the RL values are larger than -10 dB.As we know,RL ≤-10 means more than 90% dissipation of incident EM energies.For Ccellulose,the EM absorption capacity is improved.At some frequency bands,effective absorption can be achieved by adjusting the coating thickness of the samples,but the corresponding |RL| value is still low.However,the EM absorption capacity of CH-10 is dramatically enhanced.
The detailed EM absorption performances are shown in the 2D colored images in Fig.6(d)–(f).It can be seen that the minimum RL(RLmin)value for C-lignin is only-4.88 dB.Such low EM absorption capacity is mainly due to its weak current loss capacity which is dependent on its corresponding permittivity parameters.However,the RLminof C-cellulose is only -14.39 dB which is still too low.This is opposite to its high permittivity parameter.Such phenomenon is mainly due to the fact that the conductivity of graphite-like C-cellulose with high crystallinity is too strong.As a result,a lot of eddy current produces when the EM waves incident on the interface between the absorber and the air,resulting in impediment of further transmission of EM waves in the absorber[53].Thus,a large amount of EM energies are reflected into the air without being absorbed,which is normally called skin effect[54].On the contrary,both the real part and the imaginary part of the permittivity of CH-10 are between C-lignin and C-cellulose as shown in Fig.5(a)–(c),which makes CH-10 obtain appropriate impedance matching.Therefore,the RLminof CH-10 can be as low as -50.05 dB with a coating thickness as thin as 1.3 mm.Meanwhile,CH-10 can effectively absorb all the EM energies at the frequency covering as broad as 11.04 GHz from 6.96 GHz to 18.00 GHz by just adjusting the coating thickness.
As shown in Fig.6(d)–(f),with an increase in the thickness,the absorption peak shifts to a lower frequency region,which can be described using the following 1/4 wavelength cancelation law:

where tmand fmare the matching thickness and matching frequency for the strongest absorption peak,respectively.Eq.(3)indicates that tmand fmare inversely proportional to each other.We note here that when tmand fmsatisfy this equation,the reflected EM waves both from the air-absorber surface and the absorberconductive background interface are out of phase by 180°,resulting in extinction at the air-absorber interface and a corresponding minimum RL value.
As mentioned above,one of the essential elements of an ideal EM absorber is thin matching thickness.Thus,the EM absorption performance of the three carbon-based absorbers under the coating thickness of less than 2 mm is studied in Fig.6(g) and (h).To be mentioned,there is no effective absorption of C-lignin.It can be seen that although C-cellulose has effective absorption at a matching thickness as low as 1.1 mm,its broadest absorption bandwidth can only reach 3.52 GHz at a fixed coating thickness,while CH-10 has effective absorption as low as 1.2 mm,and the broadest absorption bandwidth is larger than C-cellulose,reaching 4.16 GHz at 1.3 mm.This indicates that CH-10 is an excellent candidate for EM absorption in terms of weight,bandwidth,maximum absorption capacity and matching thickness.To sum up,such excellent EM absorption performance of CH-10 is attributed to the combined effect of moderate conductivity of carbon fiber with high conductivity and graphite-like sheet with low conductivity,the interfacial polarization effect between these two structures,and the dipolar polarization effect caused by the formed defects and multiple carbon heterocycles as illustrated in Fig.7[55].Overall,carbon heterostructure is fabricated by pyrolysis of bambooderived lignocellulose,which consists of nanosheet and nanofiber structures,with enhanced polarization and moderate impedance matching in one material.As a result,CH-10 is an ideal EMW absorber with broad effective bandwidth and thin thickness.
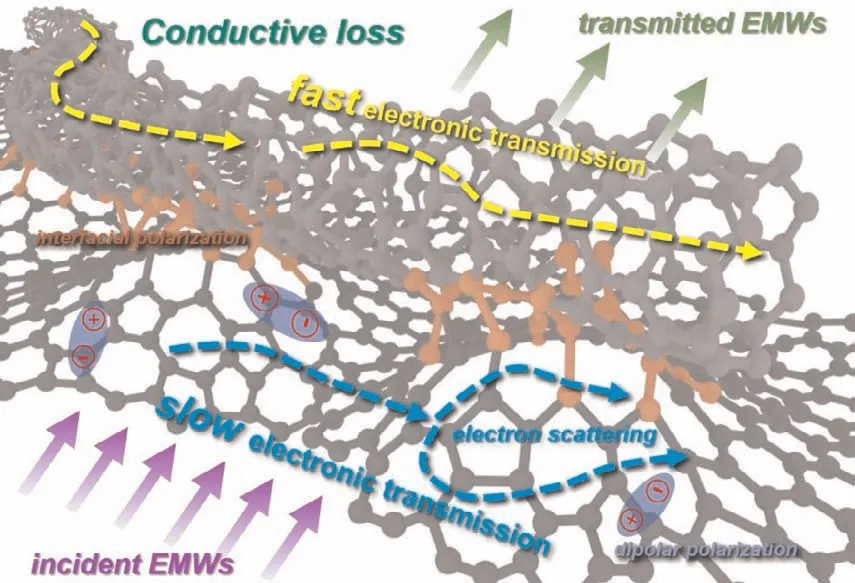
Fig.7.Schematic diagram of electromagnetic wave absorption mechanism.
4.Conclusions
Here,carbon heterostructure with fibers and sheets(CH-10)are obtained by pyrolysis of bamboo-derived lignocellulose nanofibers(LCs)which is prepared using p-toluenesulfonic acid hydrolysis followed by homogenization process at a controlled condition.The nanofiber structures in CH-10 are proved to come from carbonization of the cellulose content in LCs while the nano-sheet structures come from carbonization of the lignin content.Besides,further investigation indicates that the former possesses high crystallinity and low defect density,implying its good conductive properties.Comparatively,lignin-derived nanosheets are graphite-like,which are rich in defects and multiple carbon heterocycles,indicating its poor conductive properties.These are proved by the corresponding permittivity parameters of carbonization products of pure lignin(C-lignin) and pure cellulose (C-cellulose).Being attributed to the resulted moderate conductivity of fibril carbon and graphite-like carbon sheet,the interfacial polarization effect between these two structures,and the dipolar polarization effect,CH-10 exhibits excellent electromagnetic wave absorption capacity with RLminas low as -50.05 dB,a matching thickness as thin as 1.3 mm and an effective absorption bandwidth as broad as 11.04 GHz by just adjusting the coating thickness.More importantly,CH-10 possesses a broadest absorption bandwidth of 4.16 GHz at a fixed coating thickness under 2.0 mm which is only 1.3 mm.
Declaration of Competing Interest
The authors declare that they have no known competing financial interests or personal relationships that could have appeared to influence the work reported in this paper.
Acknowledgements
This manuscript is supported by funding from the National Natural Science Foundation of China (31770609,31570552),Jiangsu Agricultural Science and Technology Independent Innovation Fund(CX(20)3041).
Supplementary Material
Supplementary data to this article can be found online at https://doi.org/10.1016/j.cjche.2021.12.031.
杂志排行
Chinese Journal of Chemical Engineering的其它文章
- Green hydrogen:A promising way to the carbon-free society
- Electrochemical CO2 mineralization for red mud treatment driven by hydrogen-cycled membrane electrolysis
- Fabrication of azobenzene-functionalized porous polymers for selective CO2 capture
- Significantly enhanced charge transfer efficiency and surface reaction on NiP2/g-C3N4 heterojunction for photocatalytic hydrogen evolution
- CO2 capture by double metal modified CaO-based sorbents from pyrolysis gases
- Methane hydrate crystal growth on shell substrate