Structural reconstruction of Sn-based metal–organic frameworks for efficient electrochemical CO2 reduction to formate
2022-04-27YachenDengShifuWangYanqiangHuangXuningLi
Yachen Deng,Shifu Wang,Yanqiang Huang,Xuning Li
State Key Laboratory of Catalysis,Dalian Institute of Chemical Physics,Chinese Academy of Sciences,Dalian 116023,China
Keywords:Structural reconstruction Metal-organic frameworks Mössbauer spectroscopy Electrochemical CO2 reduction
ABSTRACT MOF-based materials have been widely explored in electrochemical CO2 reduction reactions for the production of valuable chemicals.Understanding the reconstruction of those catalysts under working conditions is crucial for the identification of active sites and clarification of reaction mechanism.Herein,a series of six N coordinated Sn-based metal-organic frameworks (Sn-N6-MOFs) are newly developed for electrochemical CO2 reduction(CO2RR).2%Sn-N6-MOF achieves the optimal catalytic performance with a formate Faradaic efficiency of~85% and a current density of 23 mA.cm-2 at -1.23 V vs.RHE.In-situ Raman results combined with ex-situ 119Sn Mössbauer measurements reveal the structural reconstruction of Sn-N6-MOFs during CO2RR,generating tin nanoclusters as the real active sites for CO2 electroreduction to HCOOH.
1.Introduction
Electroreduction of carbon dioxide (CO2RR) into value-added chemical products offers a compelling pathway not only to meet the increasing energy demand,but also to alleviate the environmental crisis caused by CO2emissions [1–5].However,electrocatalytic reduction of chemically inert CO2is a thermodynamic and kinetic challenge [6–8].The development of efficient electrocatalysts with high activity,selective,and stability for boosting CO2conversion is highly desired [9–12].
Metal-organic frameworks (MOFs) [13] have been extensively explored as electrocatalysts for CO2reduction due to their customizable porosity structure,large surface areas,controlled porosity,simple access to active sites,etc.[14–17].However,the structure of the MOFs usually suffers from restructuring under the practical electrocatalysis process,which results in the in-situ construction of new phases as the real catalytic sites [18,19].Such structural reconstruction of the catalysts usually changes the structure of active sites,resulting in either reduction or improvement of the catalytic performance [20,21].The in-depth understanding of the rebuilding behavior of MOFs as electrocatalysts under working conditions is essential for fine-tuning reaction processes and creating the desired catalysts for CO2RR [22].
Recently,Wu et al.[17] found that atomically thin bismuthene with a thickness of 1.28–1.45 nm can be in-situ synthesized from ultrathin Bi-MOF films.The resulting bismuthene nanosheets were demonstrated with high CO2RR activity and selectivity for formate production with nearly 100%faradaic efficiency over a wide potential range,as well as a high formate current density and long-term stability in an H-type electrochemical cell.In addition,Qiao et al.[23] revealed the reconstruction of Bi-MOFs under CO2RR conditions,generating a highly active,selective,and stable Bi catalyst for CO2RR.Despite these studies,few reports have examined the evolution of Sn-based MOFs as CO2RR electrocatalysts[24],and little information is available concerning the real catalytic sites of Snbased MOFs for the CO2electroreduction.
Herein,a series of six N coordinated Sn-based metal-organic frameworks (Sn-N6-MOFs) were newly synthesized via a solventassisted linker exchange(SALE)strategy.In electrochemical reduction reaction,the as-synthesis 2% Sn-N6-MOF shows high electrocatalytic activity for electrochemical CO2reduction to HCOO-with a Faradaic efficiency of~85% at -1.23 V vs.RHE.In-situ Raman results indicate that the catalysts undergo a structural restructuring under the reaction condition.Ex-situ transmission electron microscopy(TEM)and room temperature119Sn Mössbauer spectra further evidence the generation of tin nanoclusters as the new active sites for the efficient electroreduction of CO2to HCOOH.
2.Experimental
2.1.Chemicals
1H-1,2,3-triazole (97% (mass)),2-methylimidazole (98%(mass)),zinc nitrate hexahydrate (98% (mass)),Potassium bicarbonate (99.7% (mass)),Nafion 117 solution (~5% (mass)),were purchased from Sigma-Aldrich.Methanol and Tin chloride dihydrate (99.99% (mass)) were purchased from Aladdin (China).All chemicals were used without any further purification.Carbon paper was obtained from Fuel Cell Store.
2.2.Catalyst preparation
The catalyst was prepared according to the method of Li et al.[25].Typically,the catalyst with six N-coordinated Sn (Sn-N6-MOF) was generated by doping Sn into N6-MOF through a modified solvent-assisted linker exchange (SALE) technique.Methanol solution A(30 ml),separately containing various amounts of SnCl2-.2H2O (9 mg,18 mg,45 mg) and Zn(NO3)2.6H2O was added to Methanol solution B (30 ml),containing 1.314 g 2-methylimidazole under stirring at 40°C for 240 min.Subsequently,the precipitates (Sn-ZIF) were centrifuged and washed at least 3 times with methanol and then dried in an electric oven for 24 h at 60°C.Finally,1%,2%,and 5%Sn-N6-MOF were obtained by adding 1H-1,2,3-triazole (0.15 ml) into Sn-ZIF (100 mg) suspended methanol and further stirred for 72 h,respectively.The precipitates were centrifuged and washed with methanol at least 3 times and dried for another 24 h at 60 °C in an electric oven.N6-MOF was obtained via the same process except without adding SnCl2.2H2O.
2.3.Electrochemical measurements
The electrochemical measurements were performed on a threeelectrode system.Faradaic efficiency analysis was performed on electrochemical workstation in an H-cell separated by Nafion membrane.The saturated calomel electrode (SCE) and Pt plate were used as the reference and counter electrode,respectively.1 mg catalyst and 40 μl Nafion solution(5%(mass))were dispersed in 960 ml of water-isopropyl alcohol solution with a volume ratio of 1:1 to form the catalyst ink.The working electrode was prepared by brushing 0.5 ml of catalyst ink onto carbon paper(1 cm×1 cm)with a mass loading of 0.5 mg.cm-2.During the CO2reduction experiments,CO2gas (with 1% Ar as internal standard gas) was continuously bubbled into the electrolyte at a rate of 20 ml.min-1.The gas products were analyzed at each fixed potential during the electrolysis time of 1 h by gas chromatography(Agilent 7890B)and the liquid product was characterized by hydrogen nuclear magnetic resonance (1H NMR) after the entire electrochemical measurement on Bruker Avance III 400 MHz nuclear magnetic resonance spectrometer (Germany) with dimethyl sulfoxide(DMSO) as the internal standard.
Cyclic voltammetry (CV) and linear sweep voltammetry (LSV)curves were recorded on a CHI660E electrochemical workstation in CO2-saturated 0.5 M KHCO3(pH=7.3) and Ar-saturated 0.5 mol.L-1KHCO3(pH=8.4) at a scan rate of 10 mV.s-1from-0.6 to-1.6 V vs.SCE.Electrochemically active surface area(ECSA)was derived by measuring the electrochemical double-layer capacitance from the scan-rate dependence of CVs in a potential range of-0.1 to 0.1 V vs.SCE.All potentials in this study were converted to the reversible hydrogen electrode (RHE) scale by the following equation:


Fig.1.Electrocatalyst design and structural characterizations.(a)Diagram of the synthetic procedures for Sn-based MOFs.(b)XRD patterns of 2%Sn-ZIF and 2%Sn-N6-MOF.(c) Sn 3d5/2 XPS spectra of 2% Sn-N6-MOF.
2.4.Characterization
The morphology of the catalysts was characterized by field emission scanning electron microscopy (FE-SEM,JSM-7800F,JEOL,Japan) at an accelerating voltage of 3.0 kV.High-angle annular dark-field scanning transmission electron microscopy (HAADFSTEM) and the corresponding energy-dispersive X-ray spectroscopy (EDX) mapping images were recorded on a JEOL JEMARM200F STEM/TEM(Japan).X-ray diffraction(XRD)was acquired by aPAN Analytical X’pert Pro diffractometer with Cu Kα radiation(λ=0.15432 nm) at 40 kV and 40 mA.Raman spectra were collected on a Renishaw inVia microprobe Raman spectrometer (UK)with a 785 nm excitation laser at a power of 2.5 mW.X-ray photoelectron spectroscopy(XPS)measurements were performed on the Thermo Scientific ESCALAB 250Xi spectrometer (USA) using an Al Kα X-ray source with a pass energy of 200.0 eV.The binding energies were calibrated to the C 1 s peak at 284.6 eV.The elemental compositions were analyzed by inductively coupled plasma atomic emission spectroscopy (ICP-OES).The119Sn Mössbauer measurements were recorded with a Topologic 500A spectrometer and a proportional counter using Ca119mSnO3(with an activity of 10 mCi) as a γ-ray radioactive source.
3.Results and Discussion
3.1.Synthesis and characterization of Sn-N6-MOF catalysts
The Sn-based MOFs were prepared via a modified solventassisted linker exchange (SALE) process,including the doping of Sn metal nodes into ZIF-8 to replace the Zn metal nodes,followed by a SALE process (Fig.1(a)).After washing and drying,the Snbased MOFs(x%Sn-N6-MOF;x=1,2,and 5)with different Sn doping contents of 0.47,1.37,6.12%(mass)were obtained(analyzed by ICP-OES),which were correspondingly denoted as 1% Sn-N6-MOF,2% Sn-N6-MOF,5% Sn-N6-MOF,respectively.Fig.1(b) and Fig.S1(Supplementary Material) display the XRD patterns of Sn-ZIF and Sn-N6-MOF (x=1,2,and 5) in the 2θ range of 6°–50°.As shown in Fig.S1,the diffraction peaks of XRD patterns for the assynthesized Sn-based MOFs match well with those of the simulated ZIF-8 and ZIF with six N coordinated to the metal centers(N6-MOF)[26],indicating the successful synthesis of six N coordinated Sn-based metal–organic frameworks (Sn-N6-MOFs) [27].Raman spectra were used to further study the structural information of the obtained catalysts.As shown in Fig.S2,Sn-N6-MOF catalysts exhibit the characteristic Raman peaks of C-N (1000–1400 cm-1)and C=C,C=N(1400–1600 cm-1),well consistent with N6-MOF,suggesting the insertion of Sn atom as nodes in the framework [24,25].The valence state information of Sn in 2% Sn-N6-MOF catalyst was studied by XPS.As shown in Fig.1(c),the Sn 3d5/2XPS spectra of 2% Sn-N6-MOF suggests that mainly Sn(IV) is contained in the framework.

Fig.2.(a)SEM and (b) TEM characterization of 2% Sn-N6-MOF.(c) TEM image of 2% Sn-N6-MOF and (d) the corresponding EDX mappings of Sn on 2% Sn-N6-MOF.
As displayed in the SEM images(Fig.S3),the as-prepared Sn-ZIF catalysts possessed rhombic dodecahedron morphology,which is similar to ZIF-8 (Fig.S4a),implying the well-preserved morphologies after Sn doping.Detailed morphology information was obtained from the TEM images (Fig.S5),which clearly show that the rhombic dodecahedron assembled from nanoparticles(Fig.S4b),with a diameter of 100–150 nm.As a comparison,2%Sn-N6-MOF was also composed of octahedral particles like N6-MOF (Fig.2(a)-(b)).The corresponding elemental mapping of C,N,Zn and,Sn indicates the highly dispersion of Sn atoms in the framework(Fig.2(c)-(d)).As shown in Fig.S3,the average sizes of the ZIF precursors decrease with increasing the Sn doping content.A similar phenomenon is observed in the obtained Sn-N6-MOF catalysts.SEM images and the corresponding size distributions of x%Sn-N6-MOF (x=1,2,5) are shown in Fig.S6.Further Sn doping reduces the average sizes to 35 nm in 1% Sn-N6-MOF,30 nm in 2% Sn-N6-MOF,and 19 nm in 5% Sn-N6-MOF,respectively.All these results suggesting the successful synthesis of the novel Sn-based MOFs with high dispersed six N coordinated Sn4+species in the framework,which could be applied as potential catalysts for CO2RR.
3.2.Electrocatalytic CO2RR performances of the Sn-N6-MOF
The CO2RR performance was evaluated in a homemade H-type cell filled with a CO2-saturated 0.5 mol.L-1KHCO3electrolyte(pH=7.3).The products were analyzed by gas chromatography(GC) and1H NMR,showing the presence of CO and H2in the gas phase and formate acid in the liquid phase.Fig.3(a) shows LSVs of the 2% Sn-N6-MOF and N6-MOF in CO2-and Ar-saturated 0.5 mol.L-1KHCO3electrolyte.All samples exhibited higher current densities in the CO2-saturated electrolyte,showing obvious CO2RR catalytic performance.Compared to N6-MOF,x% Sn-N6-MOF(x=1,2,and 5)displays a much higher partial current density of HCOO-(Fig.3(b)),suggesting the promoted electrochemical activities by Sn doping.As shown in Fig.3(c) and Fig.S7,N6-MOF shows more than 60%FE towards H2formation over a potential window from-0.93 to-1.43 V vs.RHE and no formate product is detected,suggesting the important role of Sn center for promoting the CO2RR to formate.CO and H2are detected as main products over N6-MOF in the whole potential range.The H2FE at-1.23 V vs.RHE is as high as 77%,which implies that low active Zn center for CO2RR,resulting in predominant H2from HER.The introduction of Sn into Sn-N6-MOF significantly increases the selectivity of CO2RR to formate.Compared to N6-MOF,Sn-N6-MOF shows entirely different electrocatalytic CO2RR performance,with the highest HCOO-production with both high HCOO-FE and current density at -1.23 V vs.RHE (Fig.3(c)).For instance,1% Sn-N6-MOF shows entirely different performance(HCOO-FE=47%,Jtotal=17.2 mA.c m-2) compared to N6-MOF with greatly inhibited HER (H2FE=10%).This could be attributed to a lower energy barrier in generating*OCHO intermediate from CO2-induced by Sn nodes,which further facilitates the formation of HCOO-.As increasing Sn contents,HCOO-FEs of Sn-N6-MOF gradually increase,and reach the maximum of 85% over 2% Sn-N6-MOF and 5% Sn-N6-MOF at-1.23 V vs.RHE (Fig.S8).Among those Sn-based MOFs,2% Sn-N6-MOF exhibits the optimal performance in terms of the FE of formate(>70%)in a wide potential range from-1.13 V to-1.43 V vs.RHE.The highest HCOO-FE of 85.1% is achieved at -1.23 V vs.RHE,with a partial current density of 23 mA.cm-2(Fig.S9).The comparison of the Sn contents,ECSAs,and the total current densities at -1.23 V of x%Sn-N6-MOF (x=1,2,and 5) indicate that the optimal catalytic activity has been reached when the tin content is 2%.Moreover,2% Sn-N6-MOF catalyst exhibits a stable current density of approximately 21 mA.cm-2at a constant applied potential of -1.23 V vs.RHE over 6 h,with a steady formate selectivity well maintained above 80% throughout the whole electrocatalytic process (Fig.3(d)).The increase of the current density in the first hour indicates that the catalyst probably undergo a dynamic reconstruction process during the reaction..
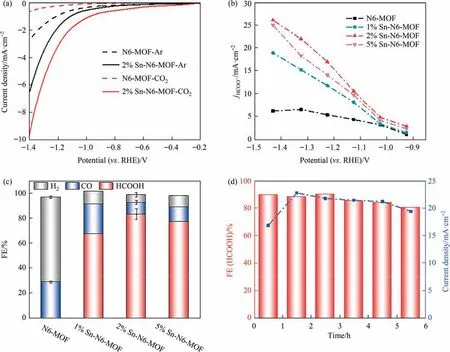
Fig.3.Electrochemical CO2 reduction performance of 2% Sn-N6-MOF and N6-MOF.(a) LSV curves of the 2% Sn-N6-MOF and N6-MOF in Ar-and CO2-saturated 0.5 mol.L-1 KHCO3.(b)Partial current density of formate(JH-COO)over x%Sn-N6-MOF(x=0,1,2,5).(c)FEs of CO,H2 and formate over x%Sn-N6-MOF(x=0,1,2,5)catalysts at-1.23 V vs.RHE.(Red:HCOO-;blue:CO;grey:H2) (d)Stability test of 2% Sn-N6-MOF at -1.23 V vs.RHE in 0.5 mol.L-1 KHCO3 solution.
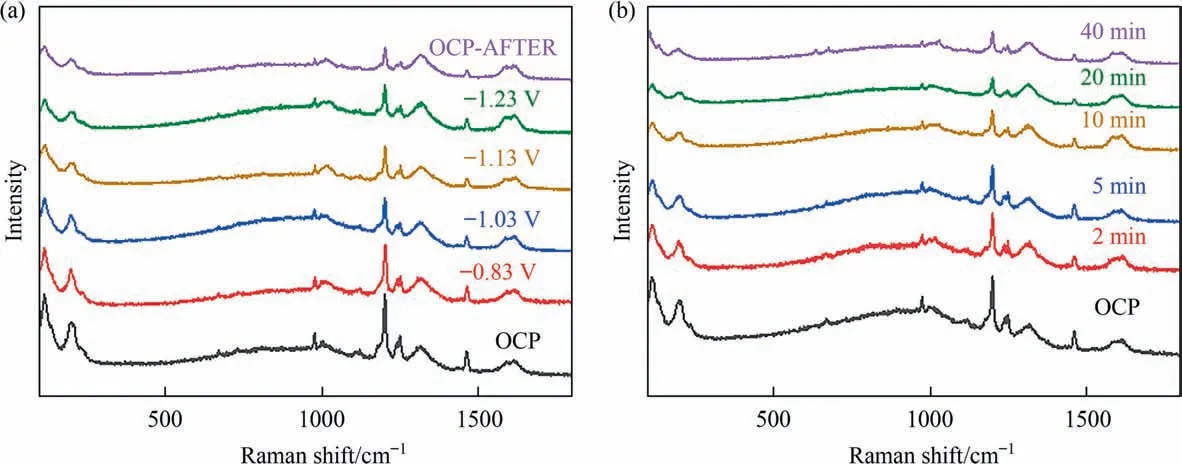
Fig.4.The in-situ Raman spectra measured with (a) varying the applied potential,(b) varying the acquiring time at -1.23 V vs.RHE in CO2-saturated 0.5 mol.L-1 KHCO3 aqueous.

Fig.5.TEM and HRTEM images of 2%Sn-N6-MOF(a)before and(b)after CO2RR.Room temperature 119Sn Mössbauer spectra acquired(c)before and(d)after maintained at-1.23 V vs.RHE in CO2-saturated 0.5 mol.L-1 KHCO3 aqueous for 1 h.
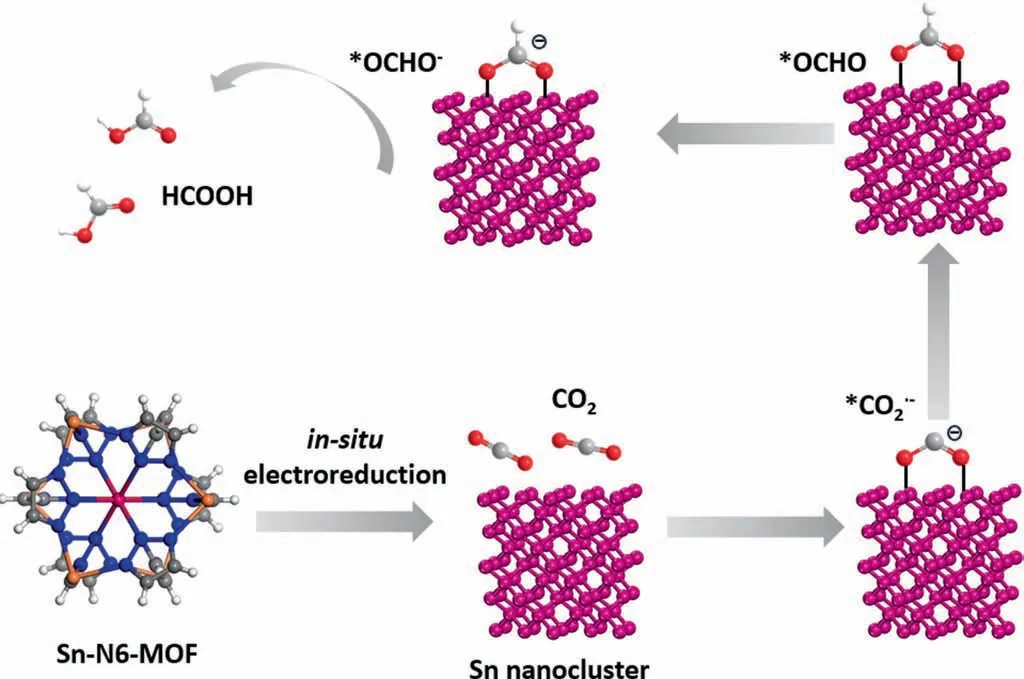
Fig.6.The proposed reaction pathway for the formation of HCOOH over Sn-N6-MOF.
3.3.Dynamic restructuring of 2% Sn-N6-MOF
To understand the origin of the outstanding performance of the as-synthesized Sn-based MOFs,in-situ Raman spectroscopy,ex-situ TEM,SEM,XRD and119Sn Mössbauer tests was conducted on 2%Sn-N6-MOF as CO2RR catalyst.Fig.4(a) and Fig.S11 show the insitu Raman spectra measured with varying applied potential in aqueous CO2and Ar-saturated 0.5 mol.L-1KHCO3solution,respectively.Prior to CO2RR at open circuit potential (OCP),one characteristic Raman peak at 197 cm-1is clearly observed on 2% Sn-N6-MOF,which can be assigned to the vibration of Sn (Zn)-N[28].With the increase of the applied potential from -0.83 to-1.23 V vs.RHE,the characteristic peak of Sn (Zn)-N gradually weakens,suggesting the possible structural reconstruction of the 2% Sn-N6-MOF catalyst.In-situ Raman spectroscopy results also show that the peaks attributed to C-N (1000–1400 cm-1) and C=C,C=N (1400–1600 cm-1) disappear gradually[23],indicating the loss of organic ligands of MOF structure during the electrochemical reconstruction[29].To better understand the reconstruction process of 2% Sn-N6-MOF,Fig.4(b) shows the in-situ Raman spectra measured with varying the acquiring time at -1.23 V vs.RHE in aqueous CO2-saturated 0.5 mol.L-1KHCO3.As shown,the characteristic peaks of Sn(Zn)-N,C-N,C=C,and C=N are observed to gradually disappear with increasing the acquiring time,further indicating the structure transformation of 2% Sn-N6-MOF.Results from these in-situ Raman measurements suggest that 2% Sn-N6-MOF catalyst undergoes in-situ dynamic restructuring during the electrochemical CO2RR.
The structural reconstruction of Sn-based MOFs in CO2RR was further confirmed by ex-situ characterizations including TEM,SEM,XRD and119Sn Mössbauer spectra.Fig.5 shows the microstructural characteristics of the 2% Sn-N6-MOF catalyst before and after CO2RR.As shown,the size of the nanoparticles has changed obviously.Moreover,the high-resolution transmission electron microscopy(HRTEM)image in Fig.5(b)shows a clear lattice spacing of 0.23 nm,which could be attributed to the (110)plane of Sn metal,illustrating the phase transition of 2% Sn-N6-MOF to tin nanoclusters.Fig.S12 shows that the average particle size of the tin nanoclusters in situ generated from 2% Sn-N6-MOF is less than 2 nm.In addition,as shown in Fig.S13,compared with the XRD pattern of 2% Sn-N6-MOF before CO2RR,the intensity of the strongest peak located at 2θ=8.7°significantly decreases after CO2RR,with the increasing of the peak intensity located at 2θ=17.3°,indicating that the original framework structure of the catalyst is significantly damaged.The SEM images of 2% Sn-N6-MOF after CO2RR are shown in Fig.S14,which also shows that the original octahedral morphology collapse into irregular structure after the electrochemical reconstruction.These changes indicate that the organic links are removed from the Sn-N6-MOF frames during reconstruction,resulting in large cleavages and structural collapse.
The valences state and coordination environment information of Sn in 2%Sn-N6-MOF catalyst before and after the reaction were further studied by room temperature119Sn Mössbauer spectra.As shown in Fig.5(c),the spectra of 2% Sn-N6-MOF before CO2RR exhibit a narrow doublet with an isomer shift (IS) of 0.11 mm.s-1and quadrupole splitting (QS) of 0.54 mm.s-1,which could be assigned to Sn4+sites coordinated with six N [30],well consistent with the XPS result (Fig.1(c)).The ex-situ119Sn Mössbauer results from 2%Sn-N6-MOF,acquired after maintained at-1.23 V vs.RHE in CO2-saturated 0.5 mol.L-1KHCO3aqueous for 1 h (Fig.5(d)),clearly evidence the in-situ reduction of Sn species to zero valence Sn metal(IS=2.59 mm.s-1,QS=0.31 mm.s-1) during the CO2RR process (Table S1).All these results suggest that the structural reconstruction of the as-synthesized Sn-based MOFs during the electrochemical CO2RR generates Sn nanoclusters as the true active species for CO2electroreduction to HCOOH.
The overall reaction pathway for the formation of HCOOH over Sn-N6-MOF is shown in Fig.6.Firstly,Sn-N6-MOF catalyst can undergo in-situ structural reconstruction during the CO2RR process with the generation of tin nanoclusters as real active sites.Secondly,CO2molecules form activated*CO2by adsorbing electrons on the surfaces of tin nanoclusters,and then,the activated intermediate*CO2-(where*denotes the adsorption site)forms the activated*OCHO-via electron-coupled proton transfer reactions,resulting the efficient electrochemical CO2reduction to formate.
4.Conclusions
In summary,a series of Sn-based MOFs were successfully developed.When applied as CO2RR catalysts,an optimal catalytic performance with a formate faradaic efficiency of~85% and a current density of 23 mA .cm-2at -1.23 V vs.RHE was achieved.In-situ Raman combined with ex-situ119Sn Mössbauer and TEM results demonstrate that the Sn-N6-MOF catalyst can undergo insitu structural reconstruction during the CO2RR process with the generation of tin nanoclusters act as the real active sites for CO2electroreduction to HCOOH.Results of this work provide new insights into the structural evolution of MOFs as advanced catalysts for CO2electroreduction.
Declaration of Competing Interest
The authors declare that they have no known competing financial interests or personal relationships that could have appeared to influence the work reported in this paper.
Acknowledgements
This work was financially supported by the National Key Research and Development Program of China (No.2021YFA1500502),the National Natural Science Foundation of China (22102176),CAS Project for Young Scientists in Basic Research (YSBR-022) and the Strategic Priority Research Program of the Chinese Academy of Sciences (XDB36030200).
Supplementary Material
Supplementary data to this article can be found online at https://doi.org/10.1016/j.cjche.2022.03.006.
杂志排行

Chinese Journal of Chemical Engineering的其它文章
- Green hydrogen:A promising way to the carbon-free society
- Electrochemical CO2 mineralization for red mud treatment driven by hydrogen-cycled membrane electrolysis
- Fabrication of azobenzene-functionalized porous polymers for selective CO2 capture
- Significantly enhanced charge transfer efficiency and surface reaction on NiP2/g-C3N4 heterojunction for photocatalytic hydrogen evolution
- CO2 capture by double metal modified CaO-based sorbents from pyrolysis gases
- Methane hydrate crystal growth on shell substrate