Two 3D Microporous Zn⁃MOF for Fluorescence Sensing of Fe3+,Cr2O7 2-,and Acetone in Aqueous Solution
2022-04-18GAOLouJunMIJingCHAIHongMeiRENYiXiaSUNXueHuaZHANGGangQiangZHANGYan
GAO Lou⁃JunMI Jing CHAI Hong⁃Mei*,REN Yi⁃Xia*, SUN Xue⁃HuaZHANG Gang⁃QiangZHANG Yan
(1Shaanxi Key Laboratory of Chemical Reaction Engineering,College of Chemistry and Chemical Engineering,Yan′an University,Yan′an,Shaanxi 716000,China)
(2Xinjiang Xuanli Environmental Protection Energy Co.,Ltd.,Hami,Xinjiang 839000,China)
Abstract:Two 3D microporous zinc metal⁃organic frameworks,formulated as[Zn3(DBA)(OH)(1,10⁃phen)2]n(1)and{[Zn2(HDBA)(4,4′⁃bipy)1.5]·H2O}n(2)(H5DBA=(3,5⁃di(2′,4′⁃dicarboxylphenyl)benzoic acid;1,10⁃phen=1,10⁃phenan⁃throline;4,4′⁃bipy=4,4′⁃bipyridine),were synthesized under solvothermal conditions.Structural analysis shows that 1 could be described as a 3D microporous framework based on the trinuclear metal units,while 2 exhibits the micro⁃porous structure from the binuclear zinc groups.Compared with 2,1 demonstrated a strong luminescence in the water,so it could be used as luminescent sensors for detection of Fe3+,Cr2O72−,and acetone molecules with high selectivity and sensitivity.CCDC:2076066,1;2076067,2.
Keywords:Zn⁃MOFs;Fe3+;Cr2O72−;acetone;fluorescence sensing
With the rapid development of industry,more and more pollutants are released into the environment,such as toxic metal ions,organic small molecules,and nitro⁃aromatic compounds(NACs),which lead to many adverse effects on human health and life[1⁃3].According to previous works of literature,traditional measuring approaches,such as mass spectrum,atomic emission spectroscopy,and gas spectrometer,require sophisti⁃cated instruments and proficient skill,and it is time⁃consuming,complex pretreatment[4].Compared with the above instrumental methods,the luminescent sensor was considered a promising material because of the advantages of easy operation,fast speed response,low detection,etc[5].Acetone is a poisonous substance,so the high concentrated acetone in the environment can cause some symptoms,such as headache,dizziness,and nausea.To human health,it is very important to exploit a fast⁃response acetone sensor to monitor its concentration[6⁃7].Fe3+is an essential trace element in the human body.However,excessive or insufficient Fe3+will cause a variety of diseases[8⁃10].Furthermore,the detection of Fe3+ion is key to early diagnosis of these diseases and as well as assessment of important indicators of human health.Cr2O72−is a potent carcino⁃genic substance that will affect people′s health even at a low concentration.It has been classified as a serious pollutant by the United States Environmental Protec⁃tion Agency(USEPA)[11⁃13].It is vitally important to detect the Cr2O72−in aqueous media.Therefore,it is imperative to establish a superior sensitivity and high selectivity chemical sensing method to monitor heavy metal ions,organic small molecules,explosive aromat⁃ic substances in the environment of medicine,industry,and so on[14⁃15].
Metal⁃organic frameworks(MOFs),as one of the most promising candidates of porous material,have been constructed from metal ions/clusters and organic ligands[16].Their excellent properties such as high porosity,large surface areas,adjustable channel as well as rich structural network,lead to their wide⁃spread application in drug diversity[17⁃18],gas separation/storage[19⁃20],chemical sensing[21],catalysis[22⁃23],electro⁃chemistry sensing[24⁃25],and so on.Luminescence MOF has gained great progress in synthesis,design,and sensing application and has attracted the attention of many researchers as a desirable sensing material[26⁃28].The mechanism of MOFs luminescence involves elec⁃tron transfer and energy transfer processes,such as metal⁃to⁃ligand charge transfer(MLCT),ligand⁃to⁃metal charge transfer(LMCT),ligand⁃to⁃ligand charge transfer (LLCT), metal⁃to⁃metal charge transfer(MMCT)[29].Meanwhile,it refers to the introduction of guest molecules,including guest sensitization and guest⁃centered emission.MOFshave been constructed through topology design,pore functionalization,and so on,so an increasing number of MOFs have been con⁃structed as fluorescent sensing materials and lumines⁃cent chemical sensors[30⁃31].
In this work,two 3D microporous Zn⁃MOFs have been constructed based on 3,5⁃di(2′,4′⁃dicarboxylphe⁃nyl)benzoicacid(H5DBA),namely[Zn3(DBA)(OH)(1,10⁃phen)2]n(1)and{[Zn2(HDBA)(4,4′⁃bipy)1.5]·H2O}n(2)(1,10⁃phen=1,10⁃phenanthroline;4,4′⁃bipy=4,4′⁃bipyri⁃dine),under the solvothermal condition.The lumines⁃cence properties of 1 and the crystal structures of 1 and 2 have been studied.It was concluded that 1 has fluorescence sensing properties for Fe3+,Cr2O72−,and acetone.
1 Experimental
1.1 Materials and methods
All of the reagents were commercially available and used directly in the experiment without any purifi⁃cation.Powder X⁃ray diffraction(PXRD)patterns were collected on a PANalytical X′Pert PRO instrument with CuKαradiation(λ=0.154 06 nm,U=45 kV,I=40 mA,2θ=5°⁃50°).TGA curves were recorded by Netzsch TG209.Fluorescence spectra were performed by the Hitachi F⁃7000 fluorescence spectrophotometer.FT⁃IR(KBr pellet)spectra were recorded on a Shimadzu IRAFFINITY⁃1S spectrometer in a range of 4 000⁃500 cm−1.Elemental analyses(C,H,N)were performed using a Vario EL elemental analyzer.
1.2 Synthesis of[Zn3(DBA)(OH)(1,10⁃phen)2]n(1)
A mixture of Zn(NO3)2·6H2O(0.1 mmol),H5DBA(0.1 mmol),1,10⁃phenanthroline monohydrate(0.1 mmol),DMF(1 mL),H2O(8 mL),and NaOH(1 mL)were sealed in 25 mL Teflon⁃lined stainless autoclave.Then the autoclave was heated to 160℃for 72 h and was cooled to 30 ℃ at a descending rate of 4 ℃·h−1.Some orange crystals were obtained and washed with water,then dried in air(86% based on Zn).Anal.Calcd.for C47H26N4O11Zn3(%):C,55.35;H,2.55;N,5.49.Found(%):C,55.37;H,2.66;N,5.50.FT⁃IR(KBr pellets,cm−1):3 056(w),2 342(w),1 626(s),1 556(s),1 505(w),1 418(m),1 364(m),1 100(w),929(w),845(s),785(s),721(s),691(m),638(w),554(w)(Fig.S1,Supporting information).
1.3 Synthesis of{[Zn2(HDBA)(4,4′⁃bipy)1.5]·H2O}n (2)
A mixture of Zn(NO3)2·6H2O(0.1 mmol),H5DBA(0.1 mmol),4,4′⁃bipyridine(0.1 mmol),H2O(9 mL),HAc⁃NaAc solution(pH=6,1 mL)were sealed in 25 mL Teflon ⁃lined stainless autoclave.Then the auto⁃clave was heated to 160℃for 72 h and was cooled to 30 ℃ at a descending rate of 4 ℃·h−1.Some colorless crystals were obtained and washed with water,then dried in air(62% based on Zn).Anal.Calcd.for C38H22N3O10Zn2·H2O(%):C,55.02;H,2.89;N,5.07.Found(%):C,55.26;H,2.68;N,5.09.FT⁃IR(KBr pel⁃lets,cm−1):3 056(w),2 343(w),1 617(s),1 559(s),1 405(s),1 372(s),1 296(w),1 215(w),1 060(w),806(m),765(m),726(w),686(w),628(m),592(w)(Fig.S1).
1.4 Structure determination
The data for 1 and 2 were collected from a single crystal at 296.15 K on a Bruker APEX2 QUAZAR single⁃crystal diffractometer with a microfocus sealed X⁃ray tube using mirror optics as monochromator and a Bruker APEXⅡdetector.The diffractometer was equipped with an Oxford Cryostream 800 low⁃tempera⁃ture device and used MoKαradiation(λ=0.071 073 nm).All data were integrated with SAINT and a multi⁃scan absorption correction using SADABS was applied.The structures were solved by partial structure expan⁃sion using SHELXS and refined by full⁃matrix least⁃squares methods againstF2by SHELXL.All non⁃hydrogen atoms were refined with anisotropic displace⁃ment parameters.The hydrogen atoms were refined isotropically on calculated positions using a riding model with their Uiso values constrained to 1.2 times theUeqof their parent atoms.PLATON/SQUEEZE program was used to remove the disordered solvent molecules in the structure.Crystallographic data and structure refinement for 1 and 2 are displayed in Table 1.Selected bond lengths and bond angles for 1 and 2 are summarized in Table S1(1)and S2(2).
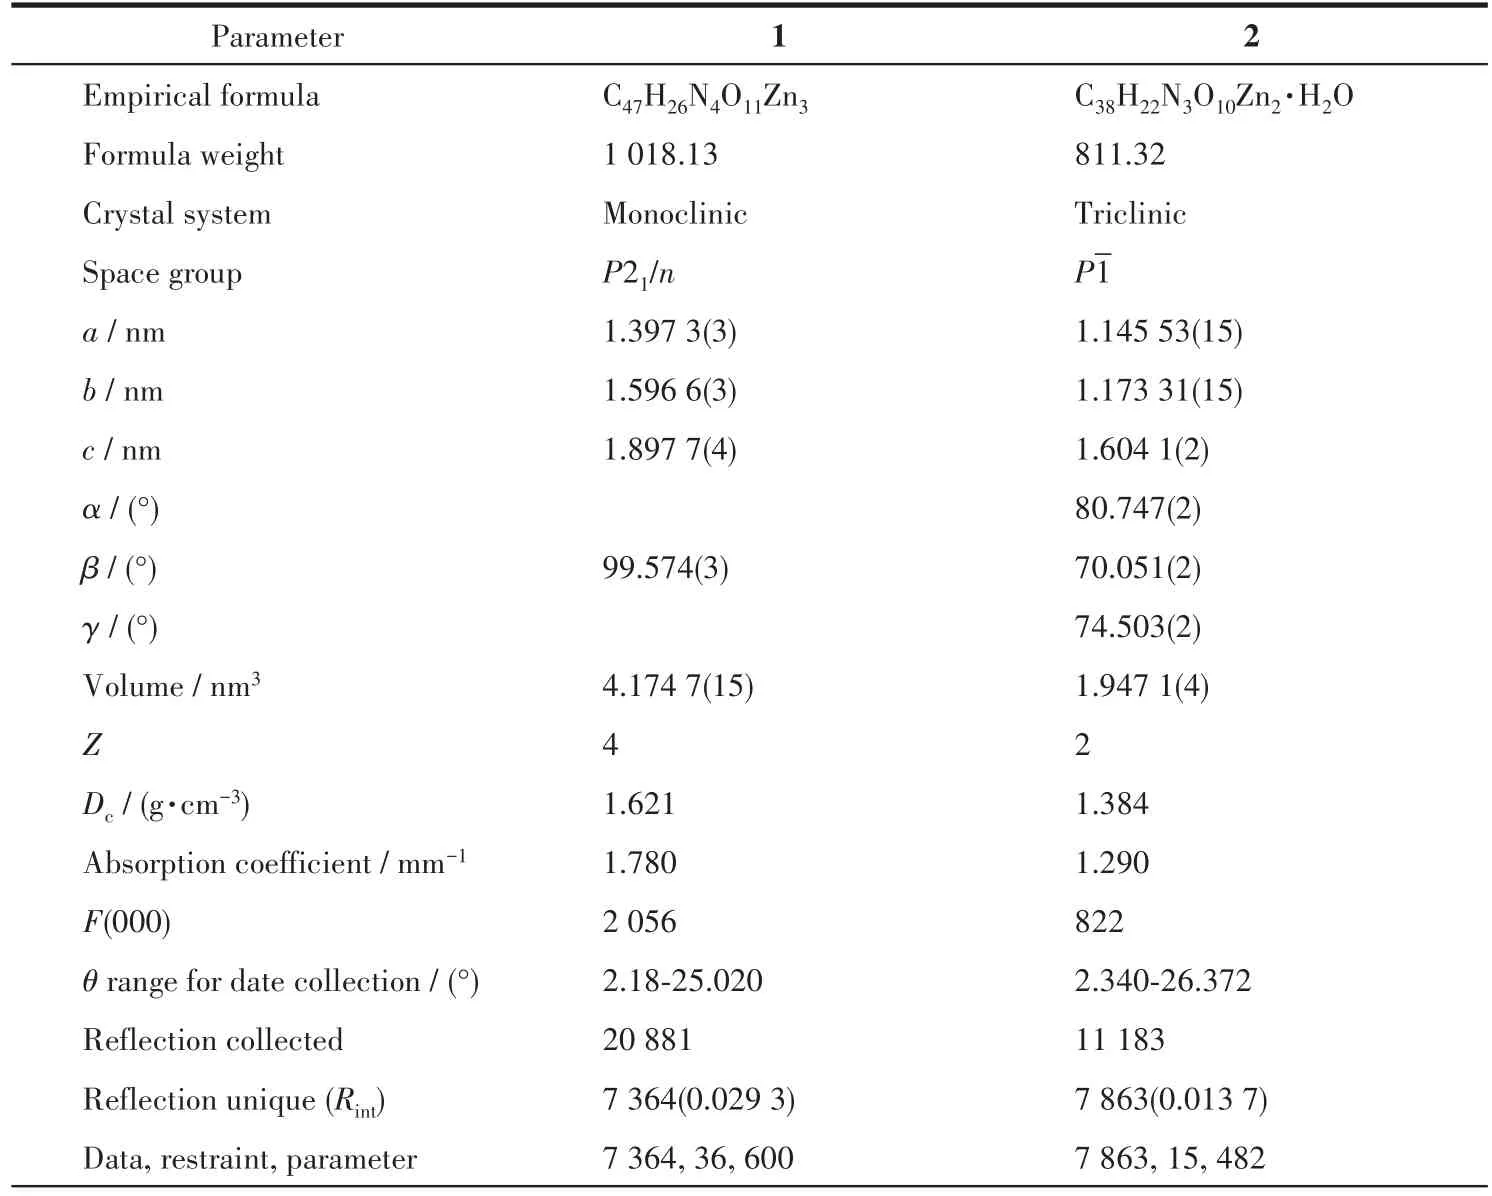
Table 1 Crystallographic data and structure refinement for 1 and 2
CCDC:2076066,1;2076067,2.
Continued Table 1
1.5 Luminescence sensing experiments
The powder of complex 1(3 mg)was dispersed in 3 mL different solutions or different solvents to form a suspension,then it was sonicated for 30 min and kept at room temperature for 3 d before fluorescence mea⁃surement.Those different solutions(0.01 mol·L−1)included M(NO3)x(Mx+=Pb2+,Ni2+,Cd2+,Bi3+,Hg2+,Na+,Co2+,Ag+,K+,Mg2+,Fe2+,Al3+,Fe3+,Cu2+)or KyX(Xy−=Cr2O72−,I−,Ac−,Br−,SO42−,SCN−,Cl−,CO32−,H2PO4−,PO43−,ClO4−,IO−,S2−,SO2−33),and those different sol⁃vents includedN,N⁃dimethylformamide(DMF),water(H2O),isopropanol(IPA),acetone(CP),n⁃propanol(NPA),dimethylsulfoxide(DMSO),ethanol(EA),acetic acid(HAc),trichloromethane(CHCl3),methanol(MT),cyclohexane(CYH),ethyl acetate(EAc).
2 Results and discussion
2.1 Crystal structure
2.1.1 Crystal structure of complex 1
Single⁃crystal X⁃ray analysis shows that 1 crystal⁃lizes in the monoclinic system withP21/nspace group(Table 1).The asymmetric unit of 1 consists of three independent Zn2+ions,one DBA5−ligand,one coordi⁃nated hydroxyl group,and two 1,10⁃phen molecules(Fig.1a).Zn1 is centered in a six⁃coordinate octahedron geometry with three carboxyl oxygen atoms(O1,O11,and O6#1)of two DBA5−ligands,two nitrogen atoms(N1 and N2)from one 1,10⁃phen molecule,and one hydroxyl oxygen atom(O9)(Fig.S2a).Zn2 forms a five⁃coordinate environment coordinated with two carboxyl oxygen atoms(O2 and O10)from the monodentate bridged carboxyl of one DBA5−,two nitrogen atoms(N3 and N4)of a 1,10⁃phen molecule,and one hydroxyl oxygen atom(O9)(Fig.S2b).Zn3 lies in a six⁃coordinate geometry including one hydroxyl oxygen atom(O9#4)and four carboxylate oxygen atoms(O3,O4,O5#3,and O6#3)coming from two DBA5−ligands,respectively,and one carboxyl oxygen(O8#2)from the other ligand in a monodentate bridging⁃coupled coordination mode(Fig.S2c).The bond length scope of Zn—O/N is 0.194 7(2)⁃0.218 97(19)nm and the range of O—Zn—O bond angle is 85.72(7)°⁃176.80(8)°(Table S1).
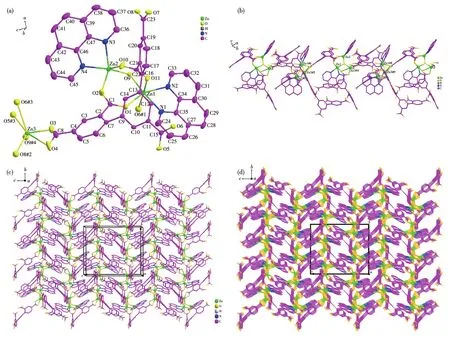
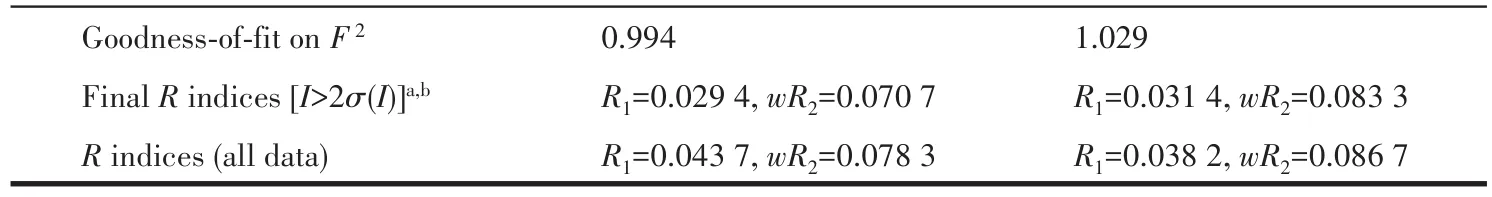
Fig.1 (a)Coordination environment of metal ions and DBA5−ligand in 1 with 30% thermal ellipsoids;(b)1D chains based on adjacent Zn1,Zn2,Zn3 trinuclear units;(c)2D network;(d)3D microporous framework
Zn1,Zn2,and Zn3 are connected through one hydroxyl oxygen atom(O9)forming a trinuclear metal cluster(Fig.S2d).The coordination mode of the full deprotonation DBA5−ligand in 1 isκ1κ2⁃κ1κ0⁃κ1κ1⁃κ1κ1⁃κ1κ1⁃μ6to link six metal ions(Fig.S2e).Adjacent trinu⁃clear metal clusters are alternately connected into a 1D chain by chelating and bridging carboxyl groups of DBA5−ligands(Fig.1b).1D chains are bridged with the carboxylates of DBA5−ligands to form a 2D network in thebcplane(Fig.1c).Then the 2D network is extended into a 3D microporous framework through the multi⁃dentate DBA5−ligand(Fig.1d).
2.1.2 Crystal structure of complex 2
Single⁃crystal X⁃ray analysis reveals that 2 crys⁃tallizes in the triclinic system with theP1 space group(Table 1).The asymmetric unit of 2 consists of two independent Zn2+ions,one HDBA4−ligand,one and a half of 4,4′⁃bipy molecules(Fig.2a).Zn1 is in a five⁃coordinate environment with four carboxyl oxygen atoms(O1#1,O2,O9,and O10)from three HDBA4−ligands,one nitrogen atom(N1)of one 4,4′⁃bipy mole⁃cule.Two oxygen atoms(O9 and O10)are from one chelated carboxylate of one HDBA4−ligand,and two oxygen atoms(O1#1 and O2)from the other two HDBA4−ligands in monodentate bridged coordination mode,respectively(Fig.2a).Zn2 ion also lies in a five⁃coordinate environment with four carboxyl oxygen atoms(O3,O8,O4#2,and O7#2)of two ligands,one nitrogen atom(N2)of 4,4′⁃bipy(Fig.2a).The bond length scope of Zn—O/N is 0.196 34(15)⁃0.301 55(6)nm,and the range of O—Zn—O bond angle is 59.37(7)°⁃157.99(7)°.
Fig.2 (a)Coordination environment of metal ions and ligands in 2 with 30% thermal ellipsoids;(b)2D network;(c)3D microporous framework
Two adjacent atoms are bridged by one carboxyl⁃ate of HDBA4−ligand forming a binuclear cluster(Zn1…Zn1),which is connected by the HDBA4−ligand into 1D chain A(Fig.2b).Two adjacent Zn2 ions are connected by one HDBA4−ligand forming a similar binuclear cluster(Zn2…Zn2 cluster,Fig.S3a)and 1D chain B(Fig.2b).Each HDBA4−ligand adopts the coor⁃dination mode ofκ1κ1⁃κ1κ1⁃κ1κ1⁃κ1κ1⁃κ0κ0⁃μ5(Fig.S3b).Two 1D chains A and B are crossing to form a 2D net⁃work bridged by HDBA4−ligands(Fig.2b).The 2D net⁃works are connected by the pillared 4,4′⁃bipy ligands forming a 3D microporous structure(Fig.2c).
2.2 General characterization of 1 and 2
The phase purity of complexes 1 and 2 has been confirmed by PXRD(Fig.S4a and S4b).The peaks in the PXRD patterns of as⁃synthesized complexes were coincident with the simulated patterns,proving their high purities.TGA curves(Fig.S4c)exhibited high thermal stability up to 450℃for 1,and the skeleton gradually collapsed between 450 and 700℃mainly caused by the decomposition of 1,10⁃phenanthroline,with a weight loss of 35.5%(Calcd.35.3%),and then it probably continued to collapse with further increasing temperature.While 2 had a slight weight loss(2.0%)before 70℃,which may be the loss of solvent H2O molecules(Calcd.2.1%,indicating that an asymmetric unit contains one water molecule).It had high thermal stability between 70 and 320℃,and then its skeleton gradually collapsed between 320 and 700℃,mainly due to the decomposition of ligand(HDBA4−),with a weight loss of 55.4%(Calcd.55.0%),and then it continued to decompose with further increasing temper⁃ature.
2.3 Luminescent properties
2.3.1 Fluorescence properties of solids
The solid⁃state fluorescence spectra of 1,2,and the ligands at room temperature are shown in Fig.3.It shows that 1 had the stronger emission peak at 368 nm,while 2 didn′t show any luminescence,because the N⁃donor molecules of the two complexes are different.Hence,it can be concluded that the presence of an aux⁃iliary ligand may affect LLCT[32⁃34].Internal emission of two complexes may be attributed to theπ*→πorπ*→ntransition,which leads to enhanced and quenching of fluorescence[34⁃35].So 1 can be potentially used as a luminescent material.
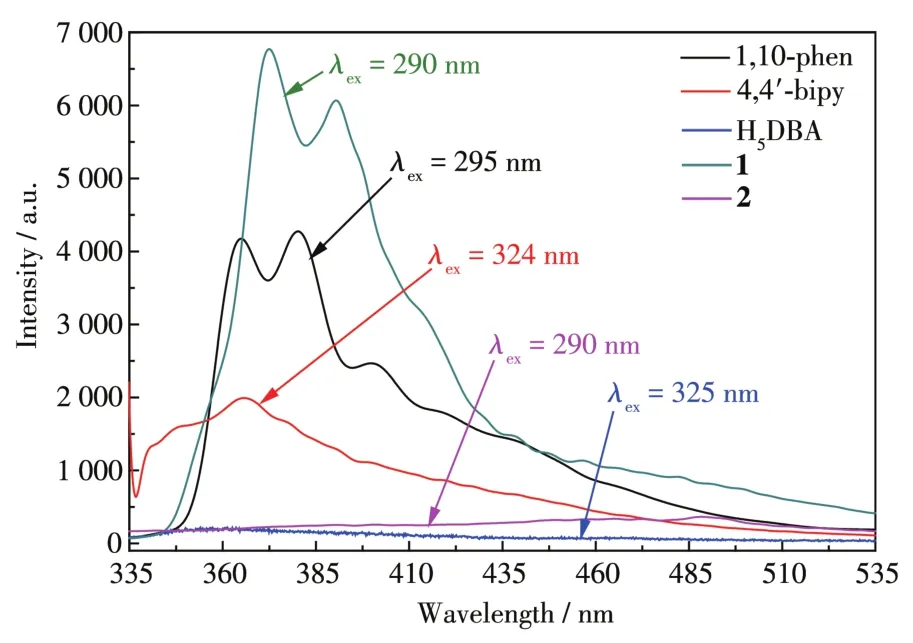
Fig.3 Solid⁃state fluorescence spectra of 1,2,and the ligands
2.3.2 Sensing for small solvent molecules
The results of the solvent molecule sensing experi⁃ment of 1 are shown in Fig.4a.It is found that the sol⁃vent can influence the intensity of emission peak,and especially,the acetone caused the fluorescence quenching of 1.Therefore,1 can act as a highly selec⁃tive and sensitive sensor to detect acetone.The lumi⁃nescence titration spectra of 1 for acetone are shown in Fig.4b.It was found that there was a good linear rela⁃tionship between the concentration of acetone(cCP)in a range of 0⁃1.535 mmol·L−1andI0/I−1.The linear equa⁃tion wasy=22.677 5x−1.618 01(Fig.4b,Inset).The detection limit was 7.26 mmol·L−1(at 3σ/klevel,whereσis the standard deviation,kis the slope).The results indicate that 1 is a sensitive fluorescent sensing material for acetone quantitative analysis.Usually,the fluorescence quenching may be caused by the structur⁃al collapse of fluorescent materials.Compared with the simulated pattern,the PXRD pattern of 1 was unaffect⁃ed(Fig.S4a).Hence,the quenching mechanism is attributed to the competitive absorption of energy between 1 and acetone[36⁃37].
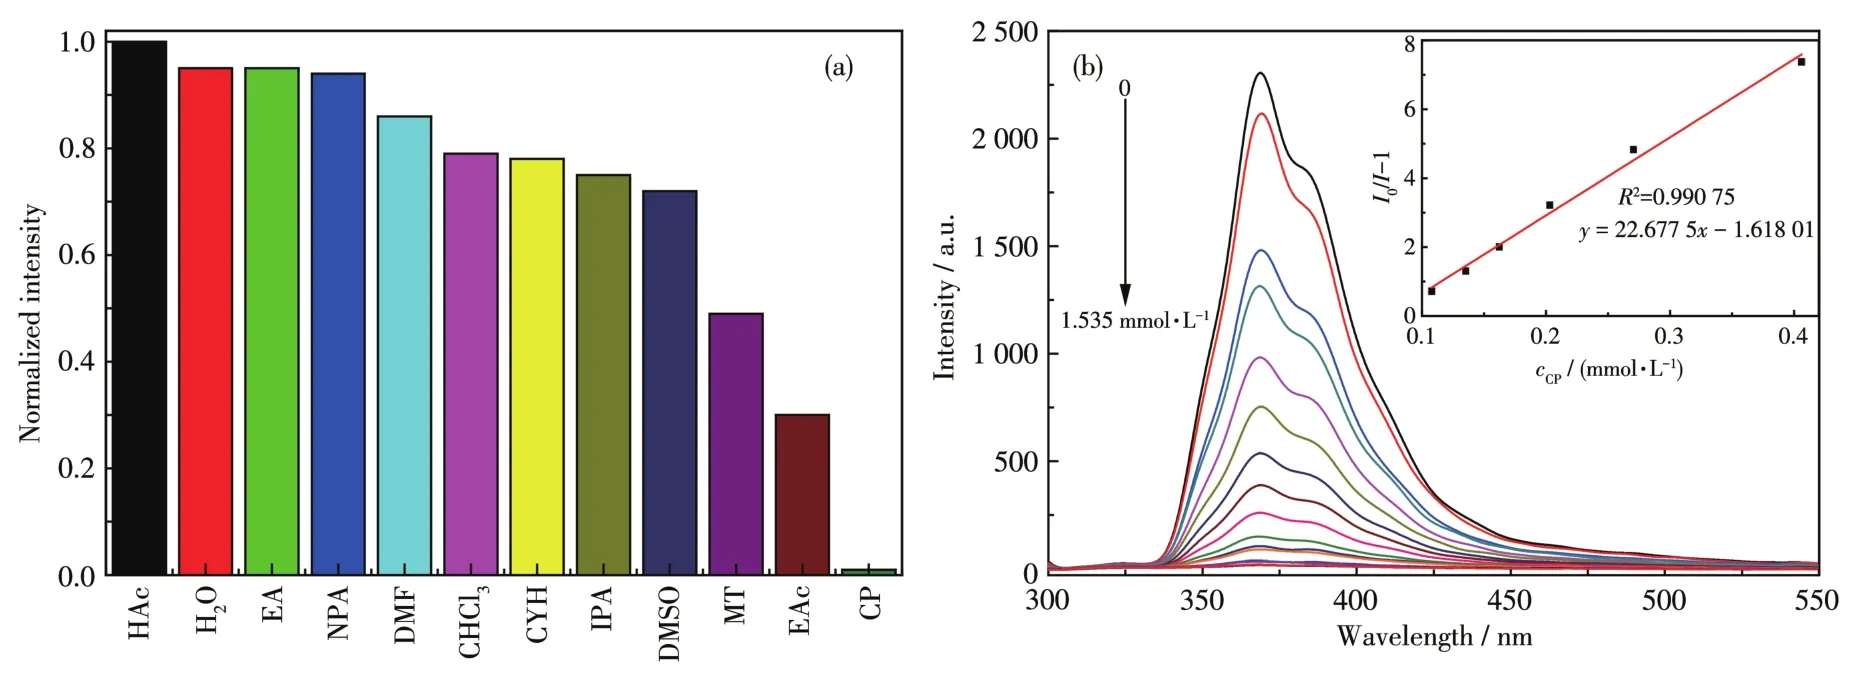
Fig.4 (a)Relative fluorescence intensity of 1 introduced into various pure organic solvents;(b)Luminescence spectrum titration of 1 for sensing acetone
2.3.3 Sensing for metal ions
As shown in Fig.5a,1 showed different lumines⁃cence intensities in different metal ions solutions.Especially, the luminescence was significantly quenched when the suspension of 1 was mixed with Fe3+solution.Further study found that the lumines⁃cence intensity of 1 gradually decreased with the increase of Fe3+concentration(0⁃180 μmol·L−1,Fig.5b).The quenching efficiency of 1 can be quantitatively described with the Stern⁃Volmer equation:whereI0andIare luminescence intensities of 1 before and after adding Fe3+,respectively;cFe3+is the concentration of Fe3+;Ksvis the quenching effect coeffi⁃cient of the Fe3+.There was a good linear relationship between the concentration of Fe3+andI0/I−1:y=0.304 12x−0.162 9(Fig.5b,Inset),and theKsvwas 3.0×10⁵L·mol−1.The detection limit for Fe3+was caculated to be 0.54 μmol·L−1(at 3σ/klevels).Compared with the detection limit of Fe3+previously reported[38],1 can be used as a highly selective and sensitive fluorescent sensor.
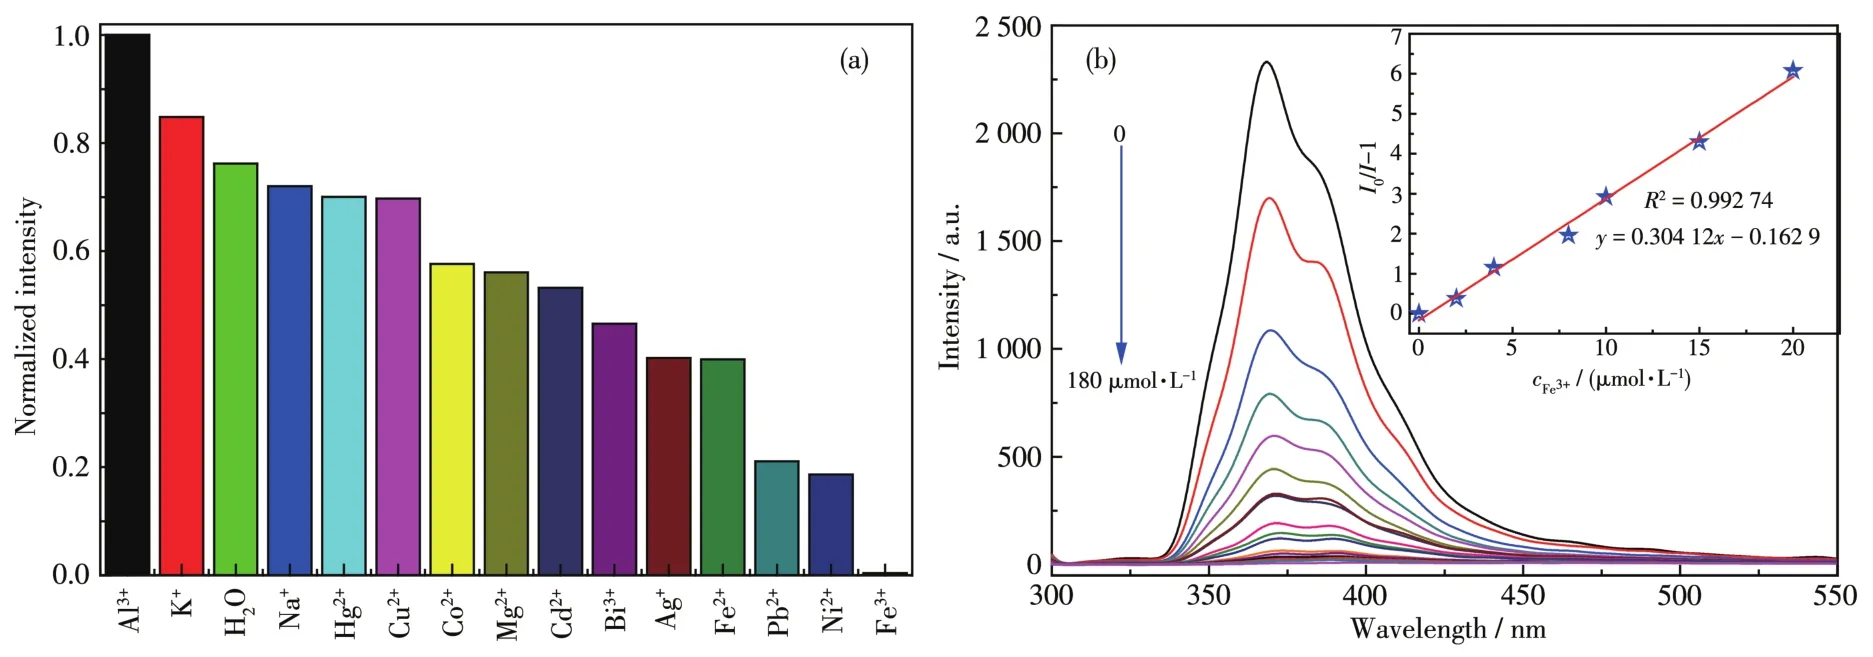
Fig.5 (a)Normalized intensity of 1 in different metal ions solutions;(b)Luminescence spectrum titration of 1 for sensing Fe3+
To discuss the luminescence quenching mecha⁃nism of Fe3+toward 1,UV⁃Vis spectra of 1 in different metal ions solutions were determined(Fig.S5),and it was found that only Fe3+had a particularly strong absorption in a range of 290⁃380 nm.Therefore,the flu⁃orescence quenching mechanism might be attributed to the competitive absorption of Fe3+and 1[39].
To further explore the potential applications of such a sensitive MOF sensor in the biological system,we performed sensing experiments of 1 under the simu⁃lated physiological condition(20 mmol·L−1HEPES buf⁃fer solution,pH=7)with different Fe3+concentra⁃tions[40].With increasing Fe3+concentration in the HEPES buffer solution,the luminescence intensity of 1 decreased dramatically(Fig.6).The sensing behaviors of 1 under biological conditions were similar to those observed in an aqueous solution,but theKsvvalue was slightly lower(Ksv=1.19×10⁴L·mol−1)(Fig.6,Inset).The result indicates that 1 could be considered as a flu⁃orescent probe for sensing Fe3+in a biological system.
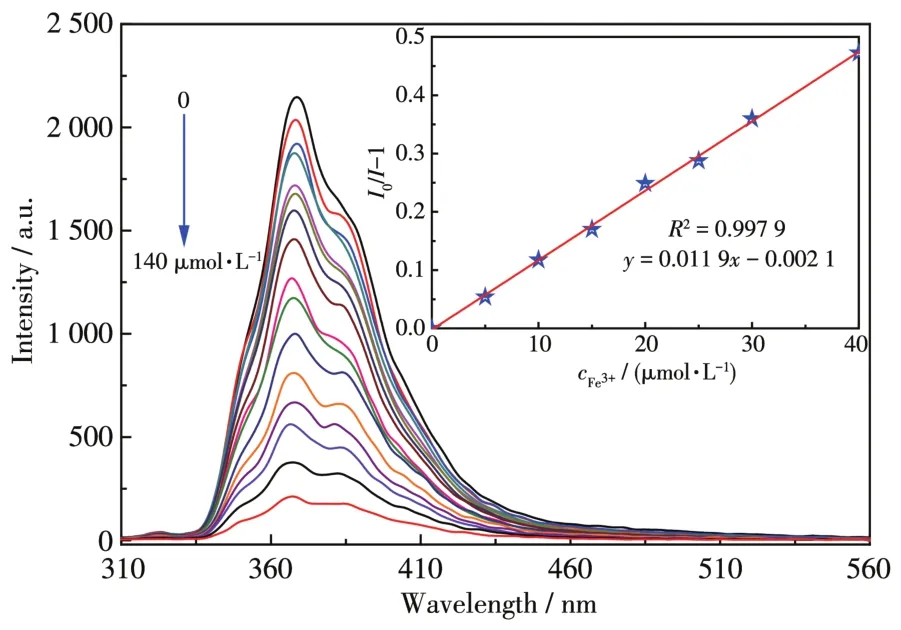
Fig.6 Luminescence spectrum titration of 1 for sensing Fe3+in HEPES aqueous solution
2.3.4 Sensing for inorganic anions
The fluorescence intensity of 1 is closely related to the coexistence of inorganic anions,and especially,the quenching effect of Cr2O72−to 1 was very obvious(Fig.7a).The luminescence intensity of 1 gradually decreased with increasing concentration of Cr2O72−(Fig.7b).It can be concluded in Inset of Fig.7b that there was a good linear relationship betweenI0/I−1 and the concentration of Cr2O72−in a range of 0⁃80 μmol·L−1,which linear equation wasy=0.240 23x−0.062 1.The detection limit was 0.69 μmol·L−1(at 3σ/klevels).To further study the luminescencequenching mecha⁃nism of Cr2O72−toward 1,the UV⁃Vis absorption spec⁃troscopy was studied(Fig.S6).It can be found that only CrO2−27had a strong absorption band in a range of 300⁃400 nm,so the possible fluorescence quenching mecha⁃nism is attributed to the competitive absorption of CrO2−27ions and 1[41⁃42].
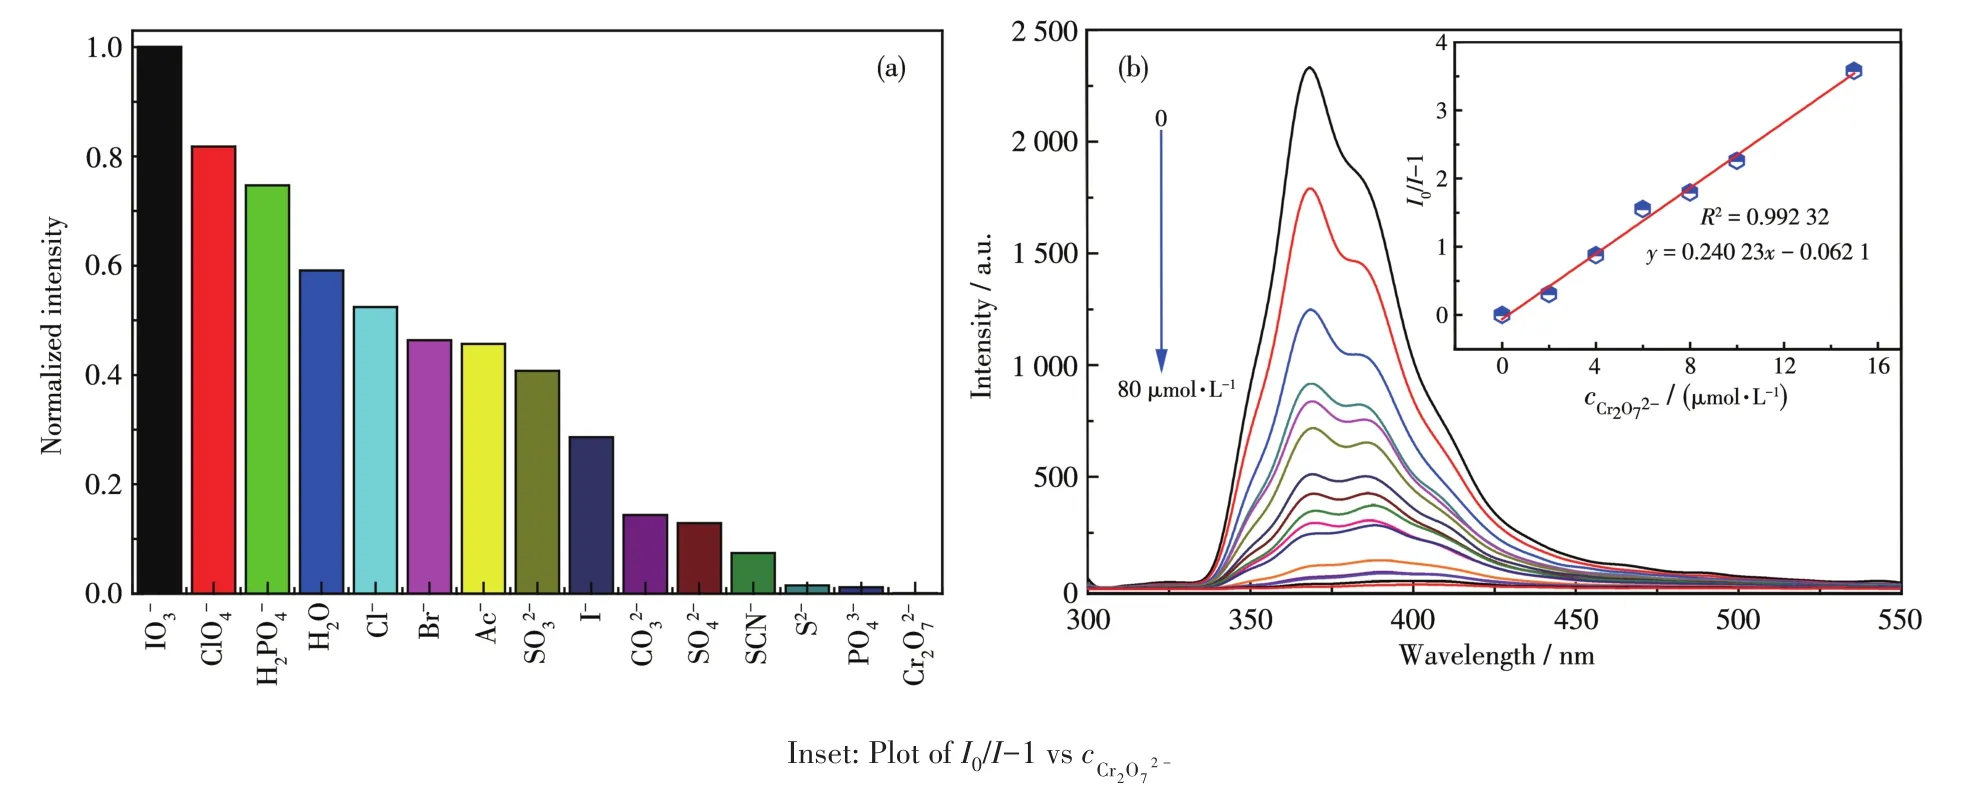
Fig.7 (a)Relative fluorescence intensity of complex 1 in different anionic solutions;(b)Luminescence spectrum titration of 1 for sensing CrO2−27
2.3.5 Recyclability after sensing experiment
To further evaluate the re⁃utilization of 1 for Fe3+,Cr2O72−,and acetone sensing detection,1 was washed with water and ethanol and dried after sensing.Then the recovered samples of 1 were immersed again in the aqueous solution(0.01 mol·L−1)of Fe3+,Cr2O72−,and acetone to detect the fluorescence intensities,respec⁃tively.After five cycles of quenching and recovery of fluorescence intensity,the fluorescence intensity of 1was unchanged(Fig.S7).The PXRD patterns showed that the structure remains integrated after quenching and recovery(Fig.S4a).It follows that 1 can be used as a stable and recyclable chemical sensing for detecting Fe3+,Cr2O72−,and acetone.
3 Conclusions
In summary,two 3D microporous Zn⁃MOFs,1 and 2,based on H5DBA were successfully constructed.1 shows a stable microporous structure featuring the trinuclear inorganic building unit,while 2 exhibits a 3D framework based on the binuclear unit.Different N⁃donor ligands result in different luminescence proper⁃ties.1 possessed strong luminescence with superior selectivity and sensitivity induced in aqueous medium Fe3+(0.54 μmol·L−1),Cr2O72−(0.69 μmol·L−1),and acetone(7.26 mmol·L−1).However,2 has poor lumines⁃cence.The structure of 1 remains intact after multiple cycles of sensing,indicating it is an efficient and recy⁃clable sensing material.
Conflicts of interest:The authors declare no competing financial interest.
Supporting information is available at http://www.wjhxxb.cn