Short-term biochar effect on soil physicochemical and microbiological properties of a degraded alpine grassland
2022-04-16JinshengLIXinqingSHAODingHUANGKesiLIUJianyingSHANGQianZHANGTianciZHAOandXiaomengYANG
Jinsheng LIXinqing SHAODing HUANGKesi LIU∗Jianying SHANGQian ZHANGTianci ZHAO and Xiaomeng YANG
1College of Grassland Science and Technology,China Agricultural University,Beijing 100193(China)
2National Field Station of Grassland Ecosystem at Guyuan,Hebei 076550(China)
3Department of Water and soil Science,China Agricultural University,Beijing 100193(China)
ABSTRACT Soil remediation is an important part of the restoration process of degraded terrestrial ecosystems.Due to its unique properties,biochar is being used widely as an effective soil modifier in agricultural systems,but research is still rare on biochar application in grassland ecosystems,especially in degraded alpine grasslands.In this study, we conducted a plot experiment to investigate the effect of biochar application on soil physicochemical properties and microorganisms at the 0–20 cm soil depth of a degraded alpine grassland in Qinghai-Tibet Plateau,China.The experiment consisted of four corn straw biochar application levels(0%,0.5%,1%and 2%,with the percentage representing the ratio of biochar weight to the dry weight of soil in the surface 20 cm soil layer).When the biochar addition increased from 0%to 2%,total nitrogen,total organic carbon and available phosphorus in the 0–10 cm soil layer increased by 41%,55%and 45%,respectively,in the second year after biochar addition.Meanwhile,soil electrical conductivity decreased,and soil water content increased.Total microbial,fungal and bacterial biomasses in the 0–10 cm soil layer increased from 9.15 to 12.68,0.91 to 1.34,and 3.85 to 4.55µg g−1,respectively.The relative biomasses of saprophytic fungi and methanotrophic bacteria decreased,while the relative biomasses of ectomycorrhizal fungi and arbuscular mycorrhizal fungi increased.These results indicate that biochar has a great potential in improving microbial activity and soil fertility in soil remediation of the degraded alpine grassland.
KeyWords: bacteria,fungi,microbial community,phosphatase,soil fertility,soil modifier,soil remediation,urease
INTRODUCTION
Alpine grassland ecosystem is an important part of the world’s grassland ecosystem(Scholzet al.,2018).In China,alpine grassland is one of the most important ecological functional areas,and its ecosystem service value is crucial to the stability of the ecosystem in Asia and across the world (Qiu, 2008).In the Qinghai-Tibet Plateau, the area of alpine grassland is about 1.2×10⁸ha, accounting for 33% of the total grassland area in China (Li X Let al.,2013).The unique topography and location of the Qinghai-Tibet Plateau make it one of the most sensitive and fragile regions to human disturbance and climate change(Zenget al.,2015).Since the 1980s,due to severe human disturbances(overgrazing,unreasonable land use,etc.)and climate change(global warming),the degradation area of alpine grassland has reached 11.43×10⁴km2, which accounts for 17.2%of the native grassland in the Qinghai-Tibet Plateau (Yuet al., 2012).In the Qinghai-Tibet plateau, the degraded grassland has led to a decrease of grassland productivity and an increase in toxic plants(Wanget al.,2018),and also led to soil degradation, resulting in a gradual decrease in soil fertility, carbon (C) sequestration capacity, moisture content and soil infiltration (Renet al., 2013; Wenet al.,2013).Many studies have found that a major cause of soil degradation is the loss of soil organic C (Li X Let al.,2013).Raiesi(2017)evaluated 16 indicators of soil quality in grassland and cultivated land and found that organic C explained 77% of soil quality.In many ways, the level of soil organic C is the key to changes in soil physical and chemical properties,soil microbial community structure and soil nutrients(Sharmaet al.,2008;Ankenbauer and Loheide,2017;Zhenget al.,2018).Direct addition of organic C to degraded soil is a measure to rapidly increase soil C content and restore soil quality,which has been validated to some extent in degraded soil of agricultural systems,especially crop production systems(Zimmermanet al.,2011).In recent years,biochar is being used widely as a soil amendment to improve cropland soil(Alghamdi,2018;Gaoet al.,2019).
Biochar is a solid substance rich in C produced by pyrolysis of plant residues or animal wastes under hypoxic condition(Harteret al.,2014).Biochar has a large specific surface area and pore structure and contains abundant alkyl and aromatic functional groups(Kuzyakovet al.,2009;Yanget al.,2019).Previous studies have demonstrated the positive effects of biochar addition for the remediation of degraded agricultural soil,including the increase of the accumulation and availability of organic C in agricultural soil(Steinbeisset al.,2009;Paetschet al.,2017),adjustion of soil pH(Qambraniet al.,2017),improvement of soil water conductivity,water retention and porosity(Kuzyakovet al.,2009;Chen Cet al.,2018),increase of soil nutrient availability(Nguyenet al.,2017)and microbial activity and content(Luoet al.,2013;Bammingeret al.,2014)and decrease of soil organic matter mineralization rate(Zimmermanet al.,2011).
In the last several years,biochar utilization in grassland systems has increased, and some studies have found that biochar addition has positive effects on grasslands,such as enhancing water retention capacity of grassland soil(Reedet al.,2017),improving soil fertility(Hanet al.,2016)and increasing grassland productivity(Biedermanet al.,2017).However,most of these biochar studies related to grasslands concentrated on semi-arid temperate grasslands and sown pastures(Gebhardtet al.,2017;Fanget al.,2018).In alpine grasslands, especially in degraded alpine grasslands, the remediation effect of biochar addition remains unexplored.Compared with other grassland types,alpine grassland has its own special climate(low temperature and harsh sunlight)and soil condition(a low degree of soil development and greatly affected by freezing and thawing).Therefore, under the intervention of biochar,soil physicochemical properties and microbial activities in the alpine grassland system might be different from the temperate grassland system.However,such kind of research information in this field is rare,and studies are needed to provide theoretical support for the effectiveness of biochar with respect to the restoration of degraded alpine grassland.Therefore,the purpose of our study was to access:i)whether the addition of biochar affected soil physical and chemical properties and microorganisms of the degraded alpine grassland,ii)whether the effects of different amounts of biochar on soil microorganisms and physical and chemical properties of degraded alpine grassland were equal,and iii)whether the increase of the residence time of biochar in soil increased the effects on soil microorganisms and physical and chemical properties of degraded alpine grassland.
MATERIALS AND METHODS
Studysite
The experimental site was located in the alpine grassland in the Northeast of Senduo Town,Guinan County,Qinghai Province,China(36°35′N,101°42′E,3 220 m above sea level),characterized by a typical plateau continental climate,with an annual average temperature of 2.3°C and an annual precipitation of 404 mm, approximately 87% falling in the growing season(May–September).The annual average frost-free period is 63 d, the annual sunshine is 2 738 h,and the annual evaporation is 1379 mm.The main plant species includePoa crymophila,Cleistogenes squarrosa,Carextristachya,Elymus sibiricus.L,Elymus nutansGriseb.,Ligularia Cass,Stipa kryloviiRoshev.,OxytropisDC.andStellera chamaejasmeL.The soil type is chernozem, and the soil texture is sandy loam soil.
Experimental design and soil sampling
According to the national standard “Parameters of degradation, sandification and salification of rangelands”(GB19377-2003) and the actual conditions of the alpine grassland,grasslands with 40%–60%coverage and less than 10 plant species were defined as moderate-severe degradation and selected as the research object in the middle of May 2017.Biochar used in the experiment was made from corn straw by pyrolysis at 550°C and contained 508.9 g kg−1organic C,10.2 g kg−1total nitrogen(N)(TN)and 80.95 g kg−1total phosphorous(P).It had an electrical conductivity of 1 595µs cm−1and a pH of 8.96 determined by acidity meter with deionized water.
Biochar was applied at four levels,the ratios of biochar weight to the dry weight of soil in the surface 20 cm soil layer of 0%(0 kg m−2),0.5%(1 kg m−2),1%(2 kg m−2)and 2% (4 kg m−2), on June 3, 2017.Initial soil bulk density in the experimental site was 1 g cm−3.The 2%biochar treatment was the relatively high application level used in the crop field for soil improvement.The experimental design was a complete random block design with three blocks, and each block contained four randomly arranged treatment plots.Each experimental plot was 2 m long×2 m wide, and there was a 1.5 m buffer strip between plots and a 3 m buffer between blocks.In order to reduce the destruction to grassland and accelerate the transport of biochar in soil,the combined methods of hole application and surface application were adopted in the process of biochar application.We assumed that biochar in the holes would move with the flow of water or the extension of the root system to some extent.Sixteen 20 cm deep holes were drilled in each plot with a soil auger(3.5 cm in diameter),and there was a 50-cm interval between holes.Different amounts of biochar were applied to the corresponding treatment plots according to the experimental design.Biochar was filled into the holes firstly,and the amount of biochar in each hole was basically equal among treatments.The remaining biochar was evenly scattered on the surface of the plot through surface application.Appropriate amount of soil was used to coversurface biochar thinly and then lightly tramped to prevent biochar from being blown away by the wind.The entire experimental area was fenced to prevent grazing disturbance.
We collected soil samples from each plot in late July 2017 and 2018 during the peak growing period.Three sampling points within each plot were randomly selected for soil sampling.To evaluate the effect of biochar addition on main underground growing environment of vegetation,soil samples were taken from the root-growing soil layer (0–20 cm)using a 3.5-cm diameter soil auger at each sampling point,and the soil layer of 0–20 cm was divided into 0–10 cm and 10–20 cm.If the hole area was picked during sampling,we would reselect a sampling point randomly.Samples from the same sampling plot in the same sampling layer were combined into one composite sample.The composite sample was separated into three parts.One portion was put into an aluminum box for soil water content(SWC)determination as follows:

where G1 is the weight of the aluminum box, G2 is the weight of the aluminum box plus original soil sample,and G3 is the weight of the aluminum box plus dried soil sample.The second part of the composite sample was used for soil chemical analysis, and the third part was kept at−20°C for the determination of soil alkaline phosphatase (PHO)activity,urease(UR)activity and main soil microorganism properties.
Measurements of soil physicochemical properties and UR and PHO activities
Determination of soil physiochemical properties included pH,electrical conductivity(EC),SWC,TN,total organic C (TOC), ammonia-N (NH+4-N), nitrate-N (NO−3-N) and available P (AP).Soil EC and pH were determinedviaconductivity meter(METTLER TOLEDO,Switzerland)and acidity meter,respectively.Soil TN and TOC were measured by Fisher 2000 elemental analyzer(Thermo Fisher Scientific,Italy).Soil NH+4-N and NO−3-N were extracted by 2 moL L−1potassium chloride (KCL) at a KCL:soil ratio of 1:5(volume:weight) and then determined by a flow autoanalyzer(FIA Compact,Germany).Soil AP was measured by the sodium bicarbonate extraction molybdenum antimony anti-colorimetric method(JingHua,China(Liet al.,2015).
We determined soil UR and PHO activities to test the conversion capacity of N and P after biochar addition.Soil UR activity was determined by the colorimetric method with sodium phenol-sodium hypochlorite(Xieet al.,2013).Soil PHO activity was determined by disodium phenyl phosphate colorimetry(Zhanget al.,2013).
Soil microbial communityassays
Phospholipid fatty acid(PLFA)analysis was used to determine main soil microbial biomass.This method was originally described by Bligh and Dyer(1959)and modified by Whiteet al.(1979).The lipids were extracted from 8 g freezedried soil using a single-phase mixture of phosphate buffer,chloroform and methanol(0.8:1:2,volume:volume:volume).The neutral lipids and other impurities were removed from crude extracts using silicic acid column chromatography.The n-fatty acids were obtained by saponifying the purified products.The moderate methyl ester method was used to methylate fatty acids and obtain phospholipid fatty acid methyl esters(FAMEs).Gas chromatography(Agilent 6850,Agilent,USA)was used to analyze the FAMEs with Sherlock MIDI software(Newark,USA).
Total microbial biomass was determined from the total PLFA concentration(Frostegårdet al., 1993).Markers of bacterial PLFA are 14:0, i14:0, i15:0, a15:0, 16:0, 15:0,i16:0, 16:1ω7, iso17:1, i17:0, a17:0, 17:0, 18:0, 18:1ω7,18:1ω5,cy19:0 and cy17:0.Fungal PLFAs markers include 18:2ω6c and 18:1ω9c.The PLFAs 10Me17:0,10Me17:0 and 10Me18:0 predict actinomycetes.The PLFAs cy17:0,16:1ω7 and cy19:0 mark gram-negative,while gram-positive PLFAs markers include i14:0,i15:0,a15:0,i16:0,a17:0 and i17:0(Frostegrd and Bth,1996;Olsson,1999;Zelles,1999;Evgrafovaet al.,2008;Djukicet al.,2010).Individual PLFA markers are as follows: 15:0iso for gram-positive bacteria, 16:1ω7c for gram-negative bacteria, 16:10 methy for actinobacteria,16:1ω5c for arbuscular mycorrhizal fungi,18:1ω9c for saprotrophic fungi or ectomycorrhizal fungi,18:1ω7c for methanotrophic bacteria,18:2ω6,9c for saprotrophic fungi and 19:0 cyclo for anaerobic bacteria(Vestal and White,1989;Bardgettet al.,1996;Olsson,1999;Sundhet al.,2000;Smithet al.,2015).
Statistical analysis
Differences between treatments in different years or soil layers were determined by one-way analysis of variance(ANOVA)(Tukey test,P <0.05).Soil properties and PLFA measurements were indicated by means of three replicates and standard errors(SEs)of the means.Microbial community structure was compared and analyzed using principal component analysis(PCA).Correlations between biochar and soil enzyme activities,phsicochemical properties,and microbial community structure were calculated by partial least squares path modeling(PLSPM).Relationships between microbial biomass,bacterial biomass,fungal biomass and the amount of biochar were analyzed using Pearson linear regression test,and the relationships between different environmental factors and microbial communities were explored by partial Mantel tests.Redundant analysis(RDA)was used to analyzethe relationships between indicator microorganisms and soil physiochemical properties.In the RDA test, there was no collinearity indicators and the variance expansion factors(VIF)<20.Therefore, the typical correlation coefficient between environmental index and axis was stable.It was worth further explanation(De Pdua Teixeiraet al.,2008).The PCA,RDA and partial Mantel test were conducted in R3.3.3(vegan package),correlation between each environmental factor was tested in R3.3.3(corrplot package),and PLSPM was conducted in R3.3.3(plspm package).IfP <0.05,the effects were considered significant.
RESULTS
Soil physicochemical properties and UR and PHO activities
Biochar amendment affected the dynamics of soil physiochemical properties in the degraded alpine grassland(Tables I and II).Soil TOC in the 0–10 cm and 10–20 cm layers increased significantly with increasing biochar addition(P <0.05,Table I)and reached the maximum under 2%biochar addition,up to 57.43 g kg−1in 2017 and 63.54 g kg−1in 2018 in the 0–10 cm soil layer,and 36.60 g kg−1in 2017 and 36.61 g kg−1in 2018 in the 10–20 cm soil layer.Soil TOC in the 0–10 cm layer was slightly higher in the second year(2018)than the first year(2017),but TOC in the 10–20 cm soil layer had no significant changes between two years.In comparison with 0%biochar addition,biochar addition increased TN in different soil layers.In the 0–10 cm soil layer,when the biochar addition increased from 0%to 2%,TN increased from 2.76 to 3.67 g kg−1in 2017 and from 3.43 to 4.84 g kg−1in 2018,indicating an increase of 33%and 41%, respectively.Soil TN increase in the 10–20 cm layer was slightly less than the 0–10 cm soil layer.When the biochar addition increased from 0%to 2%,TN increased by 20%in 2017 and 32%in 2018.In each soil layer,TN in the second year(2018)was slightly greater than that in the first year(2017).
Soil AP in the 0–20 cm layer increased with increasing biochar addition(Table I).In the 0–10 cm soil layer,when the addition of biochar increased from 0%to 2%,AP increased from 2.68 to 4.10 mg kg−1in 2017 and from 3.02 to 4.37 mg kg−1in 2018,increasing by 53%and 45%,respectively.This increase trend was more obvious when the amount of biochar added was greater than 1%.In the 10–20 cm soil layer,AP had no significant difference in 2017 and 2018 as the amount of biochar increased from 0%to 1%,but AP was significantly higher under 2%biochar addition than 0%.In the first year(2017),soil NH+4-N in different layers decreased significantly but increased with the increase of biochar application in the second year(2018).In comparison with 0%biochar addition,when the addition of biochar increased from 0.5% to 2%in the 0–10 and 10–20 cm soil layers, NH+4-N decreased by 36%and 42%, respectively, in 2017, and increased by 100%and 56%, respectively, in 2018.In both soil layers,-N increased significantly in the first year(2017)with the increase of biochar application(Table I).In the second year(2018),-N was not significantly different among treatments in the 0–10 cm soil layer(around 4.97–5.77 mg kg−1),however,NO−3-N in the 10–20 cm soil layer increased by 39%–67%as the amount of biochar increased from 0.5%to 2%.
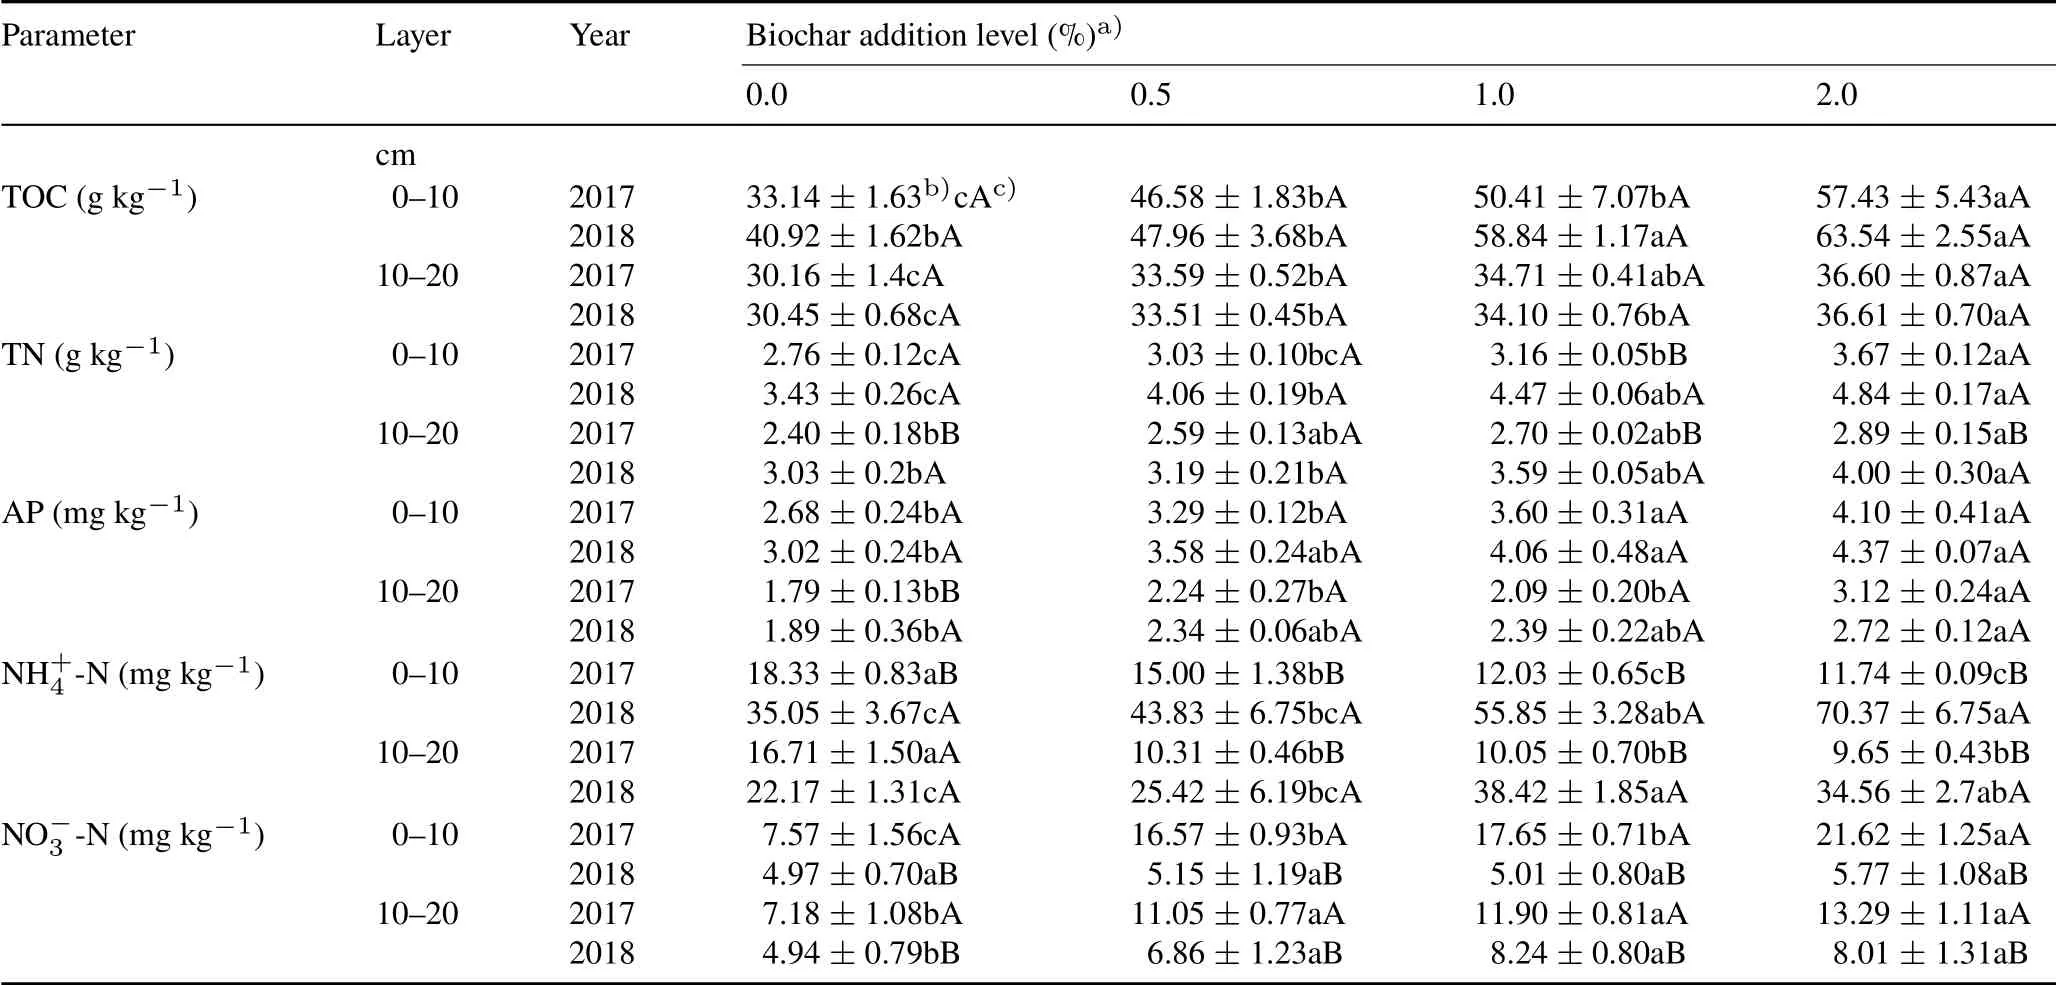
TABLE IVariations in soil total organic C(TOC),total N(TN),available P(AP),NH+4 -N and NO−3 -N in two soil layers under different biochar addition levels in 2017 and 2018
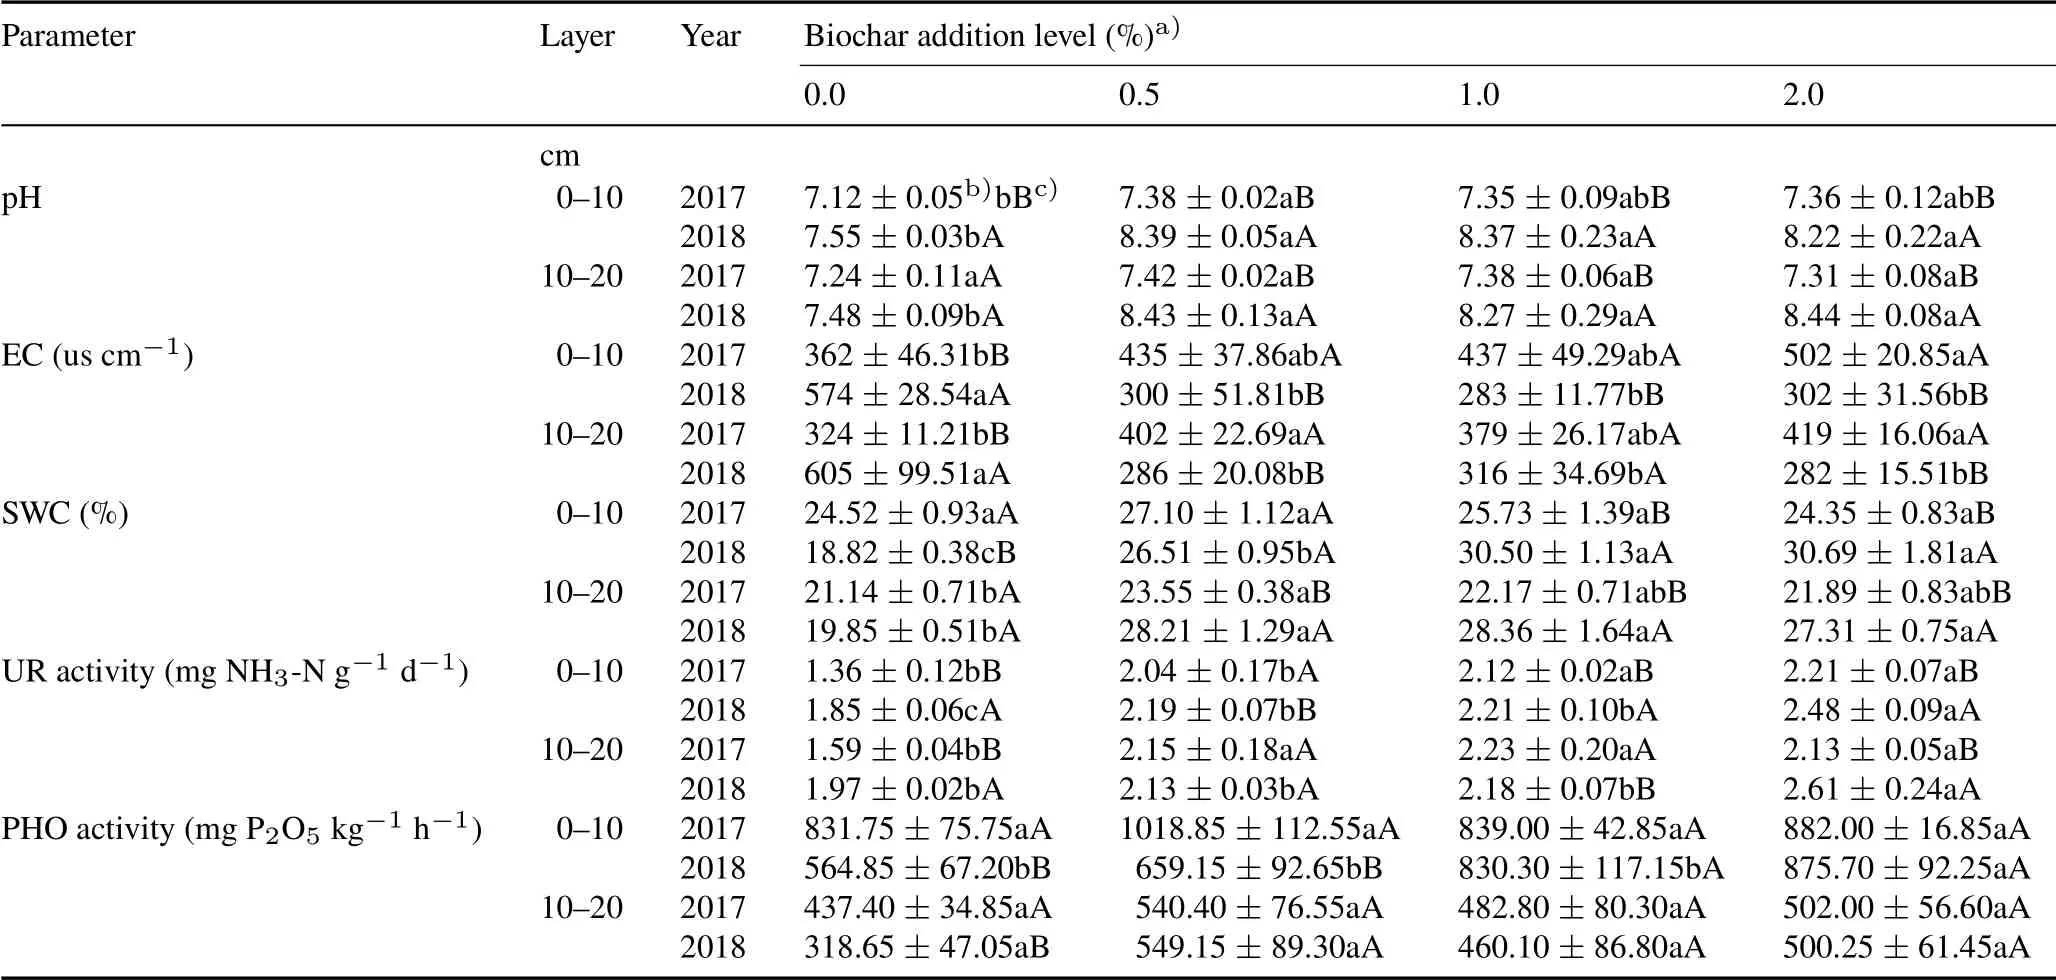
TABLE IIVariations in soil pH,electrical conductivity(EC),water content(SWC)and activities of soil urease(UR)and phosphatase(PHO)in two layers under different biochar addition levels in 2017 and 2018
Biochar increased soil pH to a certain extent,which was especially obvious in the second year(2018)(Table II).In 2018,pH increased from 7.55 without biochar to 8.33 with biochar in the 0–10 cm soil layer and from 7.48 without biochar to 8.38 with biochar application in the 10–20 cm soil layer.Soil EC significantly decreased in the second year(2018)compared with the first year(2017),while SWC had no difference among treatments in the first year(2017)but increased significantly in treatments with biochar addition compared with 0%biochar addition.
Soil UR activity in different soil layers increased significantly with the increase of biochar(Table II).In the 0–10 cm soil layer,when the addition of biochar increased from 0%to 2%,UR activity increased from 1.36 to 2.21 mg NH3-N g−1d−1in 2017 and from 1.85 to 2.48 mg NH3-N g−1d−1in 2018,increasing by 63%and 34%,respectively.The addition of biochar had no significant effect on PHO activity in the 0–20 cm soil layer.Only in the second year(2018),when the biochar application reached 2%,PHO activity in the 0–10 cm soil layer increased to a certain extent,reaching 875.70 mg P2O5kg−1h−1.
Soil microbial communities
Biomasses of microbial communities in the 0–20 cm soil layer tended to increase with increasing biochar additions(Fig.1).When the amount of biochar increased from 0%to 2%,total microbial,bacterial and fungal biomasses in the 0–10 cm soil layer increased by 39%,18%,and 46%,respectively.Among them,the increase in fungi biomass was significant(P=0.02).In the 10–20 cm soil layer,the biomasses of total microbes and bacteria increased significantly with increasing biochar additions,but the fungal biomass had no significant change(P=0.58).Soil microbial,bacterial and fungal biomasses decreased with increasing soil depth.
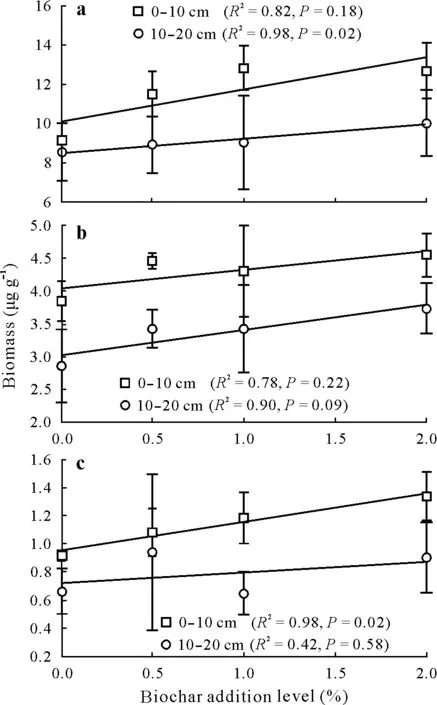
Fig.1 Effects of different biochar addition levels on total microbial(a),bacterial(b)and fungal(c)biomasses in two soil layers.Values are means with standard errors(n=3).Solid fitted lines are from the pearson linear regression test.Biochar addition level is the ratio of biochar weight to the weight of dried soil in the surface 20 cm layer.
Different microbial communities had different responses to the addition of biochar(Fig.2a,b).The PCA results revealed that 93.07%of the variation in the 0–10 cm soil layer and 94.80%of the variation in the 10–20 cm soil layer was explained by the first two axes.In the 0–10 cm soil layer,the biomass of ectomycorrhizal fungi in biochar treatments was greater than 0%biochar treatment and increased with the increase of biochar addition amount.Anaerobic bacteria,gram-negative bacteria and actinobacteria decreased in biochar treatments compared with 0% biochar treatment.Compared with the first application year(2017),the relative biomasses of saprophytic fungi and methanotrophic bacteria decreased, while the relative biomasses of arbuscular mycorrhizal fungi and ectomycorrhizal fungi increased inthe second year(2018).In the soil layer of 10–20 cm,microbial community structure was stable among treatments,and the addition of biochar slightly increased the biomass of ectomycorrhizal fungi but decreased the biomass of saprophytic fungi.Along with application time,the addition of biochar increased the biomass of ectomycorrhizal fungi but decreased the biomass of saprophytic fungi.
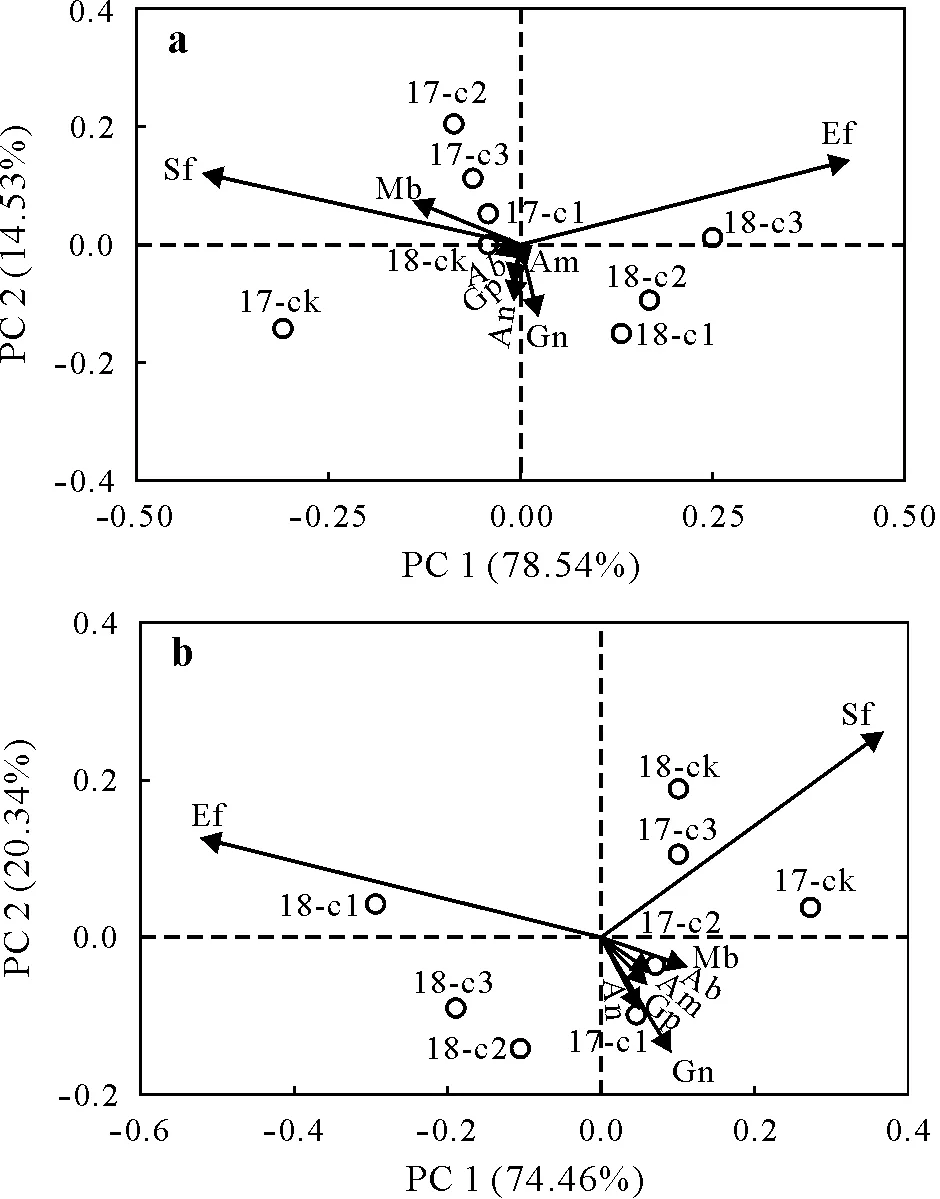
Fig.2 Principal component(PC)analysis of soil microbial communities in the 0–10 cm (a)and 10–20 cm (b) soil layers under different biochar addition levels in 2017 and 2018.Gn = gram-negative bacteria; Ab =actinobacteria;Gp=gram-positive bacteria;Sf=saprotrophic fungi;Ef=ectomycorrhizal fungi;Mb=methanotrophic bacteria;An=anaerobic bacteria; Am = arbuscular mycorrhizal fungi; 17-ck, 17-c1, 17-c2 and 17-c3 = 0.0%, 0.5%, 1.0% and 2.0% biochar addition levels in 2017,respectively;18-ck,18-c2,18-c2 and 18-c3=0.0%,0.5%,1.0%and 2.0%biochar addition levels in 2018,respectively.
Relationships between soil microbial communities and environmental factors
In 2017 and 2018,relationships among soil microbial communities,physicochemical properties and enzymes in different layers and biochar were profiled by PLSPM(Fig.3).The model was reliable because the goodness of fit value was greater than 0.06.Biochar had a significant positive effect on soil physical and chemical properties and microbes in different layers.Path coefficients between biochar and soil properties reached 0.93 and 0.91 in the 0–10 cm soil layer in 2017 and 2018, respectively, and reached 0.88 and 0.85 in the 10–20 cm soil layer in 2017 and 2018,respectively.This indicated that the addition of biochar had a direct and significant positive effect on soil physicochemical properties in the 0–20 cm soil layer.This effect decreased slightly with increasing soil depth.Path analysis indicated that the direct effects of biochar addition on soil enzymes were not significant,but soil physicochemical properties had significant effects on soil enzymes.Direct effect of biochar on microorganisms was significant positive only in the 0–10 cm soil layer,and path coefficient was up to 1.55 in 2017 and 1.49 in 2018.

Fig.3 Correlations among biochar and soil enzyme activities,microbial communities and physicochemical properties analyzed by partial least squares path modeling.Blue and red arrows indicate positive and negative path coefficients, respectively, and solid and dashed lines indicate significant and non-significant path coefficients,respectively(P <0.05).Soil physicochemical properties include total organic C,total N,available P,NH+4 -N,NO−3 -N,electrical conductivity,and water content;soil enzymes include urease and phosphatase.
All soil physicochemical properties showed significant correlation in the 0–10 cm soil layer under biochar addition(P <0.05,Fig.4).Except for EC,PHO activity and NO−3-N,the soil environmental properties were positively correlated(r >0).Among them,TOC,TN,pH and NH+4-N had the strongest correlations(r <0.6).Biochar addition promoted the interaction between fungal community and soil physicochemical properties,and the fungal community had the strongest interactions with EC,NO−3-N,PHO activity and TN(P <0.001,r <0.5).The change trend of relationship among soil properties in the 10–20 cm soil layer was similar to that in the 0–10 cm soil layer, with significant positivecorrelations between most of the properties(P <0.05,r >0),with the exception of EC and NO−3-N.Fungal community only had significant interactions with AP,TOC and NO−3in the 10–20 cm soil layer(P <0.05),indicating smaller effect of biochar on fungal community of the 10–20 cm soil layer than the surface soil(0–10 cm).However,biochar promoted the correlations of actinobacteria to AP and UR activities and the correlation between gram-positive bacteria and EC in the 10–20 cm soil layer(P <0.05).
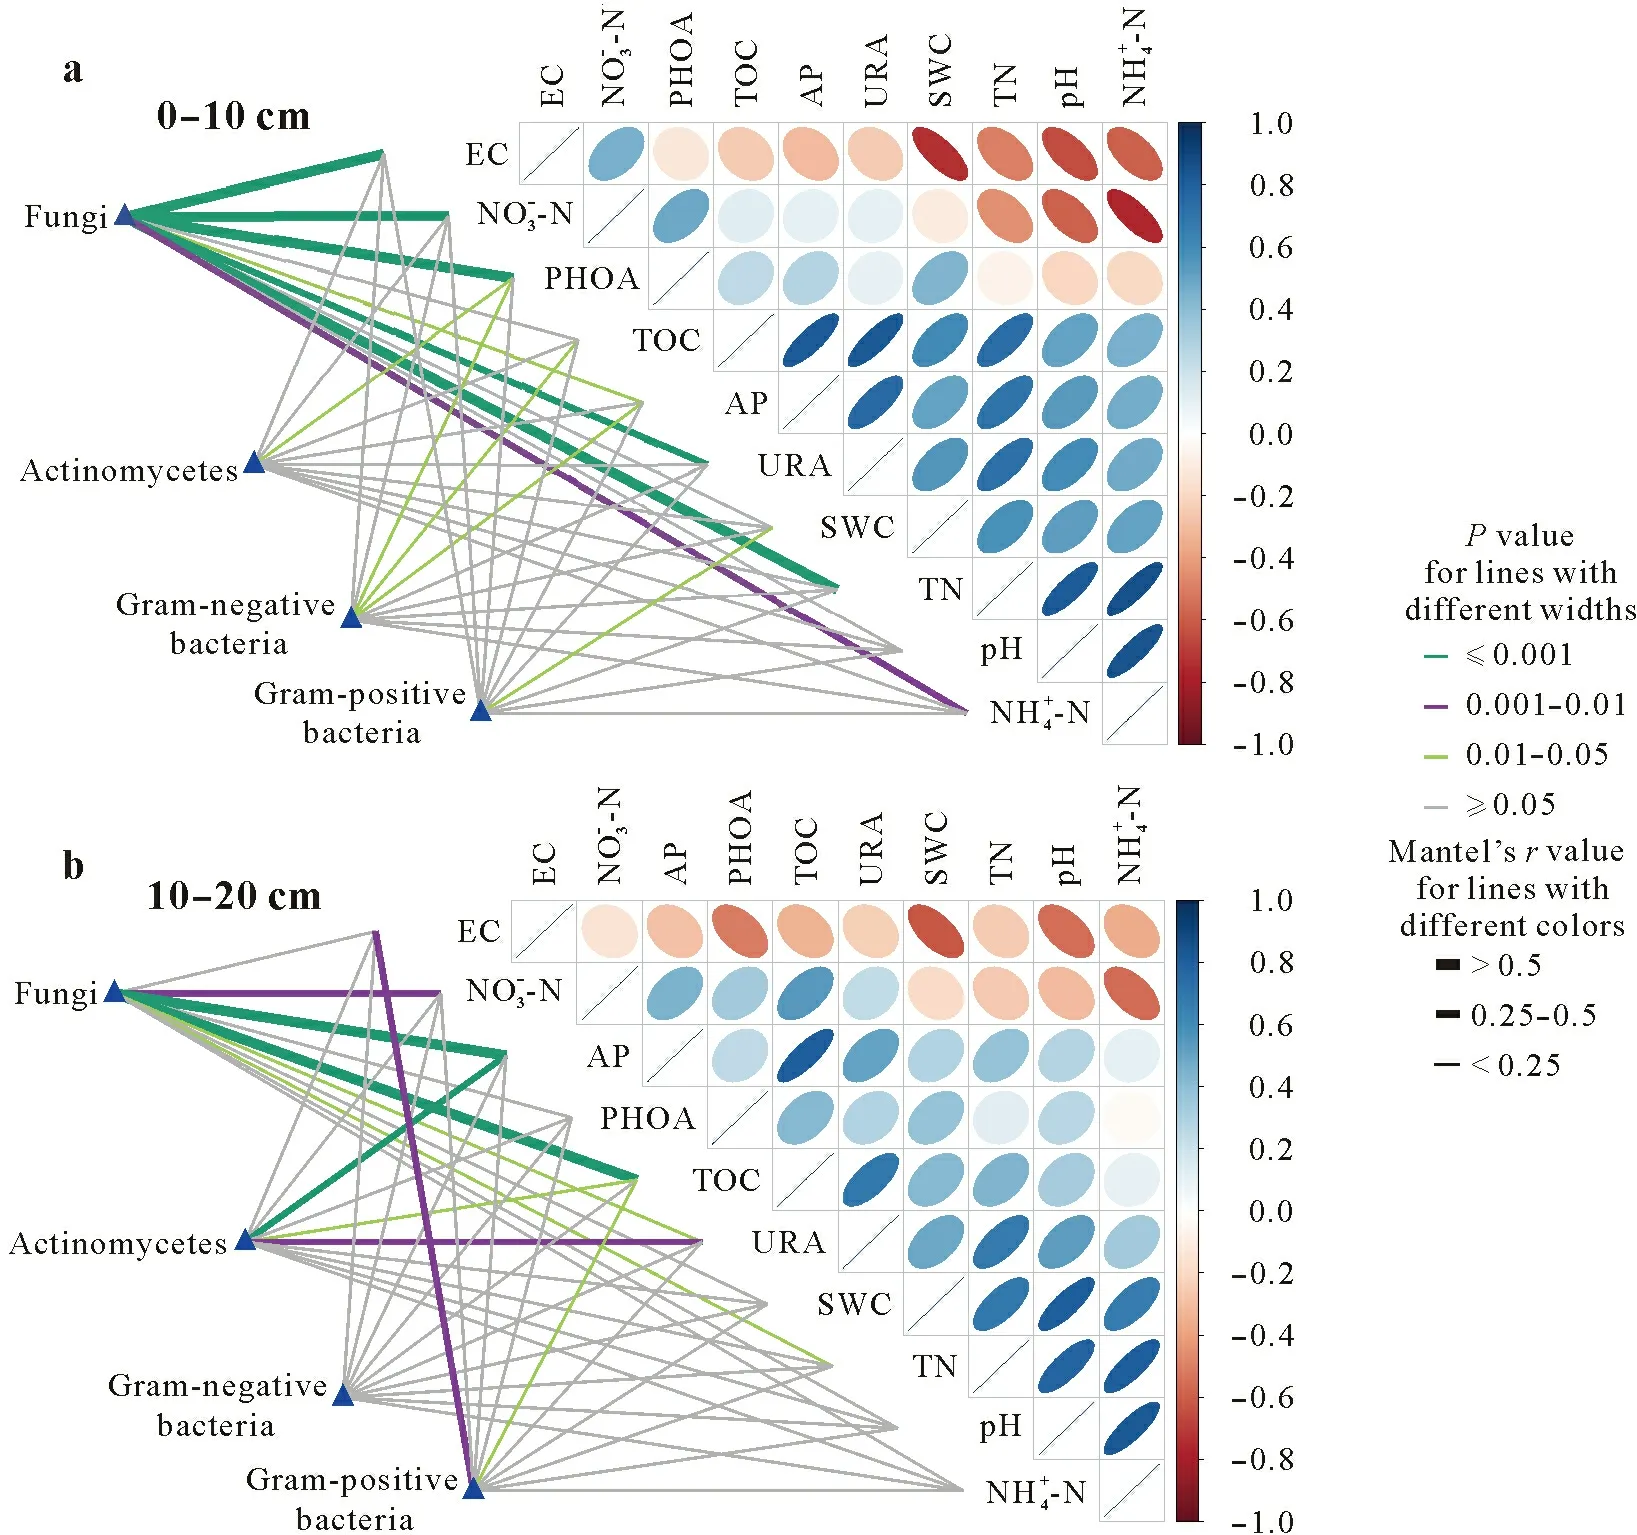
Fig.4 Pairwise comparisons between environmental factors and microbial communities in the 0–10 cm(a)and 10–20 cm(b)soil layers by partial Mantel tests.Color gradients denote the strength of Spearman’s correlation coefficients,line edge widths correspond to the Mantel’s r statistic for the corresponding distance correlations,and edge colors denote the statistical significance(P value)based on 9 999 permutations.EC=electrical conductivity;PHOA=phosphatase activity;TOC=total organic C;AP=available P;URA=urease activity;SWC=soil water content;TN=total N.
Redundancy analysis showed that the contribution ofSWC and AP and PHO activities to microbial composition in the 0–10 cm soil layer was smaller than other environmental factors (Fig.5).Compared with the biochar treatments,soil nutrient content and enzyme activities were relatively low under 0%biochar addition.Ectomycorrhizal fungi were positively correlated with most environmental factors and maintained the strongest correlation with TOC.In 2017,the distribution of treatments was more concentrated in the 10–20 cm soil layer than in the 0–10 cm soil layer,indicating that biochar had less impact on the 10–20 cm soil layer in the first year(2017).However, the scattering degree of treatments got greater in 2018,indicating that biochar began to show its impact on the 10–20 cm soil layer in the second year (2018).Saprotrophic fungi and EC were positively correlated, but they were negatively correlated with other environmental factors.Among these factors, AP had the smallest contribution.

Fig.5 Redundancy analysis(RDA)ordination biplots of soil physicochemical properties and microbial communities in the 0–10 cm(a)and 10–20 cm(b)soil layers.Soil physicochemical properties and enzyme activities are represented by solid lines,and microorganism indicators are represented by dashed lines.TOC=total organic C;TN=total N;AP=available P;EC=electrical conductivity;SWC=soil water content;PHOA=phosphatase activity;URA=urease activity;Gn=gram-negative bacteria;Ab=Actinobacteria;Gp=gram-positive bacteria;Sf=saprotrophic fungi;Ef=ectomycorrhizal fungi;Mb=methanotrophic bacteria;An=anaerobic bacteria;Am=arbuscular mycorrhizal fungi.17-ck,17-c1,17-c2 and 17-c3 represent 0.0%,0.5%,1.0%and 2.0%biochar addition,respectively,in 2017;18-ck,18-c2,18-c2 and 18-c3 represent 0.0%,0.5%,1.0%and 2.0%,respectively,biochar addition in 2018.
DISCUSSION
Soil physicochemical properties and enzyme activities
Soil is an important natural reservoir of C and N,and the cycling of soil C and N is one of the most important functional processes of terrestrial ecosystem (Sedjo, 1993).Biochar addition significantly improved C and N accumulation in the degraded grassland.This study found that TOC and TN significantly increased with the application of biochar in different soil layers,and this increase got more significant with the increase of application amount and duration of biochar in soil.This may be partly related to the properties of biochar itself.Biochar is an exogenous substance rich in C,therefore it can increase soil C when it is applied to soil as C source(Wardleet al.,2008).However,the organic C from biochar itself did not fully explain the increase in soil organic C(Table I).Thus,at least part of the increase should be due to the effect of biochar addition on soil and vegetation.Abundant pore structure of biochar enables it to have higher surface energy and larger surface area(Moreiraet al.,2017).Organic molecules in soil are easily absorbed by biochar,which then forms organic matter through continuous polymerization(Steineret al., 2008).Biochar also has a special structure and properties that slow the decomposition of organic matter in soil,thereby favoring the accumulation of organic matter(Lairdet al.,2009;Lianget al.,2014).Biochar can stimulate the negative priming of soil organic C turnover(Joneset al.,2011).Moreover, biochar adsorbs a large number of extracellular enzymes on its surface,which separate it from the potential matrix.Biochar contains unstable soluble C,which provides another substrate for soil microbial communities.Lairdet al.(2010)found that the content of N significantly reduced in the soil filtrate when biochar was applied, and the trend became more prominent with the increase of the biochar application amount.In addition to its porosity and strong adsorption capacity, biochar addition also reduces soil bulk density,which is conducive to the fixation of N in soil to decrease N loss(Majoret al.,2010).Soil bulk density reduction will reduce the permeability of soil water,reduce the loss of N with water,and eventually lead to the increase of N content(Gallowayet al.,2008).Biochar porosity and strong adsorption capacity also increase the absorption of P and the capacity of soil water retention,and then increase the contents of AP and SWC(Sohiet al.,2010;Baiamonteet al.,2019).Our results were consistent with these findings.
Biochar had different effects on soil available N,such as NH+4-N and NO−3-N.In the first year after biochar application,NH+4-N in different soil layers decreased significantly with the increase of biochar application.Soil NO−3-N showed the opposite pattern.However,in the second year after the use of biochar,NH+4-N in both soil layers increased significantly with the increase of biochar application.This change wasprobably related to changes in soil microbial activity due to biochar application.Biochar changes soil microenvironment and increases gas permeability(Lehmannet al.,2006),while the activities of soil microorganisms are sensitive to these environmental changes(Kauret al.,2005).In the first year after biochar application,the nitrifying bacteria activity increased,and nitrification was enhanced,resulting in increased NO−3-N in soil(Jianget al.,2015).In the second year after biochar application,biochar was in full contact with soil,and a large number of organic functional groups(e.g.,–COO–,–COOH,–O–OH,etc.)contained in biochar can significantly increase soil pH by absorbing soil H+(Yuanet al.,2011).High soil pH could enhance mineralization and organic N conversion(Curtinet al.,1998).Studies have shown that biochar made at 500°C have better and stronger adsorption for NH+4-N than NO−3-N(Kameyamaet al.,2012).Therefore,when the functional groups absorbed H+in soil, a large number of NH+4-N was absorbed as well,which increased the content of NH+4-N.In addition,biochar has a higher cation exchangeable capacity, which not only increases the adsorption of NH+4-N,but also reduces its conversion to NO−3-N(Chenget al.,2006).This may explain why the NO−3-N was less in the second year than in the first year.
Soil enzymes are catalysts in soil, which are directly involved in the material cycling process of soil.They can be used as important biological indicators to characterize soil quality and the degree of matter and energy metabolism in soil(Dick,1984).Due to biochar sorption,the effect of biochar on soil enzymes is complicated.Sorption of the substrate to biochar can promote enzymatic reaction and improve the activities of soil enzymes.However, biochar can block the binding sites of enzymatic reactions,and thus prevent enzymatic reactions(Derenne and Largeau,2001;Czimczik and Masiello,2007;Lehmannet al.,2011).In this study,biochar significantly increased the activity of UR in both soil layers.With biochar,soil N content significantly increased, satisfying the urease N demand (Wanget al.,2015).Biochar also increases the enzyme activity related to N cycle and indirectly increases urease activity(Baileyet al.,2011).Alkaline phosphatase activity in soil did not increase significantly with biochar addition,possibly because biochar led to an increase in soil pH,exceeding the optimal range of alkaline phosphatase activity(Khadem and Raiesi,2019).
Soil microbial communities and their relationships with environmental factors
As an active index to evaluate soil health quality, soil microorganisms can sensitively reflect a series of small changes in soil ecosystem (Hungriaet al., 2009; Santoset al.,2012).In this short-term study,the addition of biochar increased the total microbial,bacterial and fungal biomasses.This might be because the abundant pore structures of biochar adsorb organic substances and some inorganic ions to provide the sufficient nutrition for the growth of microorganisms,but these small pores also allow microorganisms to attach to them as a good habitat(Lehmannet al.,2011;Farrellet al.,2013;Bammingeret al.,2014).However,increases in soil microbial biomass in this study were not as significant as those in cropland biochar experiments (Abujabhahet al.,2016;Zhanget al.,2018).This may be because the biochar was fully mixed with soil in cropland experiments,whereas in this study, biochar was added to the grassland through the combination of hole application and surface application based on the principle of not destroying the grassland as much as possible.Soil and biochar in the grassland were not fully mixed as in the above experiment, which led to a certain hysteresis in the increase of soil microorganisms compared with cropland biochar experiments,especially in the 10–20 cm soil layer.
Application of biochar directly affected soil microbial community structure.Chen J Het al.(2018) found that biochar had selective effects on soil microbial community structure.In our study,PCA analysis showed that saprophytic and ectomycorrhizal fungi had relatively large contributions in different soil layers,indicating that the addition of biochar positively affected the soil fungi.Biochar itself contains a small amount of substances that can be decomposed by microorganisms (Xuet al., 2018), so biochar application is equivalent to adding a small amount of abnormal litters into soil,which encourages the mass reproduction of saprophytic fungi.As the decomposition of these abnormal litter ends,a large number of nutrients absorbed by biochar can promote the formation of epiphytic mycelia and thus promote the propagation of ectomycorrhizal fungi(Goldmannet al.,2015).Higher content of ectomycorrhizal fungi in the second year than the first year in this study confirmed this development process.The increase of saprophytic fungi can accelerate the decomposition of organic matter in soil,and this process not only can increase the accumulation of soil C(Liuet al.,2018),but also can increase the soil nutrient content for vegetation uptake(Almonacidet al.,2015).Increased ectomycorrhizal fungi can enlarge the space of host plant nutrition absorption,and the extension of mycelium can absorb the nutrients from soil and litter layer(Phillipset al.,2019).Methane-oxidizing bacteria are microorganisms that use methane as the main energy and C source(Kalyuzhnayaet al., 2015).We found that the methanotrophic bacterial biomass decreased with time following biochar application,which may lead to the limitation of the methane oxidation process in soil and eventually lead to the accumulation of methane in soil.
Biochar not only directly affected changes in soil microbes and physicochemical properties,but also indirectly affected the interactions between them to some extent.Xuet al.(2014)reported that microbial community structure changed with the variations of soil physicochemical properties.Through RDA of soil physicochemical properties and indicator microbes, we found that pH,NH+4, NO−3-N and UR activity in the 0–10 cm soil layer had relatively large influences on microbial community structure,and ectomycorrhizal fungi was positively correlated with most of the soil physicochemical properties.In the 10–20 cm soil layer,pH,SWC,NH+4-N and UR activity had relatively large influences on the microbial community structure.These findings were consistent with some previous studies(Amelootet al.,2013;Muhammadet al., 2014; Zhuet al., 2017) and indicated that even though biochar may not be an ideal C source for microbes due to its high chemical and thermal stability,but its porous structure, ability to absorb nutrients and water retention could provide habitats and nutrients for microbial growth,which have significant effect on microbial growth and relationships with other environmental factors(Lehmannet al.,2011).
CONCLUSIONS
Biochar addition had a significant positive effect on soil physicochemical properties and microorganisms in the degraded alpine grassland.Most of soil properties in the 0–20 cm layer,including TOC,TN,NH+4-N,NO−3-N,AP,SWC,UR activity and microbial biomass, increased with biochar additions.Moreover,biochar changed the structure and responses of different microbial communities.Relative biomasses of ectomycorrhizal fungi and arbuscular mycorrhizal fungi increased, while those of anaerobic bacteria,gram-negative bacteria, actinobacteria, saprophytic fungi and methanotrophic bacteria decreased.Furthermore,this effect was stronger in the 0–10 cm layer than in the 10–20 cm layer,increasing with the increase of biochar residence time.These results indicate that biochar can improve soil nutrition and microbial biomass of the degraded alpine grassland and could be used as a soil improvement material for degraded alpine grassland remediation.
ACKNOWLEDGEMENTS
This research was supported by Beijing Science and Technology Plan,China(No.Z181100009618031),the National Natural Science Foundation of China(No.41771255),the National Key Research and Development Program of China(Nos.2016YFC0501902 and 2018YFF0213405)and the Key Science and Technology Project of Qinghai Province,China(No.2018-NK-A2).We gratefully acknowledge Mr.Ruiqi Wang(Department of Water and soil Science,China Agricultural University)and Ms.Ning Li(College of Grassland Science and Technology,China Agricultural University)for their assistance in the field.
杂志排行
Pedosphere的其它文章
- Variability in pattern and hydrogen isotope composition(δ2H)of long-chain n-alkanes of surface soils and its relations to climate and vegetation characteristics:A meta-analysis
- Synergy of remotely sensed data in spatiotemporal dynamic modeling of the crop and cover management factor
- Heterotrophy-coordinated diazotrophy is associated with significant changes of rare taxa in soil microbiome
- Impact of drilling waste pollution on land cover in a high subarctic forest-tundra zone
- Net ecosystem carbon exchange for Bermuda grass growing in mesocosms as affected by irrigation frequency
- Co-inoculation of indigenous Pseudomonas oryzihabitans and Bradyrhizobium sp.modulates the growth,symbiotic efficacy,nutrient acquisition,and grain yield of soybean
