Application of GC-qqqMS/MS in Gasoline Grades and Regions Identification
2022-04-14WangXinZhangGuannanZhuJunWanYifuJiangHongLiuZhanfang
Wang Xin; Zhang Guannan; Zhu Jun; Wan Yifu; Jiang Hong; Liu Zhanfang
(1. People’s Public Security University of China, Beijing 100038;2. Material Evidence Center of the Ministry of Public Security, Beijing 100038)
Abstract: Based on GC-qqqMS/MS, a qualitative and quantitative analysis method for identifying characteristic markers in gasoline samples was established. According to the established method, different grades (#92, #95, #98) of gasoline samples collected from different regions (southern, central, northeastern, and northwestern China) were studied and analyzed.The results show that the gasolines can be classified by the relative contents of aromatics, naphthalene series, indene and other characteristic substances. On the basis of the high sensitivity and selectivity of GC-qqqMS/MS, the experiment has identified the characteristic substances, and used the characteristic-ratios methods as well as stoichiometric tools to study the grades and regional differences of gasoline products. It is conducive to the identification and classification of ILR in public security in fire cases, and can also meet the actual handling demand.
Key words: GC-qqqMS/MS, gasoline, characteristic markers, identification and classification
1 Introduction
The detection and identification of Ignitable Liquid Residues (ILR) have always been a key topic in fire field research. At present, the main methods for identifying fire promoters include the gas chromatography-mass spectrometry (GC-MS), the comprehensive twodimensional gas chromatography-mass spectrometry(GC×GC-MS), the isotope ratio mass spectrometry(IRMS), the Fourier transform ion cyclotron resonance mass spectrometry (FT-ICRMS), the Raman spectroscopy,etc.[1-6]Among them, according to the guiding technical documents ASTM E1618 series of fire field research,GC-MS method is the most recognized identification method of ILR at home and abroad[7]. However, the actual identification mostly depends on the qualitative detection methods, and the accuracy and further research and the peer-aided judgment still need to be improved.A large number of domestic and foreign scholars explore quantitative analysis by introducing stoichiometric tools.Williams carried out a series of experiments on the ILR in the fire scenes, and he combined the experimental results with the Bayesian classification methods and the target factor analysis (TFA), and the identification rate of this interdisciplinary approach reached up to 75%-80%[8].Wang carried out a series of experiments on gasoline samples, used the Principal Components Analysis (PCA)to process the data, and classified them according to the Fisher linear discriminant method. The results showed that the accuracy of PCA combined with Fisher’s method was 100%[9]. Although chemometrics can make up for the lack of quantitative detection, it cannot confirm the characteristic markers that mainly affect the similarity or difference, so it has not been promoted in the actual handling of public security cases.
Gasoline is the most easily accessible ignitable liquid in daily life, and is often used as an important indicator of the qualitative analysis of arson cases. Octane number is often used to measure the quality of gasoline and reflect the antiknock performance of gasoline. At present, the model value of commercial gasoline is determined by the research octane number (RON) in China’s national standard for automotive gasoline[10]. The #92 and #95 gasoline grades are the main gasoline products produced at refineries, while the #98 grade is a premium gasoline product. The #89 grade is basically no longer produced.There are many factors affecting the accuracy of octane number in the determination, which are not easy to control effectively. In the course of gasoline production,in order to control the quality of gasoline, some additives are often added to improve the octane number. However,due to different grades of raw materials produced in different regions, as well as different processing conditions and process schemes, the relative contents of various substances in the product gasoline available for sale will also be different. The GC-qqqMS/MS is an ideal method for trace analysis of multicomponents in complex samples because of its strong anti-interference ability and high sensitivity. The principle is to isolate the characteristic parent ions by monitoring MS1 and MS2 in multiple reaction modes, and to generate the corresponding characteristic sub ions after collisions in the collision chamber. The secondary mass spectrum is obtained by detecting the sub ions, so as to realize the correspondence between the characteristic parent ions and the sub ions and effectively reduce the background noise value. At present, the GC-qqqMS/MS has been widely used in the fields of food safety, environmental analysis and drug detection[11]. Therefore, we have proposed a method to identify different grades of gasoline samples collected from different regions by GC-qqqMS/MS. This method has been based on the extraction and analysis of characteristic markers in gasoline samples. In our previous study, the GC-MS characteristic peak used for comparison of gasoline grades has been built by computer software[12]. According to the analysis of total ion chromatography (TIC) and elected ion chromatography(EIC) spectra, a variety of relatively stable characteristic substances such as aromatics, naphthalene series, and indene have been determined. In this paper, four groups of gasoline samples collected from different regions(southern, central, northeastern, and northwestern China)making up of three different gasoline grades (#92, #95,and #98) were studied by the GC-qqqMS/MS multivariate statistical analysis. In line with the distribution and marker ratios, the gasoline samples and regions were identified and distinguished.
2 Experimental
2.1 Instruments
All obtained samples were analyzed using an Agilent Technologies 7010 Triple Quadrupole GC/MS. The system was operated in the electron impact mode (EI; 70 eV). The separation was achieved with a Thermo DBWAX column (30 mm×0.25 mm, with a film thickness of 0.25 µm). The injection port temperature was 280 °C, and each sample was injected at a split ratio of 1:20. The flow rate of quenching gas (He) was 4 mL/min, the flow rate of collision gas (N2) was 1.5 mL/min, and the solvent delay time was 2.05 min.
2.2 Experimental samples
More than 100 samples of #92, #95, and #98 gasoline samples were collected from major refineries in the southern, central, northeastern, and northwestern China.The source and regional information of some samples are shown in Table 1. The gasoline samples used in this work were diluted with ether to a concentration of 1%, and then were stored in the laboratory explosion-proof cabinet.
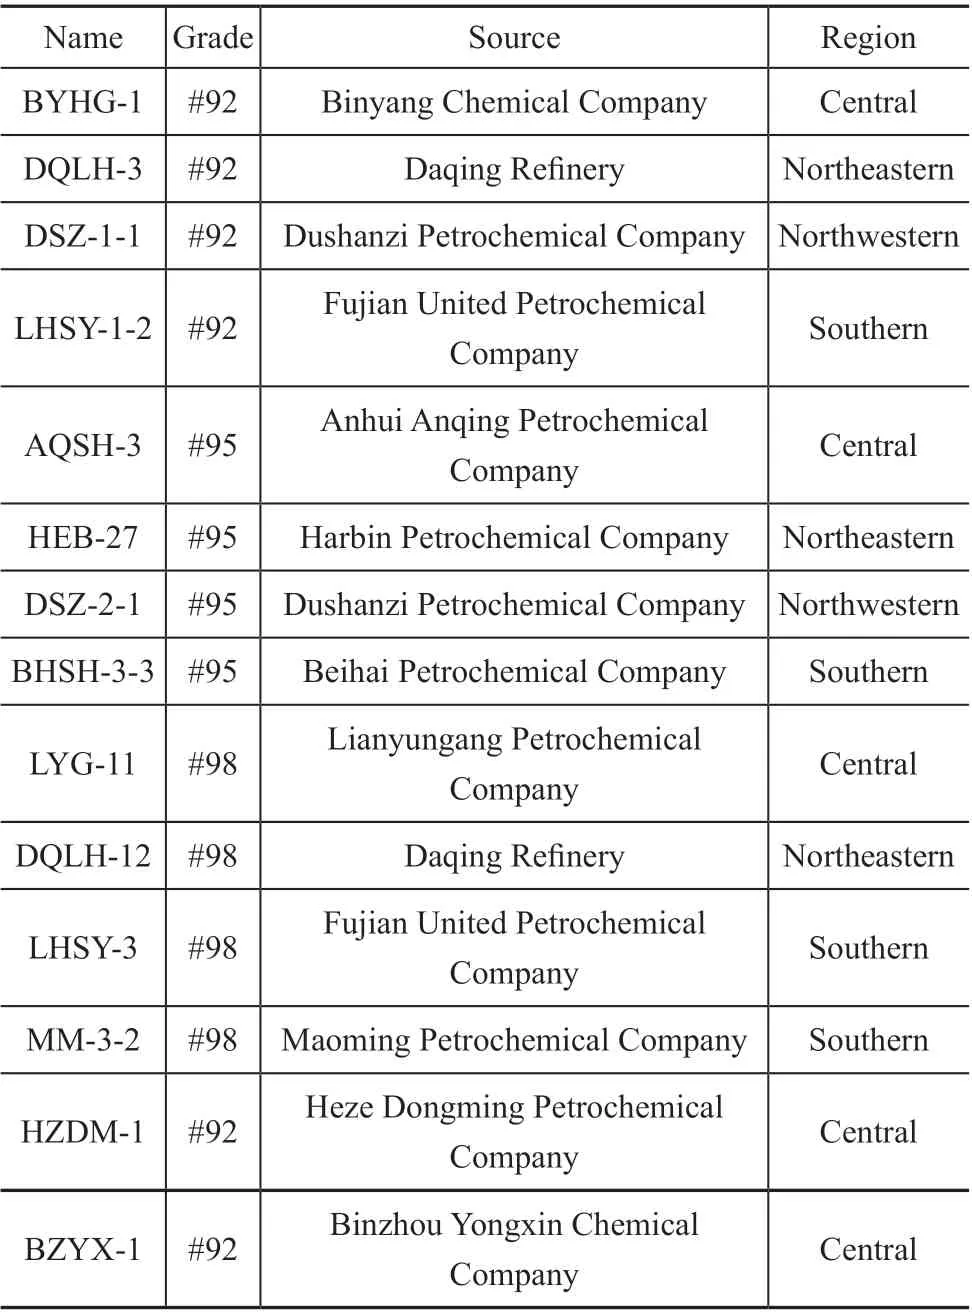
Table 1 Gasoline samples
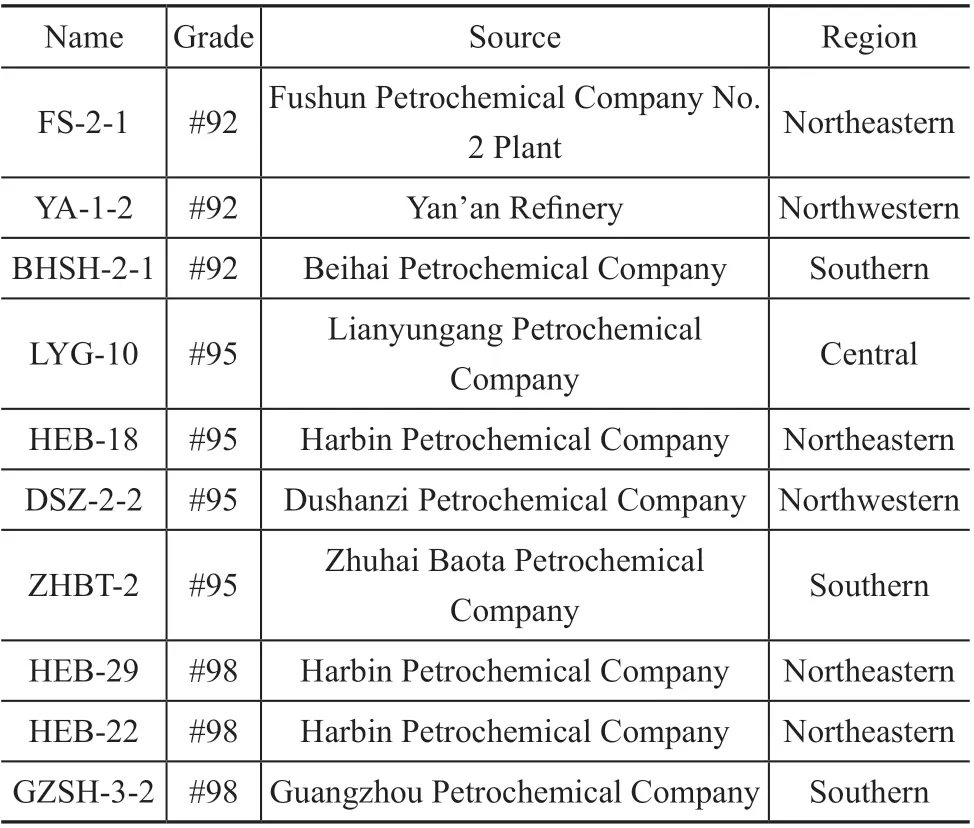
Table 1 Continued Gasoline samples
2.3 Analysis conditions
The GC oven temperature program used was 40 °C (to be held for 2 min), and was increased at a ramp rate of 5 °C/min to 80 °C (to be held for 2 min), and was finally increased at a ramp rate of 10 °C/min to 300 °C (to be held for 10 min).
The mass spectrometer was operated in the MRM mode in tandem with the MS detection. The characteristic markers in gasoline samples identified by EI/MS/MS are shown in Table 2.
3 Results and Discussion
3.1 Establishment of MRM mode
After tuning the instrument and setting the chromatographicparameters, the MS1 scan mode was created to obtain the TIC of mixed standard solutions of various characteristic markers. The MRM mode could detect and collisioninduce the selected specific parent ions by removing the interference of other product ions, so that only the selected specific product ions were collected for mass spectrometry signals. According to the fragment ions recorded under different CE values, the characteristic product ions with high abundance were selected. Propped up by keeping the ion source parameters unchanged and optimizing the impact voltage, the MRM method was finally established.The TIC diagram of mixed standard solutions of various characteristic markers is shown in Figure 1, while the mass spectrum parameters are shown in Table 2.
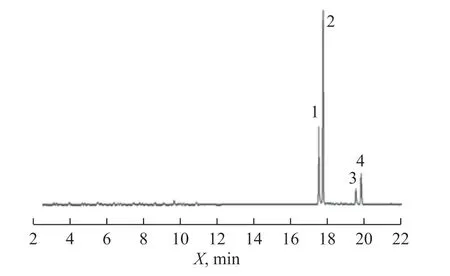
Figure 1 (a) TIC of naphthalene and methylnaphthalene
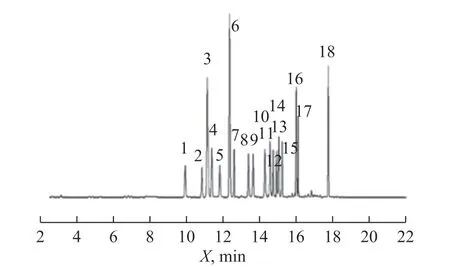
Figure 1 (b) TIC of trimethylbenzenes and tetramethylbenzenes
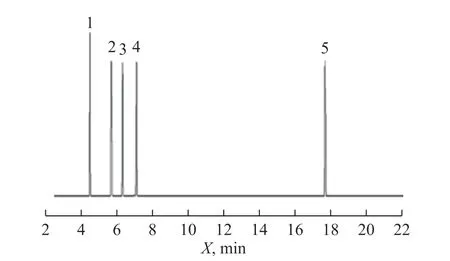
Figure 1 (c) TIC of naphthenes
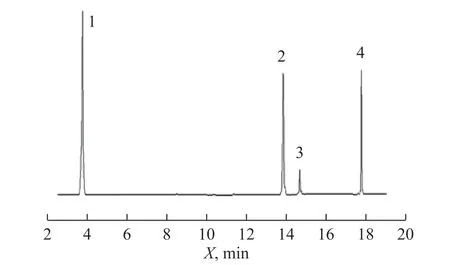
Figure 1 (d) TIC of MTBE and indene
3.2 Analysis results of different grades of gasoline samples by GC-qqqMS/MS
3.2.1 Analysis of distribution characteristics
In order to reduce the experimental error, dodecane was set as the internal standard, and the content of each characteristic substance relative to the internal standard was used as the analysis parameter. Figure 2 shows the relative content distribution of naphthenes, aromatics and indene in different gasoline samples.
It can be seen from Figure 2 that naphthenes, aromatics and indene are detected in three gasoline samples, but the relative contents of characteristic markers in different samples are significantly distinctive. In general, the contents of these three substances in #98, #92 and #95 gasoline samples increased accordingly. Nevertheless,with regard to the diagram on distribution of the relative content of naphthenic hydrocarbons in gasoline samples (Figure 2(a)), the relative content of naphthenic hydrocarbons in #92 gasoline was significantly higher than that in #95 and #98 gasoline products, which might be ascribed to the fact that the mass fraction of residue blending component was increased by increasing the mass fraction of naphthenic hydrocarbons or aromatics in the feedstock used in the actual gasoline production and treatment processes. In addition, in the process of hydrocracking, aromatic hydrocarbon hydrogenation will also produce naphthenes, which may also be one of the reasons for the relatively high content of naphthenes in #92 gasoline. In the distribution diagram of relative aromatic hydrocarbon content of gasoline samples(Figure 2(b)), the characteristic markers content of#95 gasoline identified in production and treatment processes were significantly higher than that of #92 and #98 gasoline samples. These olefins and alkanes are all potential sources of aromatic hydrocarbons. At the refineries, these olefins are converted into aromatic hydrocarbons through catalytic reactions (including cracking, polymerization, cyclization, dehydrogenation or hydrogen transfer), which can make full use of existing olefins to produce high value-added aromatic compounds, and can also be used to produce highoctane gasoline[13]. In the diagram on distribution of the relative content of indene in gasoline samples (Figure 2(c)), the relative content of indene in #98 gasoline is obviously less than that in #92 and #95 gasoline samples. The component content of indene is relatively stable, so it can be used as an effective reference index in the actual research and judgment of #98 gasoline quality.
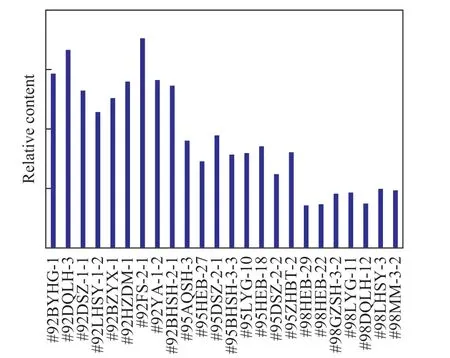
Figure 2 (a) Relative content distribution of naphthenic hydrocarbons in gasoline samples

Figure 2 (b) Relative content distribution of aromatic hydrocarbons in gasoline samples
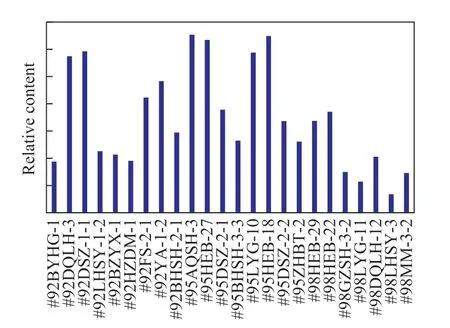
Figure 2 (c) Relative content distribution of indene in gasoline samples
3.2.2 Extraction and analysis of characteristic ratios in different gasoline samples
The characteristic-ratios method is a common research method in the field of petrochemical analysis[14-15]. In the above discussion, the differences in the distribution of the relative contents of the characteristic substances have been presented. However, as regards #92 and#95 gasolines with high similarity in the components distribution trend, the accurate judgment cannot be drawn by the relative contents alone. Therefore, the characteristic-ratios method has been introduced, with the selected difference data presented in Table 3.
It can be seen from Table 3 that the diagnostic ratios of naphthenes and indene in #95 gasoline were less than or equal to 1.2, while #92 and #98 gasoline samples had varied ratios depending on the regions from which these gasoline samples were collected. The ratios of propylbenzene to trimethylbenzene in #95 gasoline were less than or equal to 0.05, while these ratios in #92 and #98 gasolinesamples were generally greater than 0.05. Therefore,the #95 gasoline can be distinguished by comparing the ratios of naphthenes to indene and propylbenzene to trimethylbenzene. As for the #98 gasoline, the ratios of trimethylbenzene to tetramethylbenzene were greater than or equal to 10, and the ratios of naphthenic hydrocarbons to naphthalene were less than or equal to 1, However,these ratios in #92 and #98 gasoline samples were greatly affected by the regional factors in terms of the ratios of trimethylbenzene to tetramethylbenzene, while the ratios of naphthenic hydrocarbons to naphthalene were generally greater than 1, or even greater than 5. Therefore, the identification of #98 gasoline can be verified by the ratio of trimethylbenzene to tetramethylbenzene and the ratio of naphthene to naphthalene. Then for the #92 gasoline, the ratios of indene to MTBE are less than or equal to 1.2, the ratios of naphthalene to MTBE are less than or equal to 1,so #92 gasoline can be characterized by the ratios of these two items that are different from those of #95 and #98 gasoline samples.
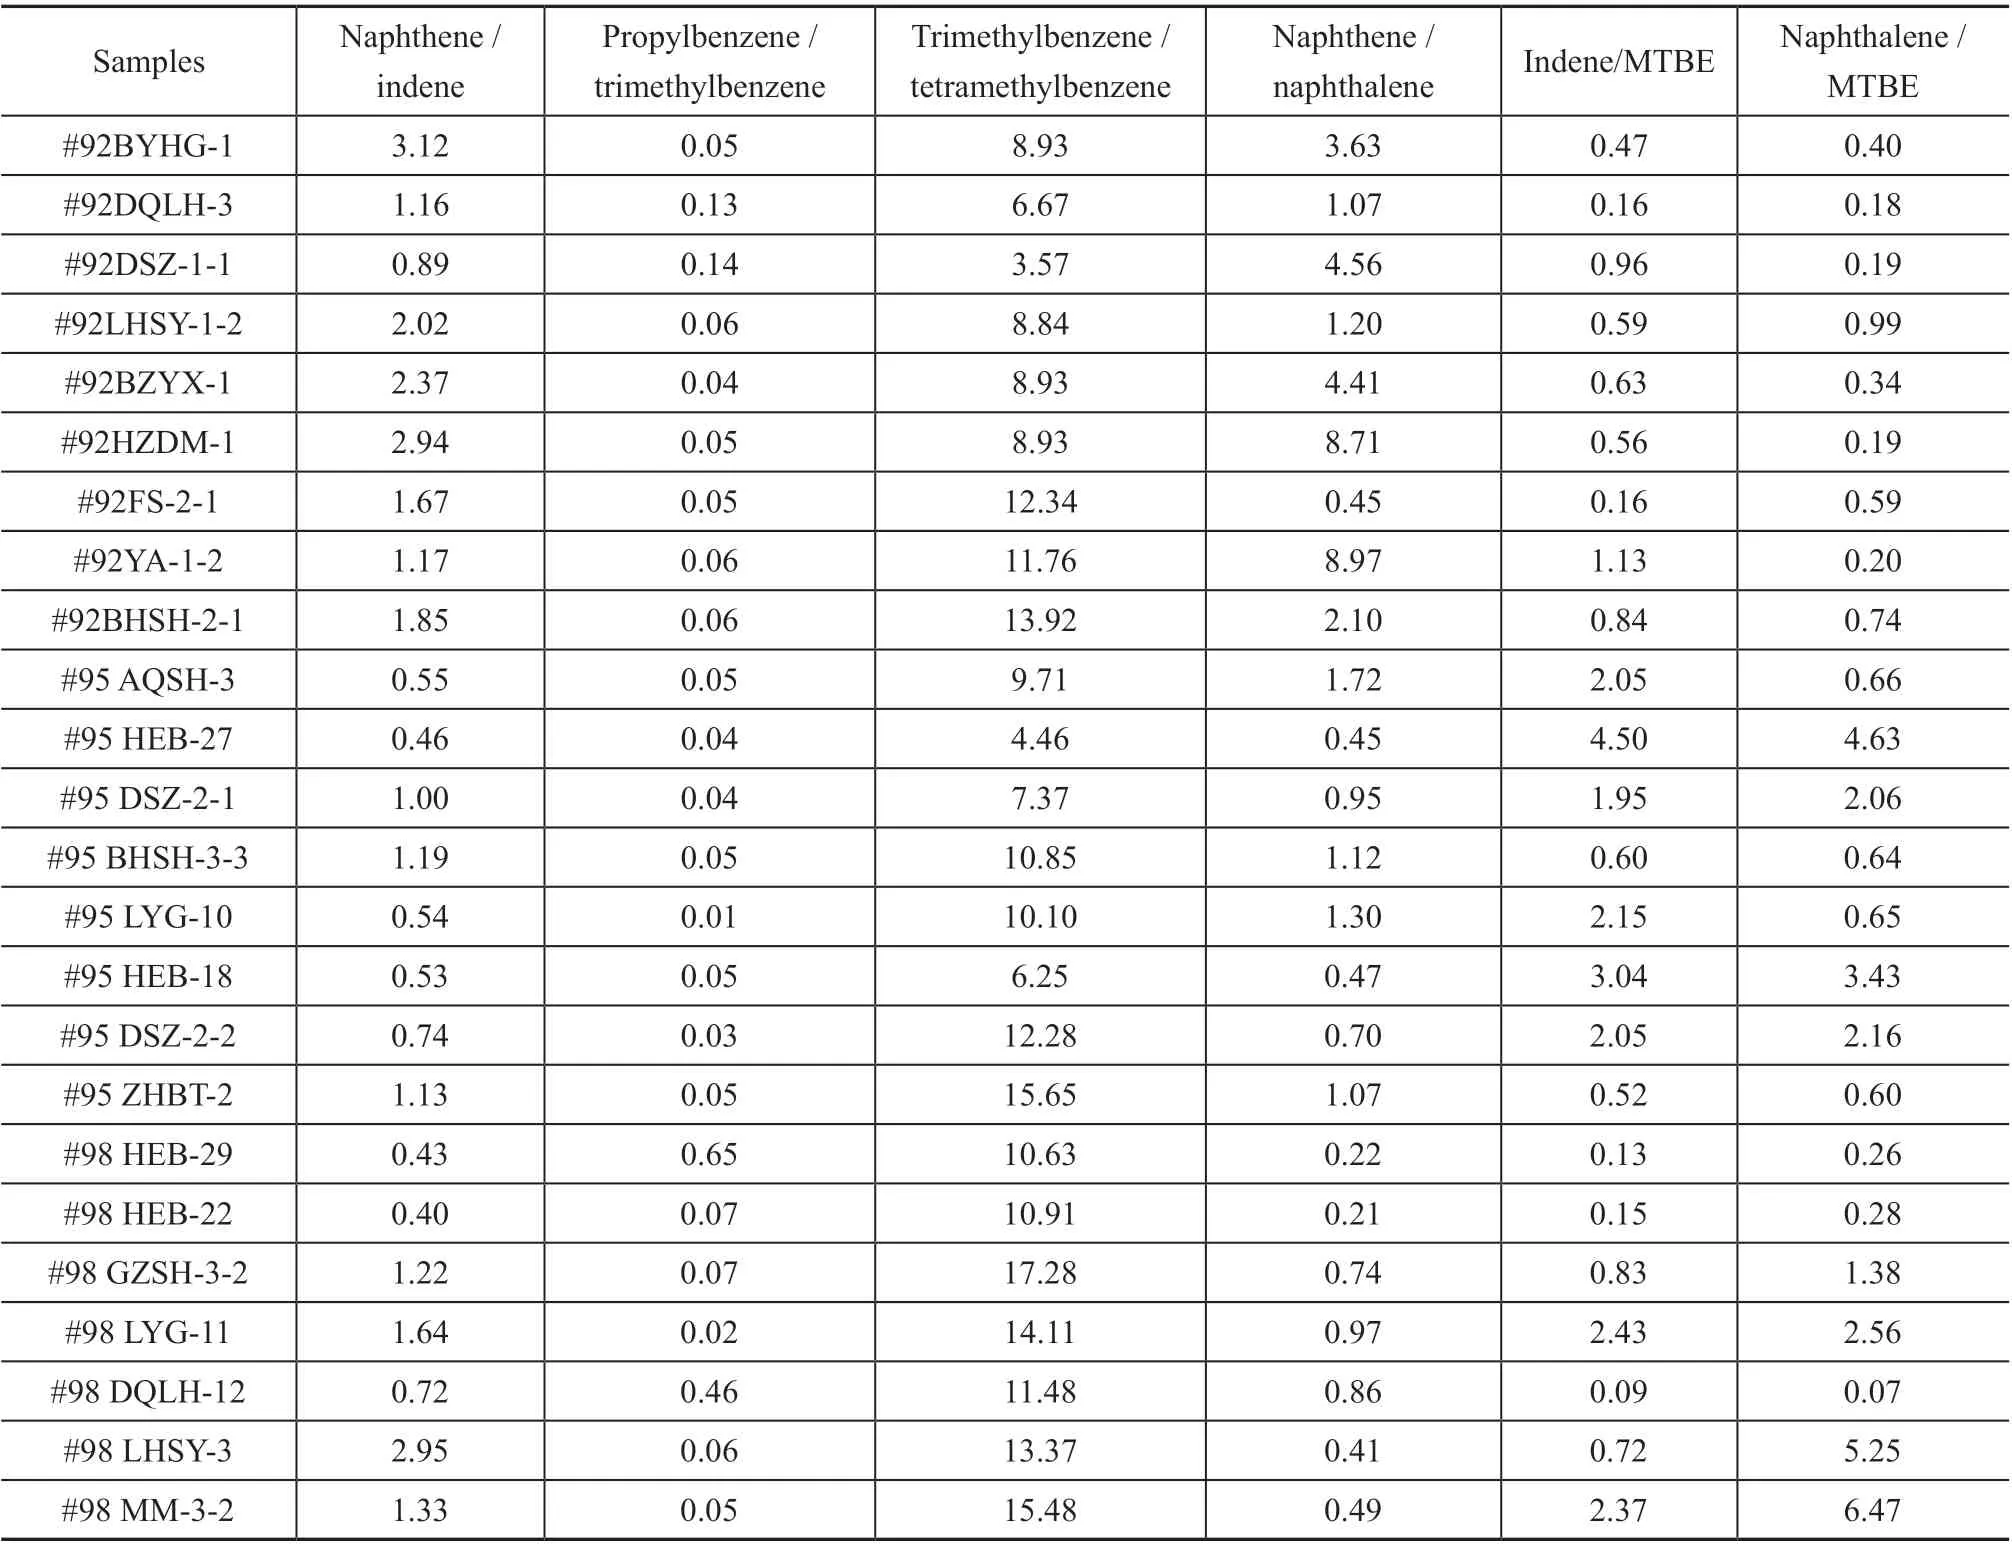
Table 3 Characteristic ratios of compounds in gasoline samples
3.2.3 Identification and analysis of different samples of gasoline using PLS
Partial least squares regression (PLS) is a widely applicable multivariate statistical analysis method which is produced and developed in recent years. PLS is a multidependent variable regression modeling method,when the number of observations is small and there are multiple correlations, and this method can simplify the data structure, and observe the correlation between variables or the similarity of sample points[16].
The marker ratios compared in 3.2.2 were brought into the partial least squares model to verify the similarity between the same grade of gasoline samples and the difference between different grades of gasoline, and the three-dimensional spatial distribution map was obtained,as shown in Figure 3.
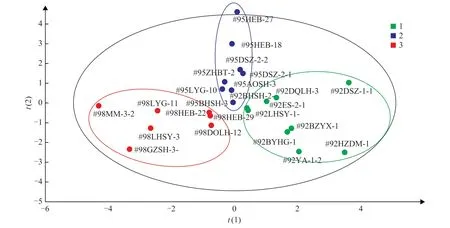
Figure 3 Spatial distribution of partial least squares method (1: #92 gasoline; 2: #95 gasoline; 3: #98 gasoline)
We can see that under the characteristic-ratios method,different grades of gasoline samples were well separated,and different grades of gasoline samples were accurately distinguished. However, it can also be found that in the same grade of gasoline samples, the gasoline samples collected from similar regions have the closer indexes, the different grades of gasoline samples also have regional influence on grade differentiation. Therefore, the gasoline samples from different regions were further studied.
3.3 Analysis of gasoline samples from different regions by GC-qqqMS/MS
In the process of crude oil formation, the precursors have different sources, evolution process and formation time in different regions, so the distribution of characteristic substances in gasoline samples collected from different regions has obvious difference. On the other hand, the post-processing conditions (temperature, pressure, catalyst activity, etc.) can affect the formation of compounds,which would also lead to the difference of components content in FCC gasoline.
3.3.1 Analysis of distribution characteristics
The content of each characteristic marker relative to internal standard was used as the analysis parameter to detect MRM of gasoline samples collected from different regions. Figure 4 shows the distribution of naphthalene,MTBE and indene in gasoline samples collected from southern, central, northeastern and northwestern China,and the specific sample information is shown in Table 1.It can be seen from Figure 4 that naphthalene, MTBE and indene were detected in gasoline samples, but the relative contents of characteristic markers in gasoline samples obtained from different sources were quite different. Figure 4(a) shows that the relative content of naphthalene in gasoline samples collected from central China were significantly lower than that from southern,northeastern, and northwestern China. The octane number can be increased by adding other additives. At the same time, it was also possible that the naphthalene content in the local crude oil was relatively high, which was related to the paleobiogeochemical background of the development of sedimentary organic matter, the thermal evolution history of organic matter, and the sedimentary environment[17]. In Figure 4 (b), the relative content of MTBE in gasoline samples showed that the amount of MTBE added in gasoline collected from southern China was significantly higher than that in gasoline collected from other regions. However, in line with the“Implementation plan on expanding the production of biofuel ethanol and promoting the use of vehicle ethanol gasolines” and the latest standard of vehicle ethanol gasolines[18]jointly formulated and released by the national 15 ministries and commissions, the processing measures for adopting MTBE in oxygenated organic compounds have been gradually banned. According to the amount of MTBE added, the differences of gasolines in different regions can be distinguished. In Figure 4(c), the relative content of indene in gasoline samples from northeastern China was significantly higher than that from other regions. This may occur, because the crude oil from Northeast China contained more indene or it was imported from Russia, which could be affected by the distance from the coastline or the terrain, so that the content of indene was distinctive from that of other origins. Therefore, the relative content of indene can provide ideas for analyzing and judging whether the residual gasoline samples were emanated from the gasoline in northeastern China.
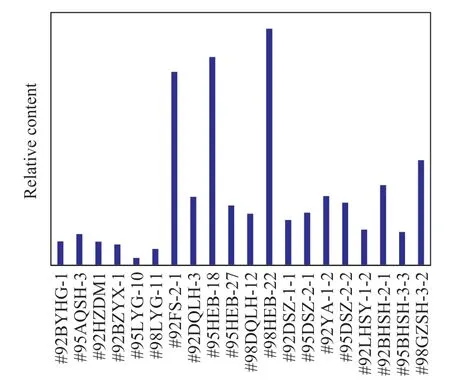
Figure 4 (a) Distribution of naphthalene content in gasoline samples
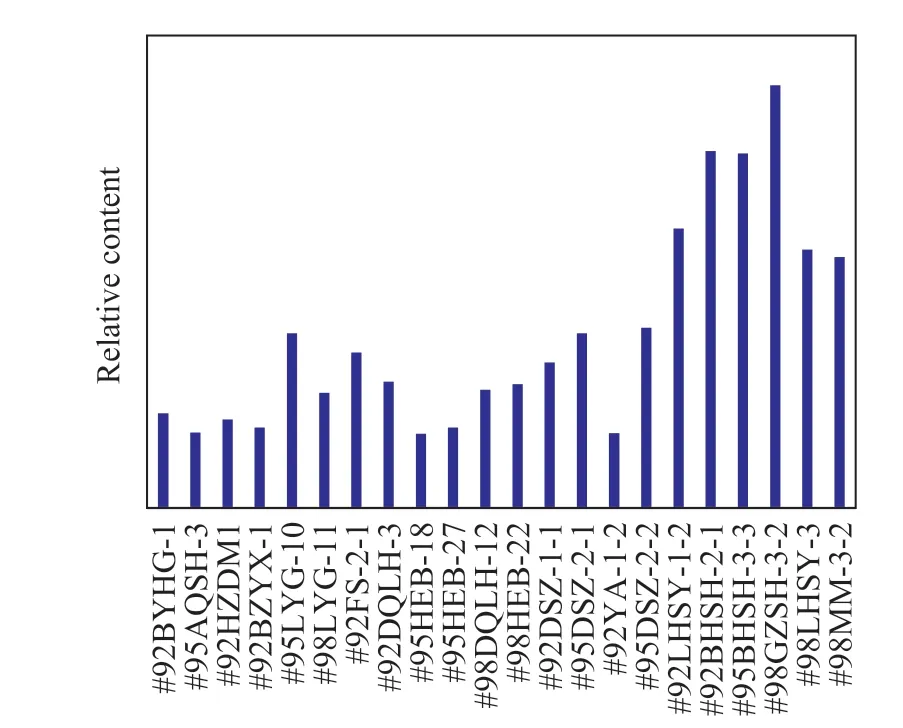
Figure 4 (b) Distribution of MTBE content in gasoline samples
3.3.2 Extraction and analysis of characteristic ratios in gasoline samples collected from different regions
Having analyzed the marker ratios such as trimethylbenzene, tetramethylbenzene, naphthalene,indene and MTBE, we got the conclusion that the ratio of total content of trimethylbenzene to tetramethylbenzene in northeastern China was close to 1, and there was nothing else as the basis for study and judgment.Then we selected the ratio of naphthene to indene,propylbenzene and trimethylbenzene, trimethylbenzene and tetramethylbenzene, naphthenic hydrocarbon to naphthalene, indene to MTBE, naphthalene and MTBE,naphthenic hydrocarbon and isooctane as seven groups of variables and classified the entire dataset using the partial least squares regression. Samples were divided into regions first, and the corresponding matrix generated by the model was analyzed, so that the similarities and differences between groups could be found.
3.3.3 Identification and analysis of different grades of gasoline using partial least squares method
The partial least square method discrimination model was established according to the method depicted in Section 3.3.2. The observation measurement is shown in Figure 5 according to the score in different dimensions. The samples collected from different regions have displayed better differentiation, which was feasible to distinguish the samples according to the characteristic ratios. In order to explore the main factors, the variable importance in projection (VIP)was analyzed. VIP value is based on the PLS cumulative weighting of the obtained variables, which is mainly used for variable screening. For the case of small sample with strong correlation among several independent variables, potential characteristic factors can be revealed[19]. The calculation method of VIP value is shown in Equation 1, where SSfis the sum of the standard deviation of the interpretation of thefcomponent, SStis the sum of the square of the response matrix, reflecting the cumulative interpretation ability of the factor to sample differentiation.Wifis the load weight of variableion thefcomponent,pis the total number of variablesi, andFis the assembly fraction[16].

In general, the VIP index value should be greater than 0.8.When it is less than this value, it can be considered that the independent variable’s explanation for the dependent variable is very weak and cannot be included in the PLS equation. The calculation results are shown in Figure 6. It can be found that variable 3, variable 4, variable 1, variable 7 and variable 2 were all greater than 0.8. The first three groups of variables were selected to construct a three-ratio recognition map, with the results shown in Figure 7. Except for the discrimination error of individual samples, 91.3%of the samples were regionally differentiated. The samples from the same regions were gathered, while samples from different regions were separated from each other. The results confirmed the effectiveness of the method.

Figure 5 Spatial distribution of partial least squares method (1: Central region; 2: Northeastern China; 3: Northwestern China; 4: Southern China)
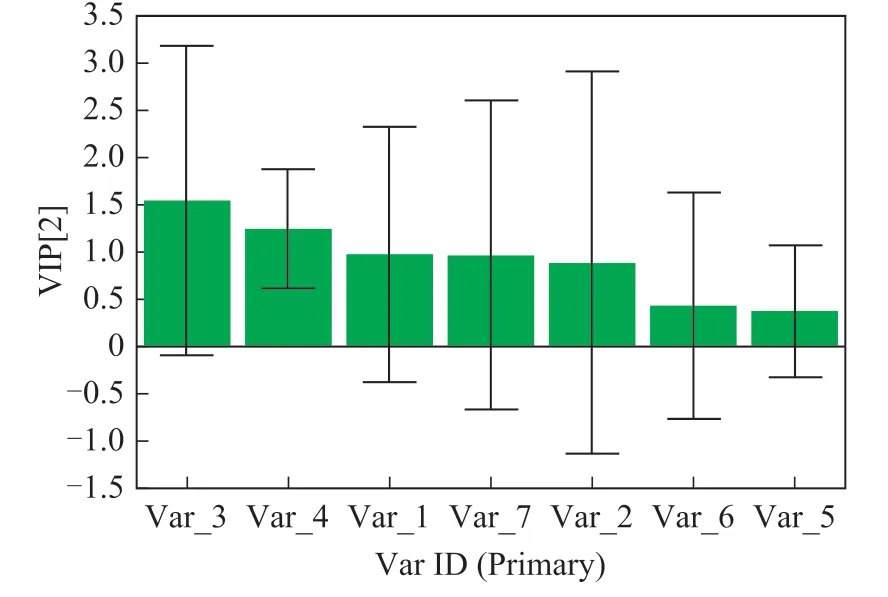
Figure 6 The index chart of variable projection importance
4 Conclusions
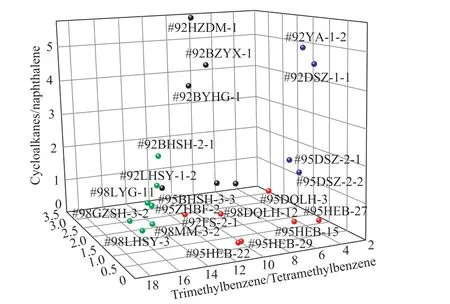
Figure 7 Three ratio identification diagram (Black: central region; Red: northeastern China; Blue: northwestern China; Green: southern China)
Based on GC-qqqMS/MS, the characteristic markers in gasoline were analyzed by the method of characteristicratios and stoichiometric tools. And the analysis method of gasoline samples from two dimensions of model and region was established. The following conclusions were obtained.
(1) Naphthene, aromatic hydrocarbons, indene, MTBE and other characteristic markers have been identified in all three grades of gasoline samples, but there are differences in the relative content of characteristic markers contained in different grades of gasoline samples. In terms of grade differentiation, the overall contents of characteristic markers contained in #98, #92 and #95 gasoline samples increase in turn. Among them, the relative content of naphthenic hydrocarbons in #92 gasoline was the highest,and the content of aromatic hydrocarbons in #95 gasoline was obviously prominent in #92 and #98 gasoline grades, and #98 gasoline contained the lowest relative concentration of indene. As regards the regional sources of gasoline, the relative content of naphthalene from the central region was lower than that of the gasoline samples from southern, northeastern, and northwestern China,while the gasoline samples from southern China showed that the MTBE content was significantly higher than that of gasoline from other regions. The relative content of indene in northeastern China was significantly higher than that of other regions.
(2) In terms of characteristic substances, there were differences in grades and regions between the same or different kinds of substances, which were reflected in the difference in characteristic ratios. Especially in the differentiation of grades, effective identification can be achieved by selecting and analyzing the appropriate relative content ratios.
(3) Combining with PLS, the feature ratio method can be used to verify the mathematical statistics, and the VIP can reveal the interpretation ability of the selected influencing factors. The combination of instrumental analysis method and chemical measuring tool further confirmed the distinction and analysis conclusion of gasoline samples of different grades collected from different regions.
Acknowledgments:This work was financially supported by the Technical Research Program of Ministry of Public Security of the People’s Republic of China (2016jsyjb09), the 13th Five-Year National Key Research and Development Project(2017yfc080804), and the Central-Level Basic Scientific Research Business Expenses Project (2021jb010).
杂志排行
中国炼油与石油化工的其它文章
- Study on Viscosity Reducing and Oil Displacement Agent for Water-Flooding Heavy Oil Reservoir
- Electrospinning Nanofiber Membrane Reinforced PVA Composite Hydrogel with Preferable Mechanical Performance for Oil-Water Separation
- Preparation of Solid Waste-Based Activated Carbon and Its Adsorption Mechanism for Toluene
- Antibacterial and Corrosion Inhibition Properties of SA-ZnO@ODA-GO@PU Super-Hydrophobic Coating in Circulating Cooling Water System
- Investigation of Nitrite Production Pathway in Integrated Partial Denitrification/Anammox Process via Isotope Labelling Technique and the Relevant Microbial Communities
- Heteroatom-Doped Carbon Spheres from FCC Slurry Oil as Anode Material for Lithium-Ion Battery
