A Test on High-Dimensional Intraclass Correlation Structure
2022-04-13
(School of Mathematics and Statistics,Henan University,Kaifeng 475004,China)
Abstract:The paper considers a high-dimensional likelihood ratio(LR)test on the intraclass correlation structure of the multivariate normal population.When the dimension p and sample size N satisfy N−1>p→∞,it is proved that the logarithmic LR statistic asymptotically obeys Gaussian distribution,and the explicit expressions of the mean and the variance are also obtained.The simulations demonstrate that our high-dimensional LR test method outperforms the traditional Chi-square approximation method or F-approximation method,and performs as efficient as the accurate high-dimensional Edgeworth expansion method and the more accurate high-dimensional Edgeworth expansion method in analyzing the intraclass covariance structure of highdimensional data.
Keywords:Likelihood ratio test;High-dimensional data;Intraclass correlation structure
§1.Introduction
The intraclass correlation coefficient firstly appeared in biostatistics,see,e.g.,Wilks[19],Donner and Koval[5]and Srivastava[18].The intraclass correlation coefficientρis often used to measure the degree of similarity among cluster or family members with respect to a specified biological characteristics such as blood pressure,weight,height,cholesterol level,etc.If we divide the population intosclusters,and denoteXij(i=1,2,···,s,j=1,2,···,p)to be the characteristic variables on thejth member of theith cluster,then we can write

which means the intraclass correlation coefficientρis just the ordinary correlation coefficient between two characteristic variablesXijandXikin the sameith cluster.
If we denote a random vector asξ=(Xi1,Xi2,···,Xip)′:=(ξ1,ξ2···,ξp)′,whose entries are the characteristic variable ofpmembers comes from the same cluster,then the covariance matrix ofξhas the covariance structure,V ar(ξj)=σ2,j=1,...,pandCov(ξi,ξj)=σ2ρ,i/=j∈{1,...,p},which is equivalent to that the covariance matrix ofξcan be written as

whereρandσ2being unspecified,Ipdenotes thep×pidentity matrix,1pis thep-variate vector whose elements are all 1.From the definition ofρ,we can see 0<ρ<1,which insures thatΣIis positive definite.This pattern of equal variance and equal covariance inξis usually referred to as the intraclass correlation structure,and it has become one of the popular issues in statistics.
The paper mainly concentrated on the test of whether a high-dimensional population X~Np(µ,Σ)has the intraclass correlation structure.In particular,under the assumption ofp→∞andN→∞,which means the dimension is allowed to diverge with the sample size,we will consider the hypothesis test

We will mainly adopt the likelihood ratio test method,and prove the logarithmic likelihood ratio statistic will be asymptotically Gaussian distributed.
Another motivation of the paper comes from high-dimensional data analysis.In many modern datasets,we often encounter the case that both the dimensionpand the sample sizeN=n+1 are very large,for example,financial data,consumer data,modern manufacturing data and multimedia data all have this feature.However,many traditional multivariate statistical methods including the chi-square approximation and theF-approximation,which are established under the assumption that the dimensionpis fixed,may not necessarily work in this case.So it is an important and interesting work to find some effective methods to deal with the high-dimension problems with bothpandNtend to infinity.Some results on this type of high-dimensional issues can be referred to Johnstone and Titterington[12],Donoho[6],Ledoit and Wolf[14],Cai and Shen[3],Fujikoshi et al.[7],Chen et al.[4]and Jiang et al.[10,11].
The rest of the paper is organized as follows.Section 2 introduces the main results,the asymptotic Gaussian distribution of the logarithmic LR statistics are established in two slightly different high-dimensional cases.In Section 3,we will give some tables and make some pictures to compare the performance of the proposed high-dimensional LR test method against other four test methods by simulations.The technical proofs of the main results are presented in Section 4.At last,we conclude the paper in Section 5.
§2.Main results
To testH0,we will first obtain a random sample ofNobservation vectors X1,···,XNfrom X.Denoten=N−1 and

LetΩbe the parameter space of(µ,Σ)andΩ0be the subset ofΩrestricted byH0.DenoteL(ω)to be the likelihood functions of X.According to Theorem 11.2.1 of Muirhead[15],we have
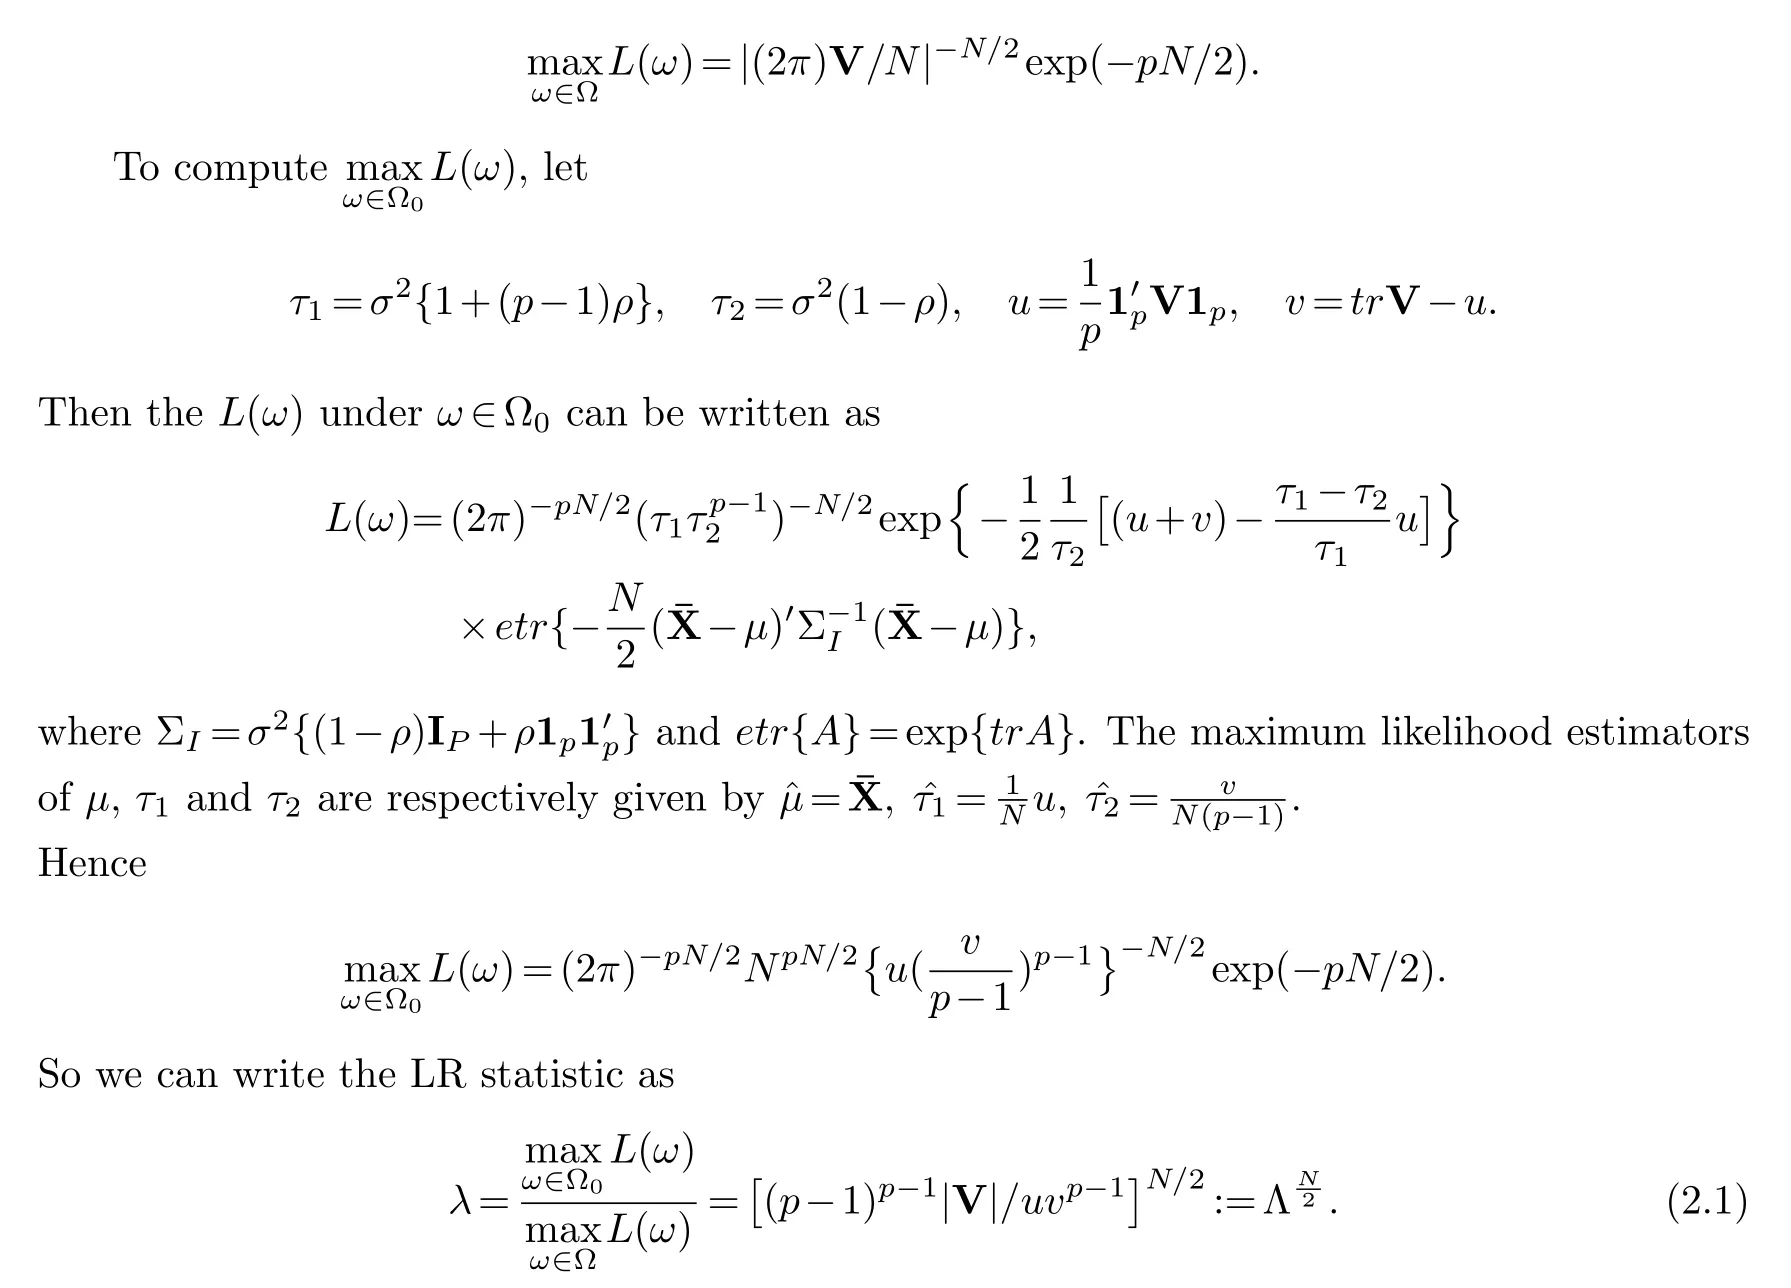
The distribution of the test statisticΛcan be studied through its moments.When the null hypothesisH0:Σ=ΣIis true,we have the following result(see Fujikoshi et al.[7]or Kato et al.[13]),
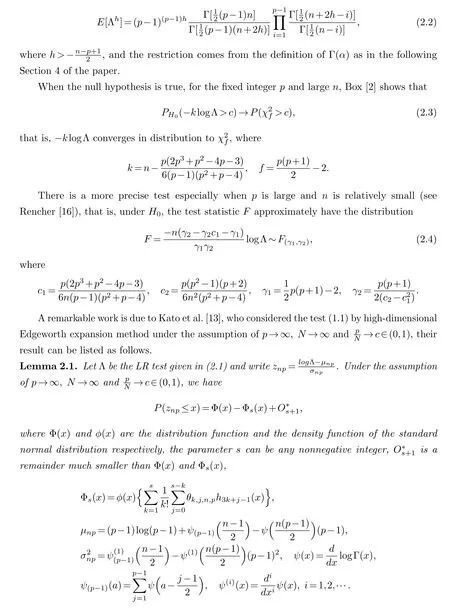
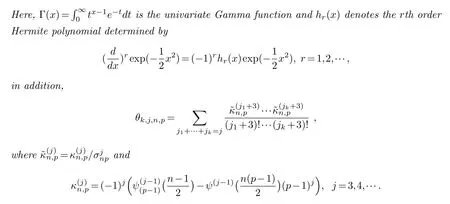
In this paper,we will revisit the test(1.1)under the assumption ofp→∞,N→∞.However,we will not requirepandNhave the same speed to tend to infinity,by virtue of the asymptotic expansion method of the Gamma function introduced by Jiang and Yang[11]and Jiang and Qi[10],the asymptotic Gaussian distribution of the logarithmic LR statistic will be obtained,and it will be referred as HLRT method in the sequel.One of the main result can be stated as follows.
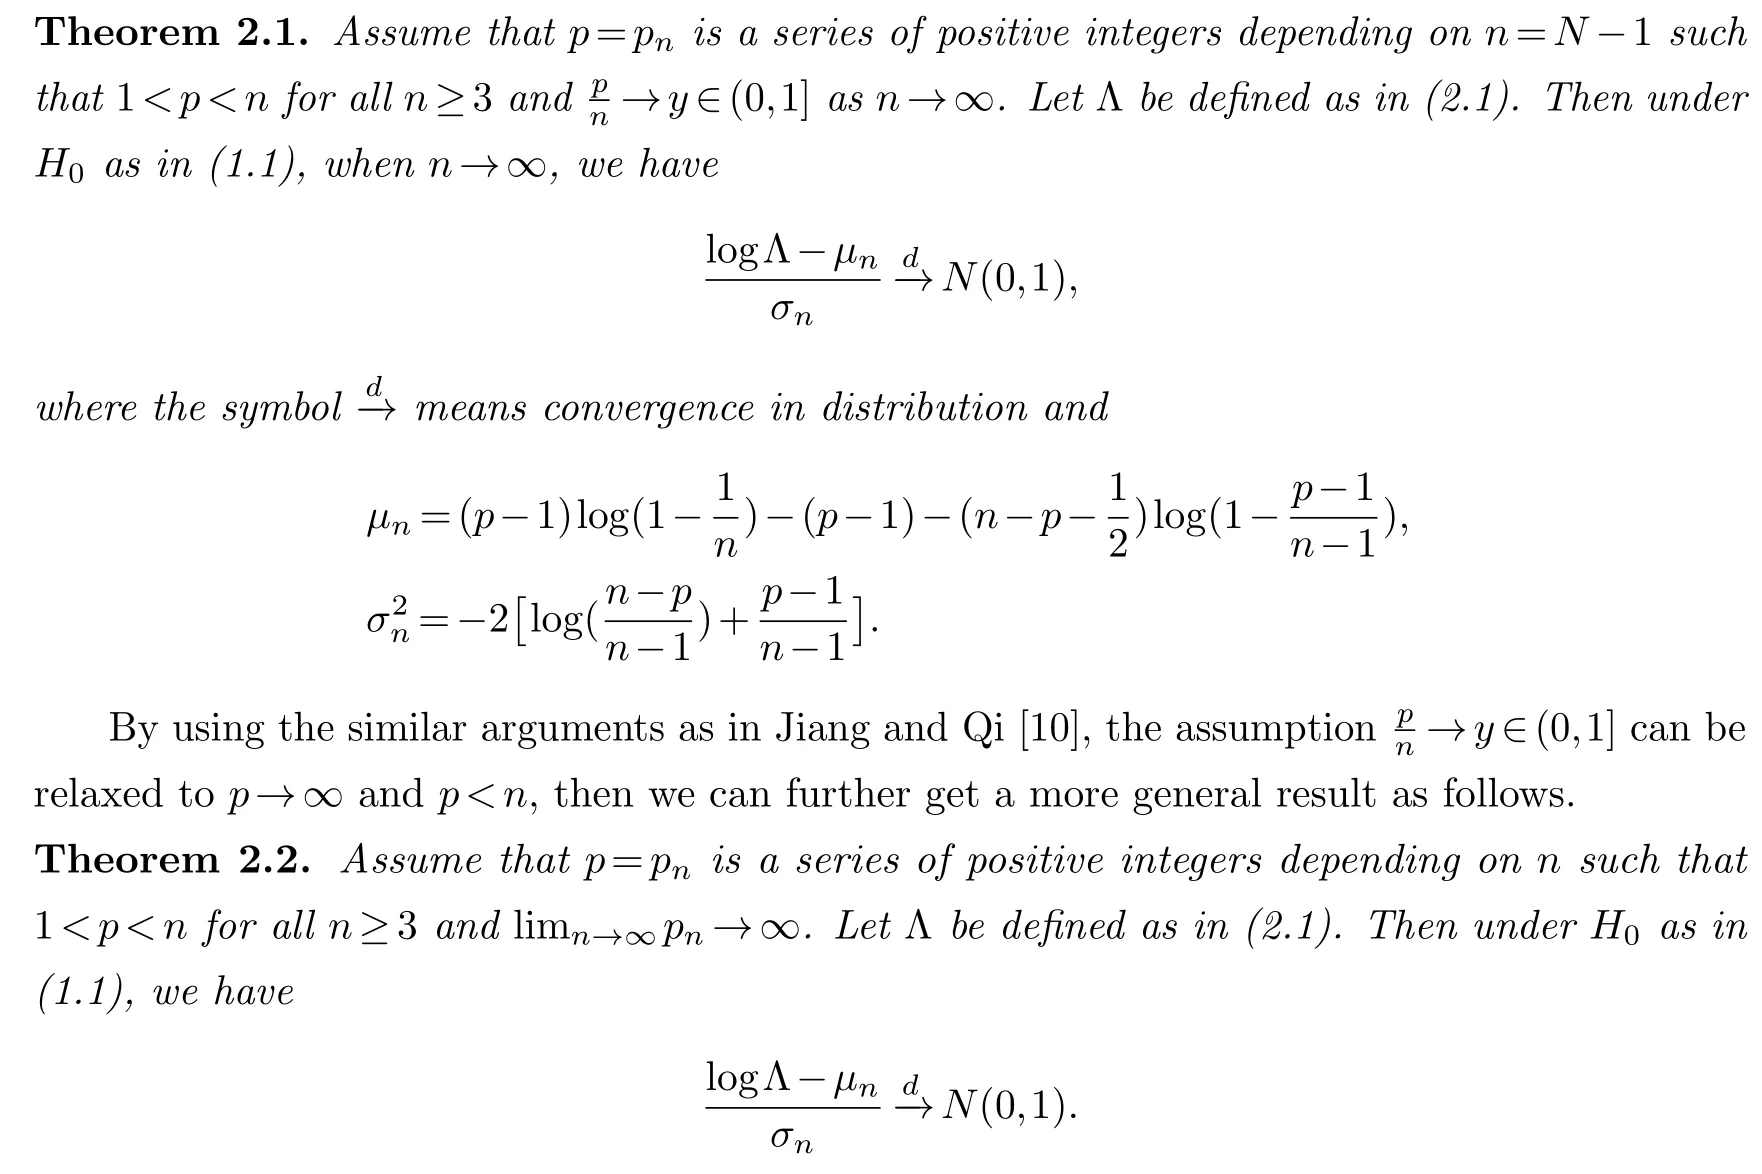
Remark 2.1.From the two results,we can see that Theorem 2.2 only need the dimension p,which has to be less than n,is large but not necessarily at the same scale of n,that is,the assumption on p and n is milder than that of Theorem 2.1.In this sense,the result of Theorem2.1 can be regarded as a special case of Theorem 2.2.However,the proof of Theorem 2.2 wil l rely on the result of Theorem 2.1,then both of them are meaningful in theory.
Remark 2.2.The assumption of Theorem 2.2 is milder than that of Lemma 2.1 in a mathematical sense.And the expressions of the mean and variance of the logarithmic likelihood ratio statistic in Theorem 2.2 are more concise than that of Lemma 2.1.
§3.Simulations
To show the efficiency of our method on dealing with the high-dimensional intraclass correlation structure test(1.1),some Monte Carlo simulations will be carried out.We will compare the performances of the following five methods,the first is the Chi-square approximation(BOX)method in(2.3),the second is the the F-approximation(F)method in(2.4),the third method is is the high-dimensional Edgeworth expansion method(HAE)with lettings=0 and Φ0(x)==0 in Lemma 2.1.When we takes=1 and=0 in Lemma 2.1,it will be more accurate than that we takes=0 andΦ0(x)==0,and we call it as the more accurate high-dimensional Edgeworth expansion method(AHAE).The last is our high-dimensional LR test method(HLRT)introduced in Theorem 2.2.
To investigate the empirical sizes of above methods,we will take the parameters in the intraclass correlation matrix asσ2=1,ρ=,µ=0p×1,andN=80 in the simulations.It should be mentioned that we only give the simulation results ofN=80 andpincrease from 5 to 75,because this region covers the tradition low-dimensional and high-dimensional area,and the simulations can show us the performance trend of the proposed methods whenpincrease from low dimension to high-dimension.
The empirical sizes of three methods under some nominal significance levels of 0.01,0.025,0.05 and 0.1 will be listed in Tables 3.1-3.5.In Figure 1,we will also plot five figures together to compare the efficiency of the five methods under different values of the significance level.All of the simulations are based on 10000 replicates.
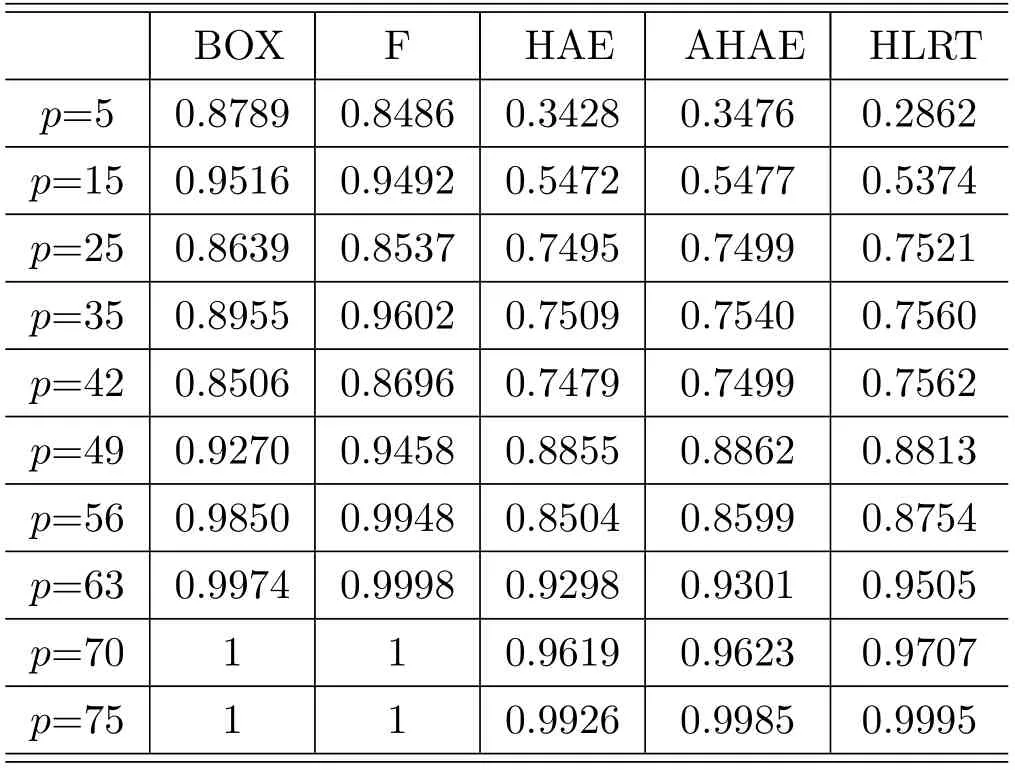
Table 3.6 Empirical powers of the five methods.
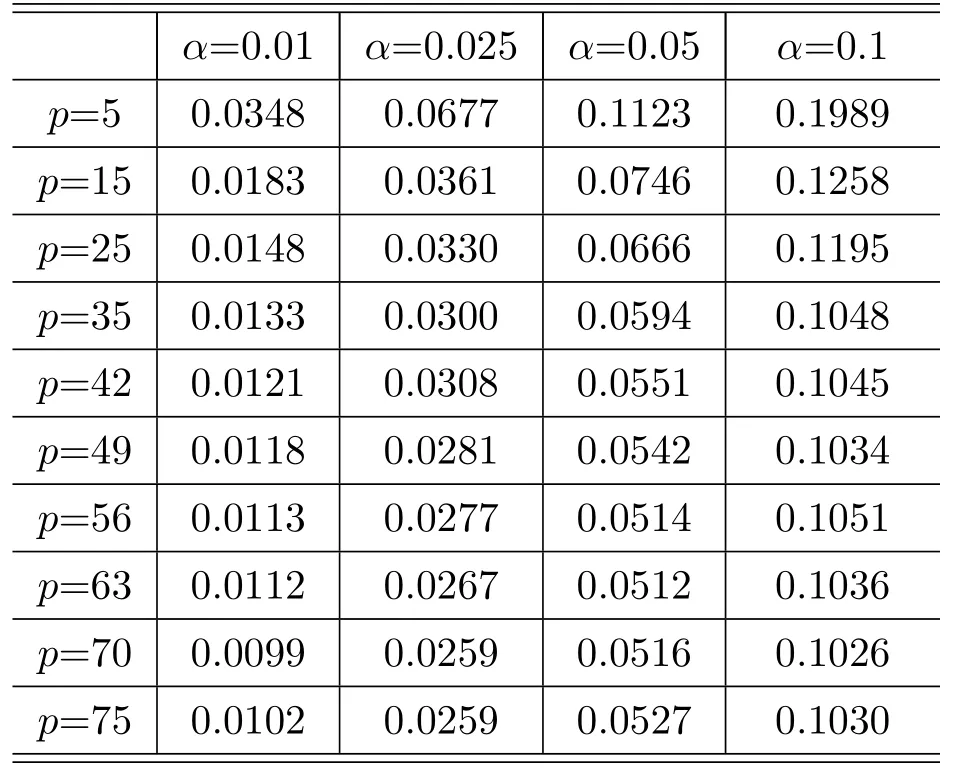
Table 3.5 Empirical sizes of our HLRT method.
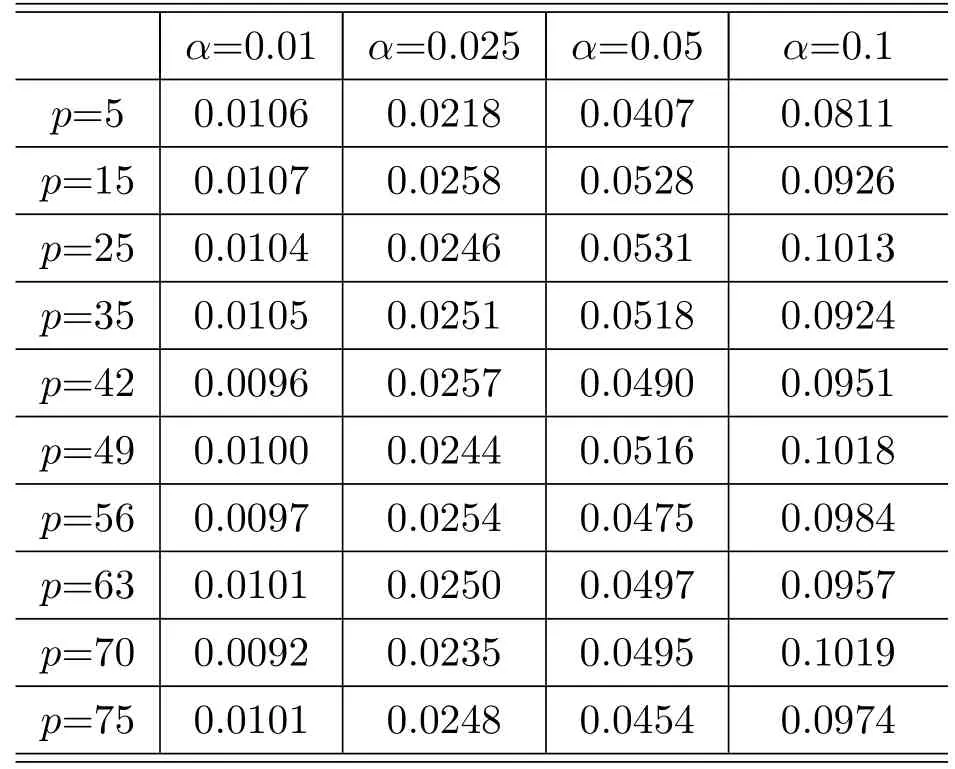
Table 3.4 Empirical sizes of the AHAE method.
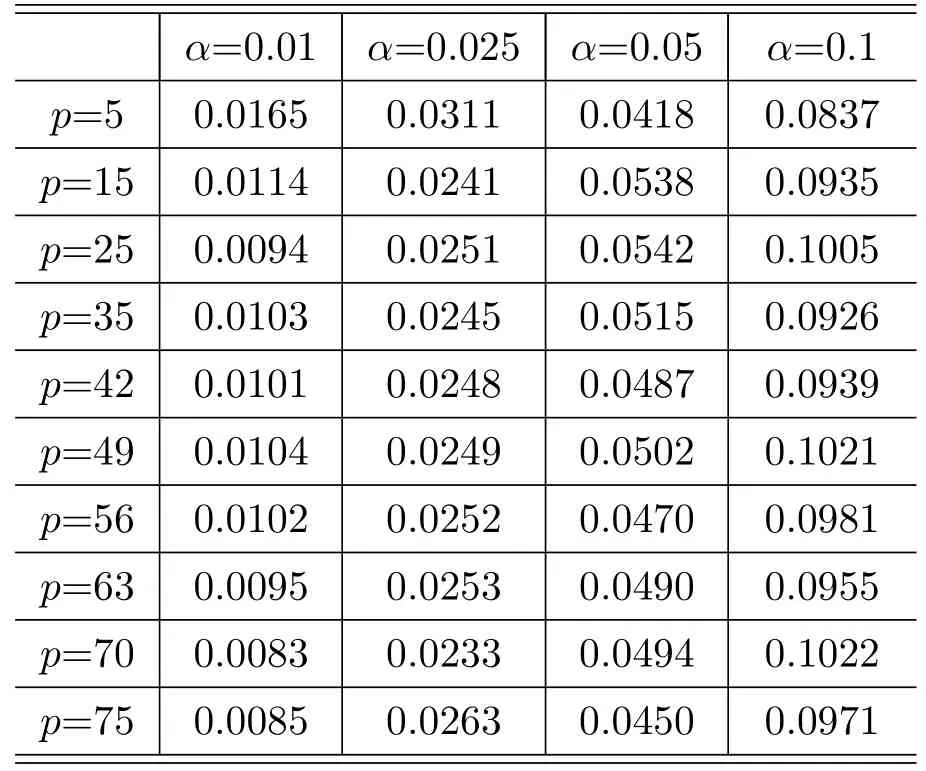
Table 3.3 Empirical sizes of the HAE method.
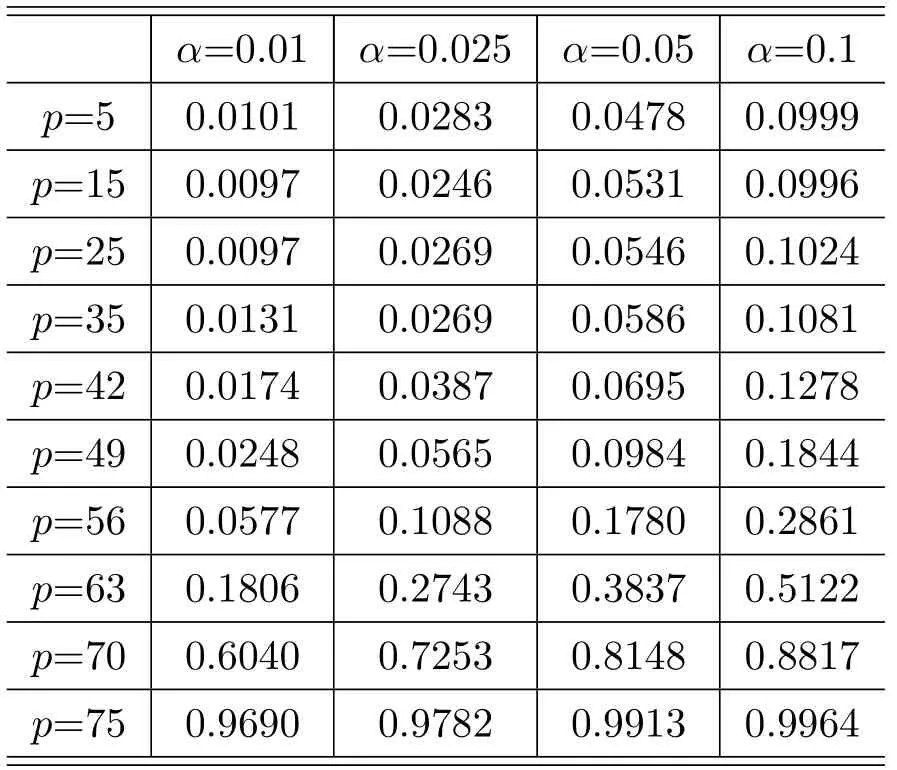
Table 3.2 Empirical sizes of the F method.
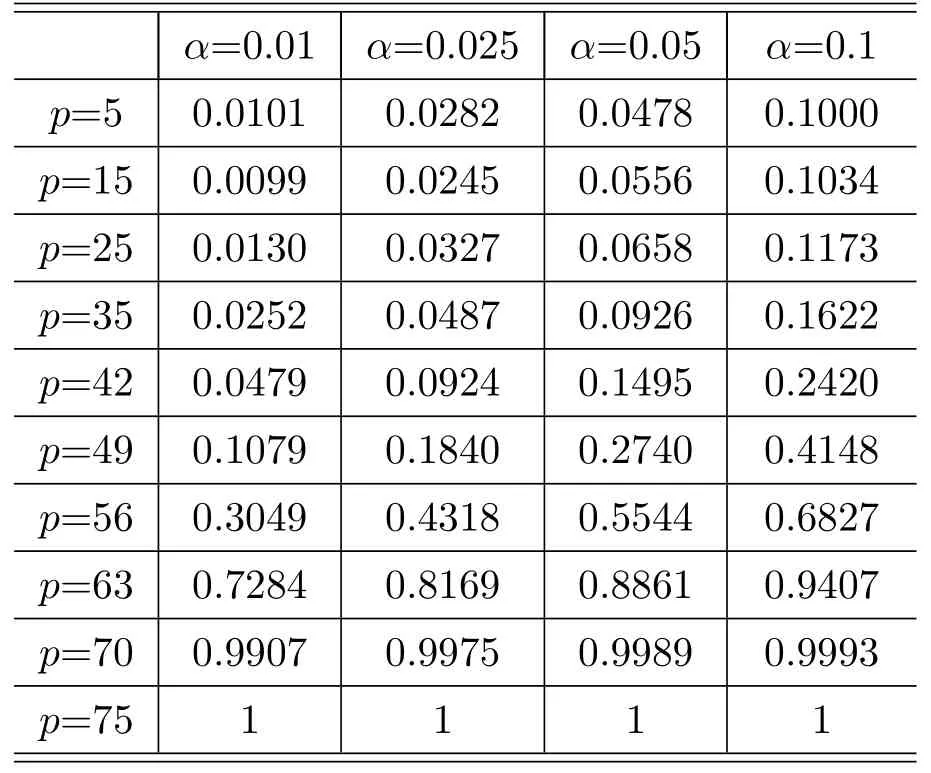
Table 3.1 Empirical sizes of the BOX method.
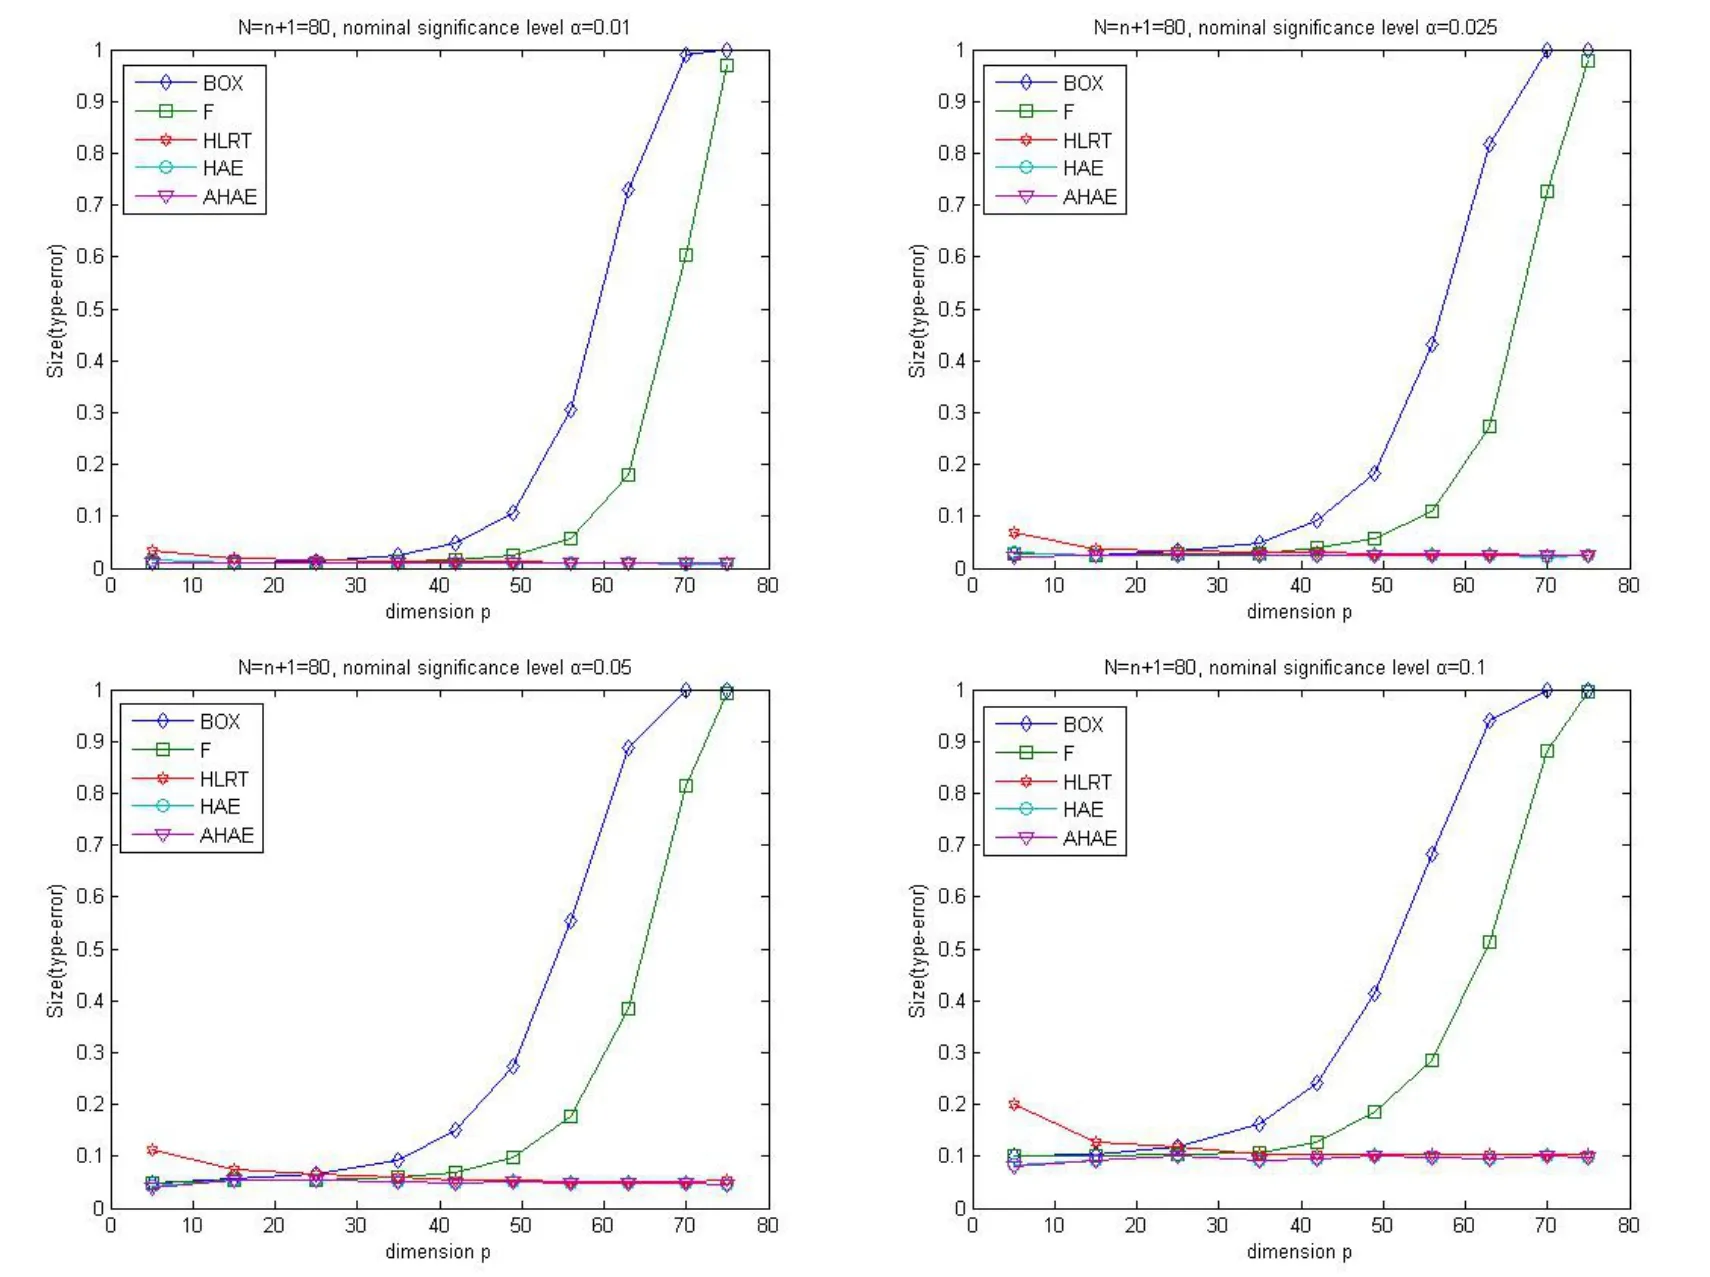
Fig.1 Sizes of LRT for intraclass covariance structure.
From the simulation results,we can see that in different settings of the significance level,when the dimensionpis small,the empirical sizes of the other four methods match the test significant level very well,and the performance of our HLRT method is poor.When the dimensionpbecoming large,the simulation shows that the F method performs better than the BOX method,and both of the two traditional BOX method and F method will rejectH0with a much higher probability,which is obviously larger than the significant level,which means that they are no longer efficient.However,when the the dimensionpis large(p>30),the sizes of the HAE method,the AHAE method and our HLRT method are very close to the significant level,which means the efficiency of the HAE method,the AHAE method and our HLRT method are better than the traditional BOX method and F method in high-dimensional case.
Furthermore,the simulations reveal that the sizes of the HAE method,the AHAE method and our HLRT method are all very close to the true significance level,and their differences are very small,then we can say that our HLRT performs as good as the HAE method and the AHAE method.
In fact,we also consider the simulations of more largepandN(p From the performance of the powers of the methods,we can see that for any size ofp,the powers of the Box method and F method are better than the HAE,AHAE and HLRT methods,especially whenpandNbecomes large,the powers of the HLRT method are increase and close to 1.In fact,the failure of the test(the values of the empirical size are too high)is the reason why the powers of two traditional BOX method and F method do better than others in these cases.As for the HAE,AHAE and HLRT methods,we know that whenpis small,our HLRT meothod is not as good as the HAE and AHAE methods,while whenpis large(p>50),our HLRT methods is as good as,even slightly better than the other two methods. From all the above simulations,we can say that the proposed HLRT method is not as well behaved as other methods when the dimensionpis small,while in the high-dimensional case of that bothNandpare large,our HLRT method outperforms the traditional methods and performs as efficient as the HAE method and the AHAE method in analyzing the intraclass correlation structure test of normal vectors. We will present the proofs of Theorems 2.1 and 2.2 in this section. The proof of Theorem 2.1 will mainly adopt the asymptotic expansion method of multivariate Gamma functionΓp(α)introduced by Jiang and Yang[11].To prove the result,we will first introduce the definition of the multivariate Gamma function. Definition 4.1.The multivariate Gamma function,denoted byΓp(α),is defined to be The definition of multivariate Gamma function is a generalization of the univariate Gamma function.In particular,whenp=1,(4.1)is the definition of a univariate Gamma functionΓ(·)on the complex space A useful result in Theorem 2.1.12 of Muirhead[15]states that the multivariate Gamma function can be expressed as a product of some univariate Gamma functions, We will present two important lemmas,both of them are on the asymptotic expansion of the Gamma function,the results can be seen in Lemma 5.1 and Lemma 5.4 of Jiang and Yang[11]respectively. To prove Theorem 2.2,we will also need to prepare two important lemmas.The first one is a more precise result on the asymptotic expansion of univariate Gamma function,which can be found in Lemma 5.1 of Jiang and Qi[10]. Lemma 4.3.As x→∞, holds uniformly on b∈[−δx,δx]for any givenδ∈(0,1). Another result is also on the asymptotic expansion of multivariate Gamma function,which can be seen in Proposition 5.1 of Jiang and Qi[10],and it can be stated as follows. Proof of Theorem 2.2.By pursuing the subsequence strategy adopted by Jiang and Qi[10],we will prove The paper proposes a new high-dimensional LR test for testing a hypothesis about a special intraclass correlation structure of the multivariate normal population.By the method of the asymptotic expansion of Gamma function,it is proved that the logarithmic LR test statistic asymptotically obeys Gaussian distribution under the assumption of both the dimensionpand sample sizeNtend to infinity,and a high-dimensional likelihood ratio test(HLRT)method related the asymptotic distribution of the LR statistic is introduced. In order to show the performance of our HLRT test in testing of the intraclass correlation structure of the multivariate normal population,we make a comparison between five methods by Monte Carlo simulations,that is,the classical BOX method,F-method,the high-dimensional Edgeworth expansion(HAE)method,the more accurate high-dimensional Edgeworth expansion(AHAE)method and our HLRT method.The former two methods are established under the assumption of the dimensionpis fixed.The HAE method and the AHAE method are used to solve the high-dimensional test of(0,1)asp→∞andN→∞.Our HLRT method can deal with the high-dimensional case ofp By the simulations,we can see that when the dimensionpis small,the classical BOX method and F-method are better than the three high-dimensional methods.While for the high-dimensional case of bothpandNis large,the HAE method,the AHAE method and our HLRT method outperform the BOX method and F-method.And our HLRT method is as efficient as the HAE method and the AHAE method in analyzing the high-dimensional statistical problem when both the dimension and sample size are large. One of the advantage of our HLRT method is that it is more concise than the HAE method and the AHAE method,and the constraint condition ofpandNis more mild.However,our HLRT method and other two high-dimensional methods are all based on normality of the population,it is also an interesting topic for the intraclass correlation structure test of a general population.At the same time,the corresponding test under the assumption ofp>Nwithp→∞,N→∞is also a meaningful project in a subsequent work. Acknowledgements The author would like to thank the two referees and the editor for many valuable comments and suggestions.
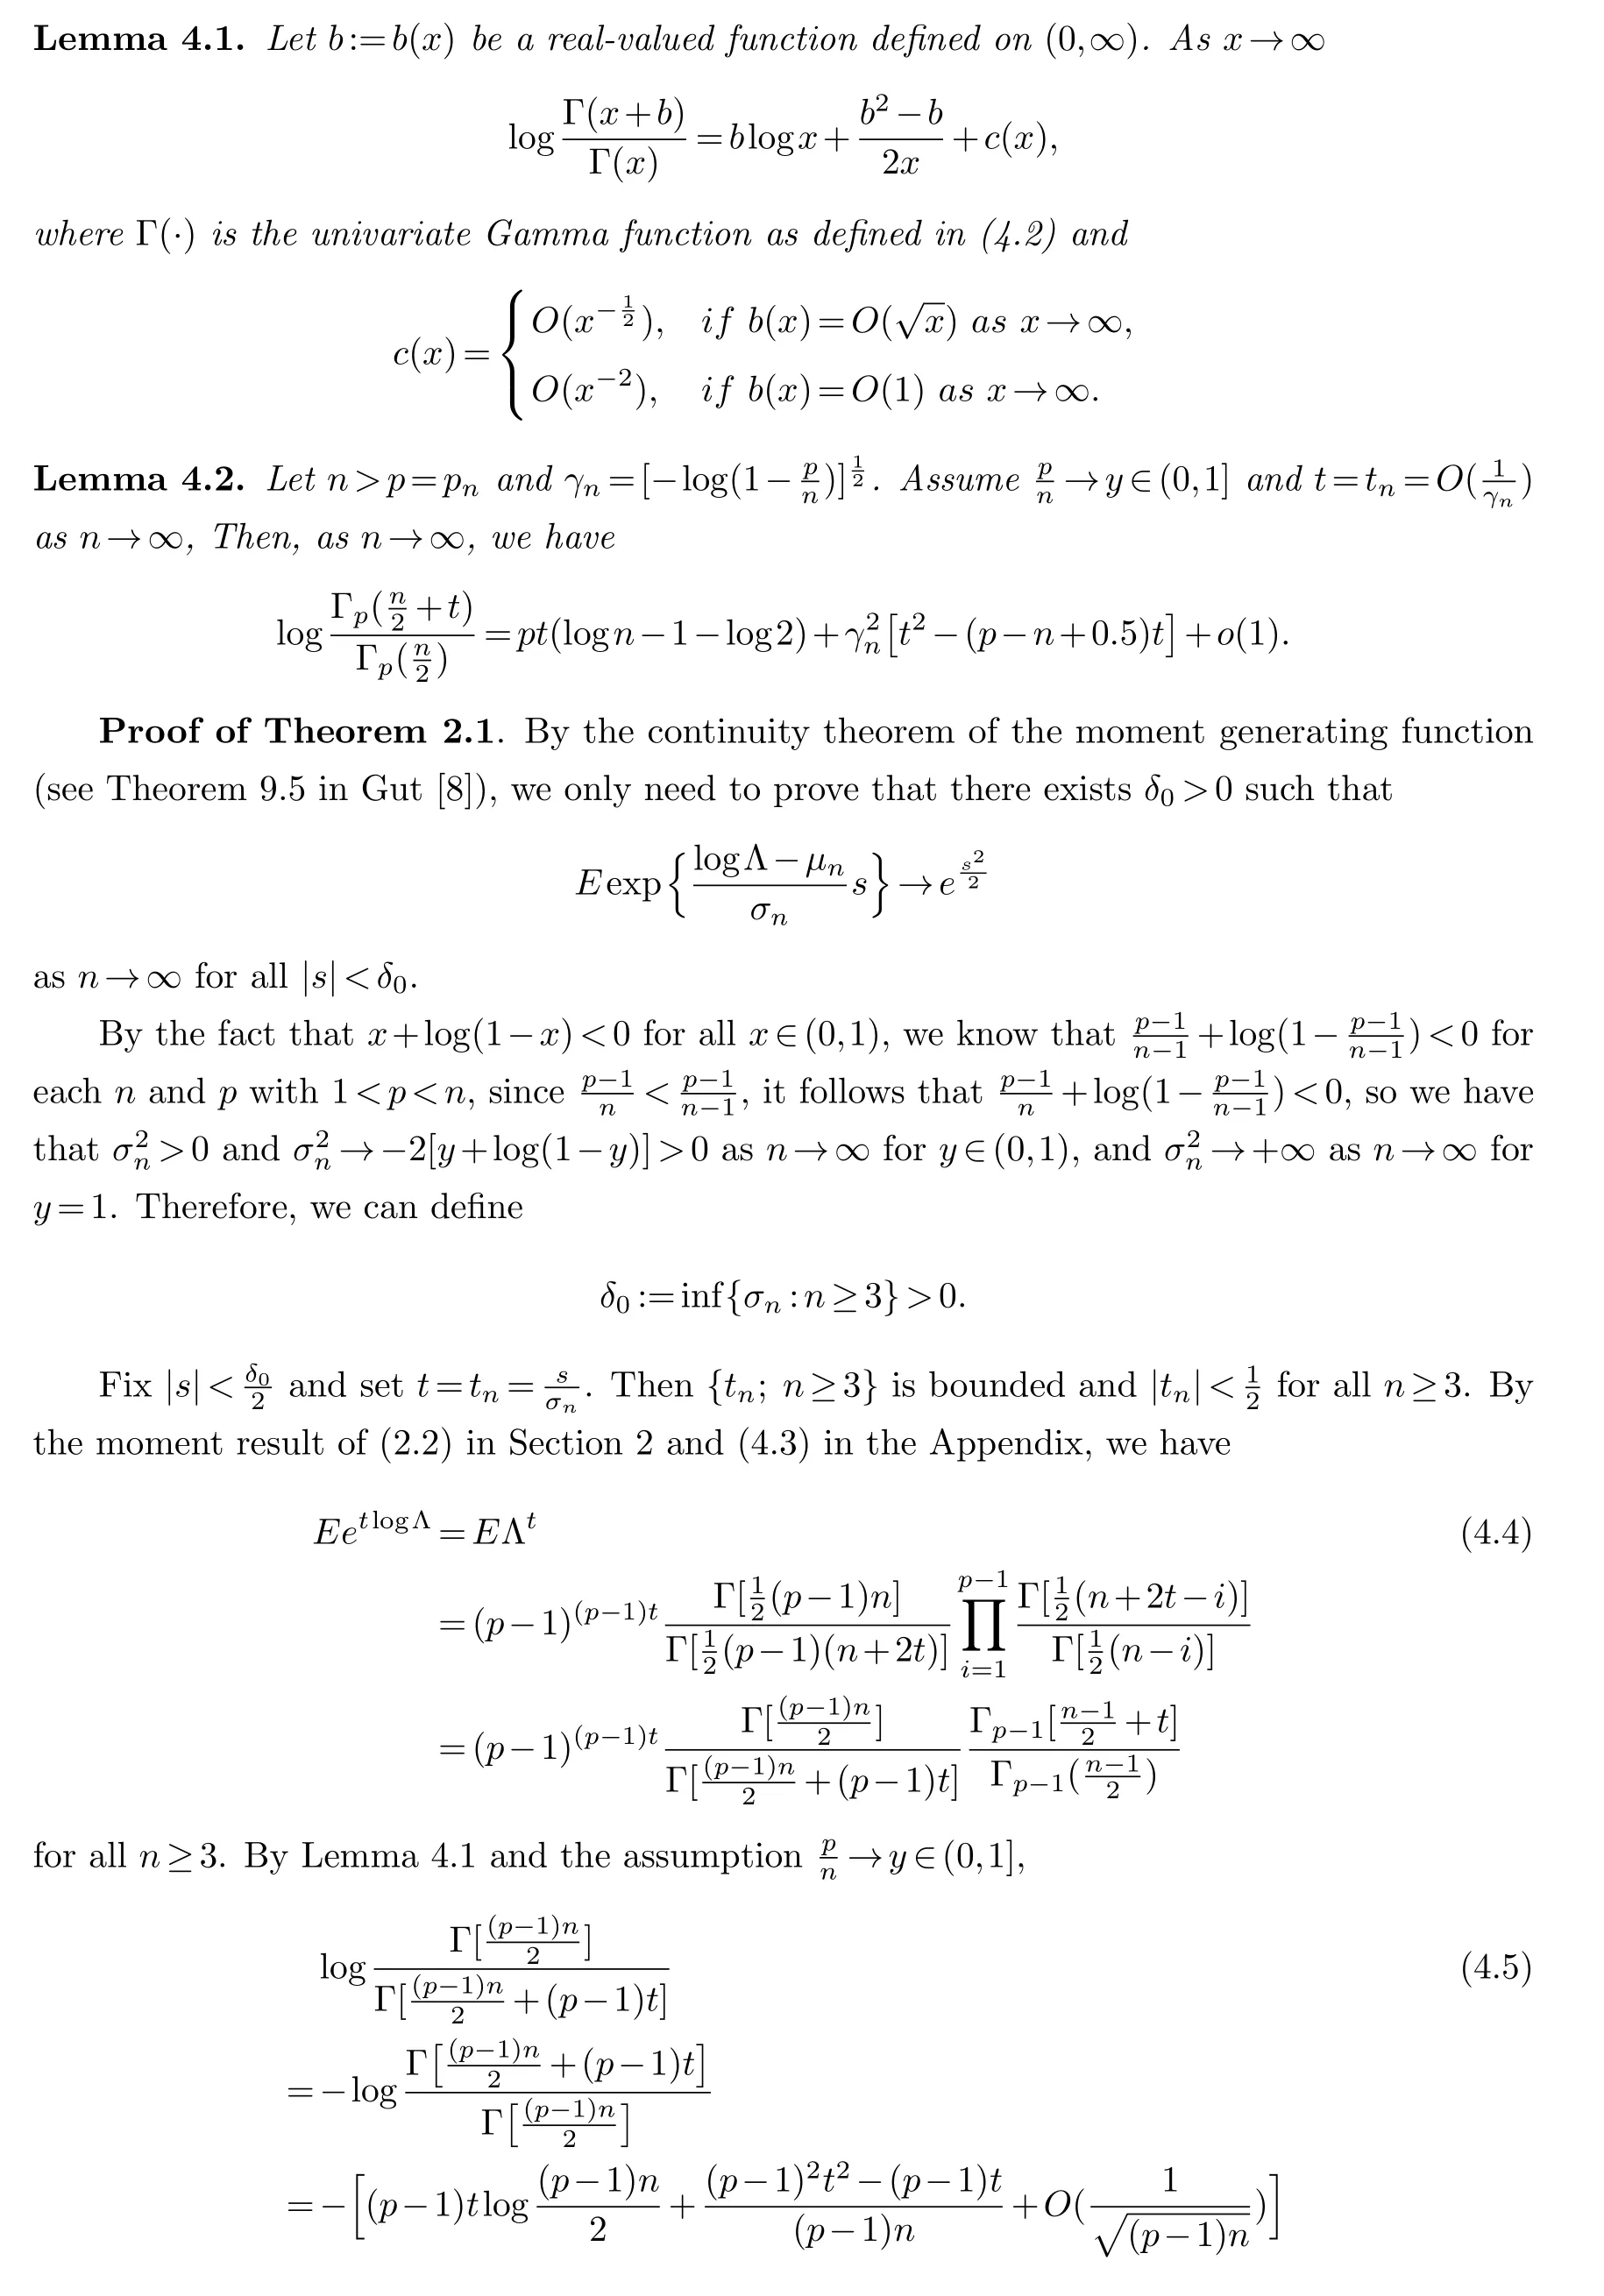
§4.Proofs


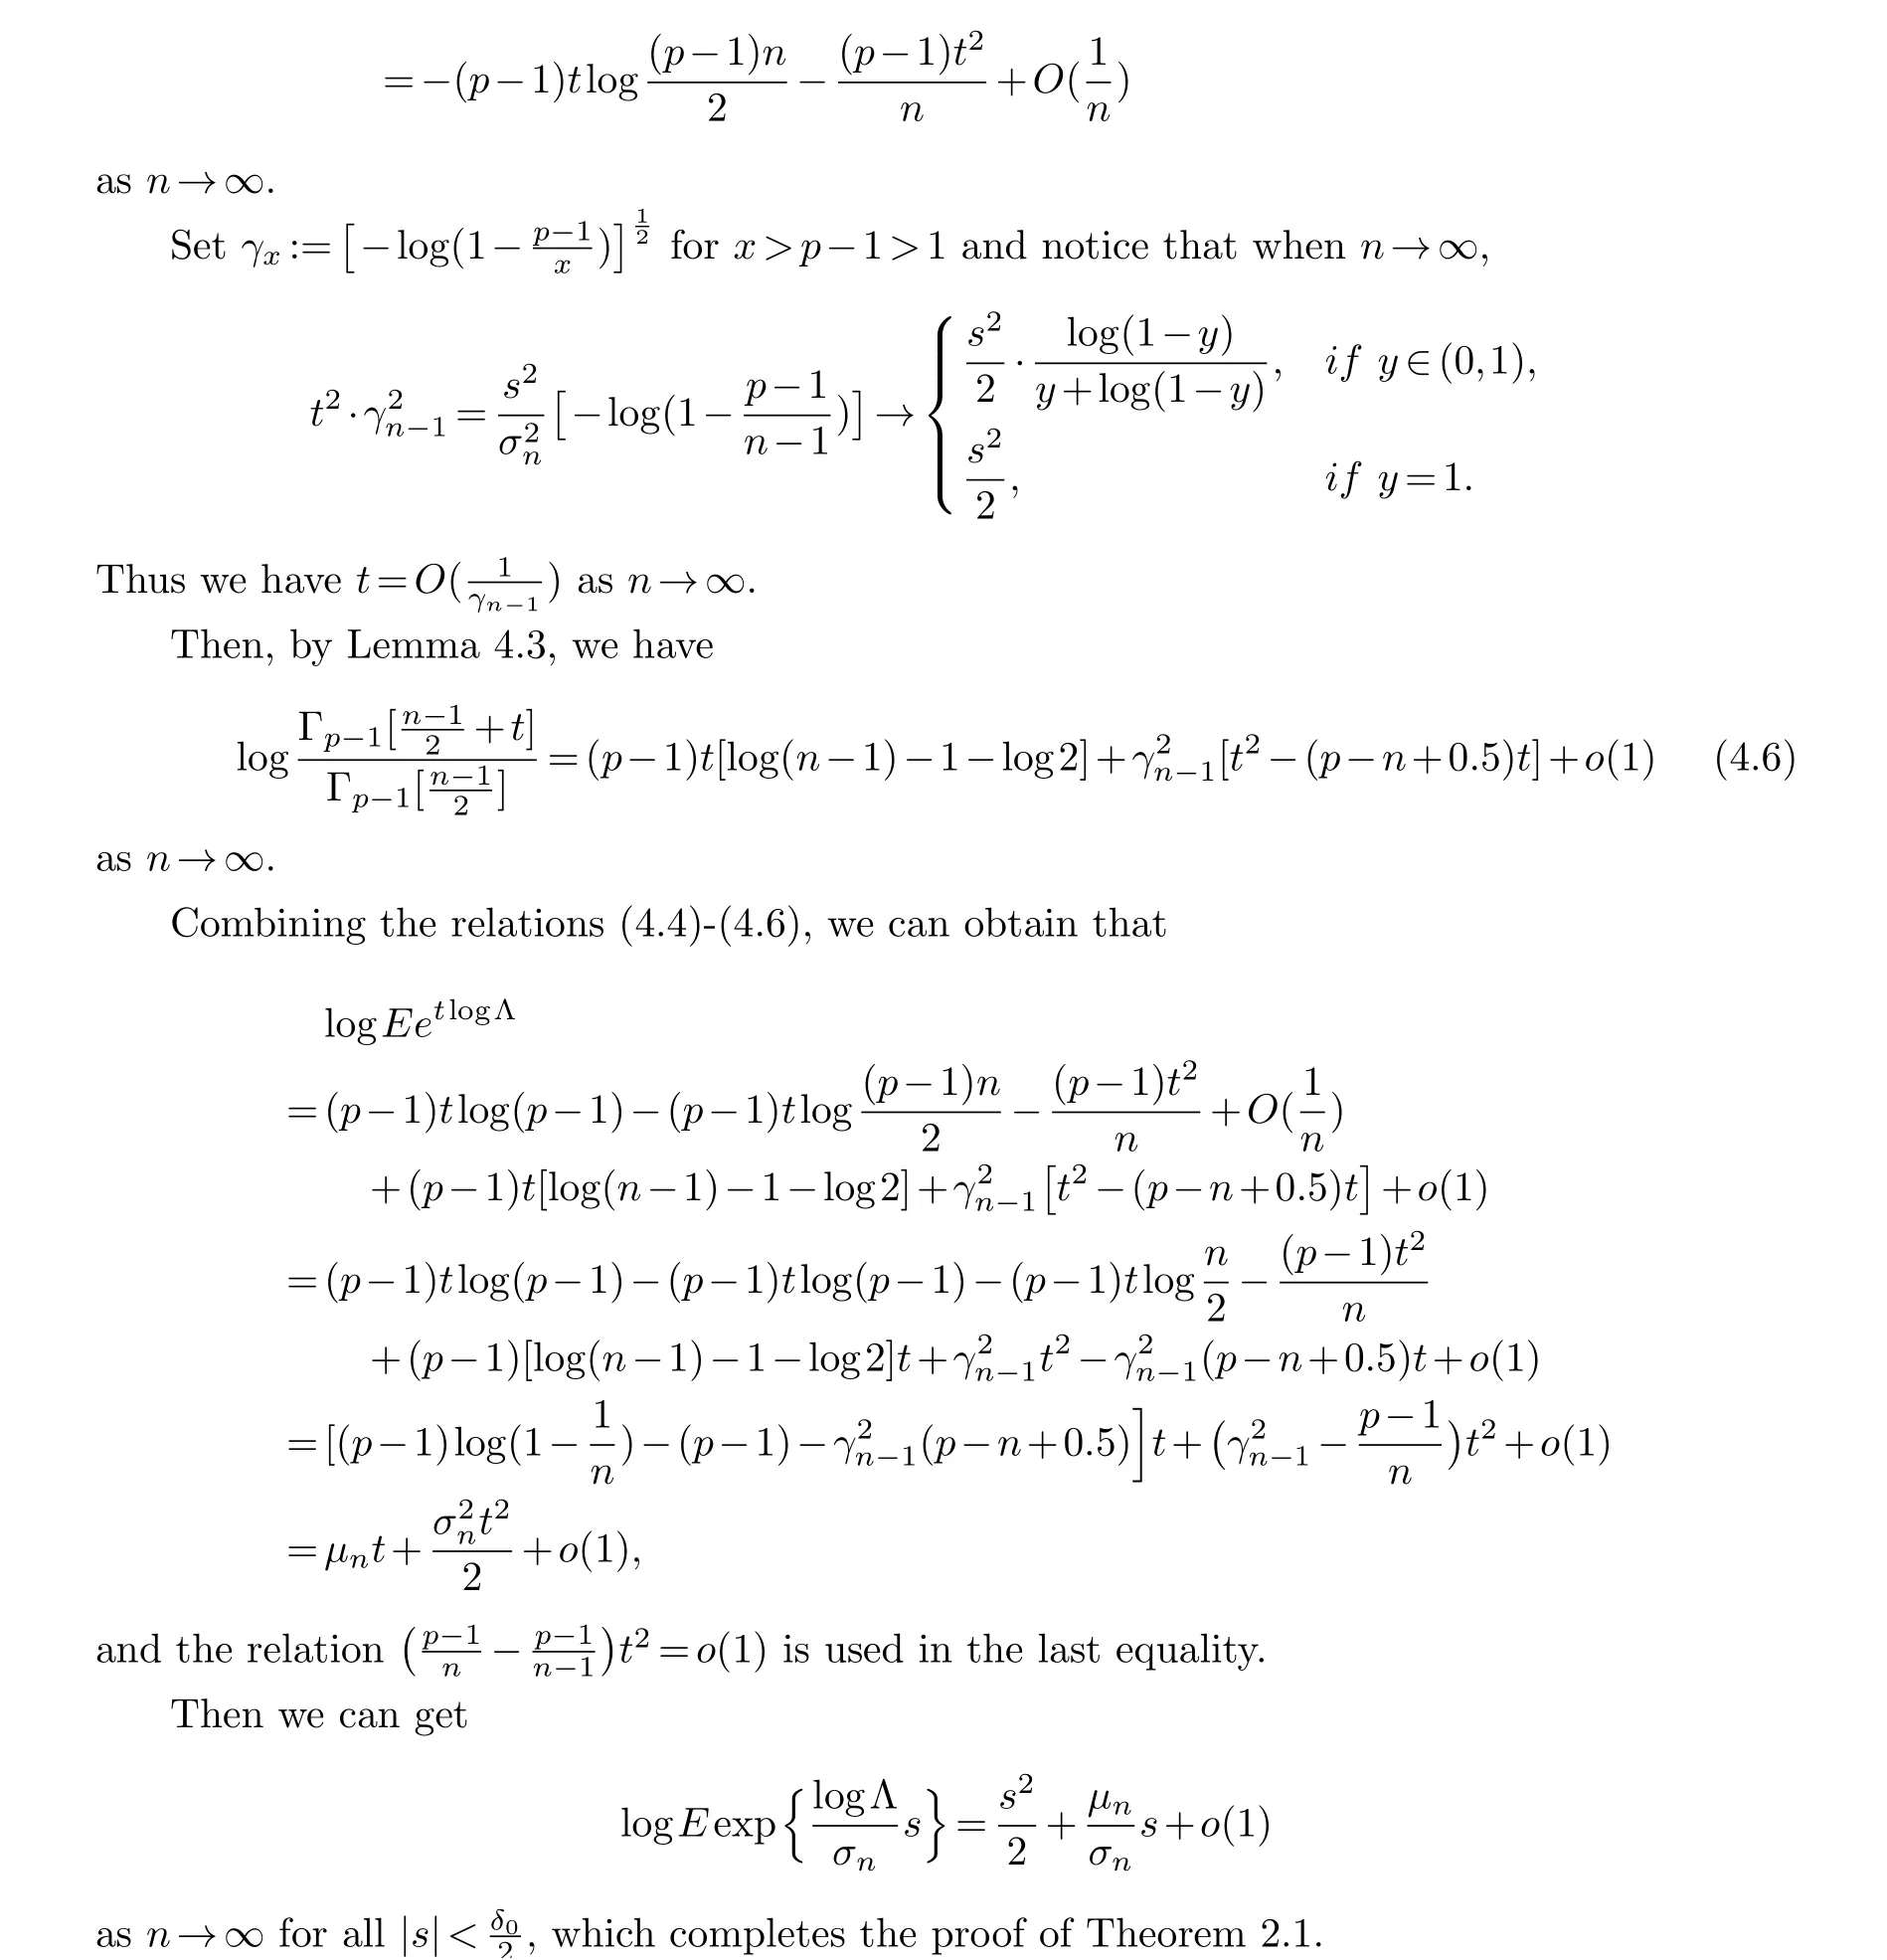

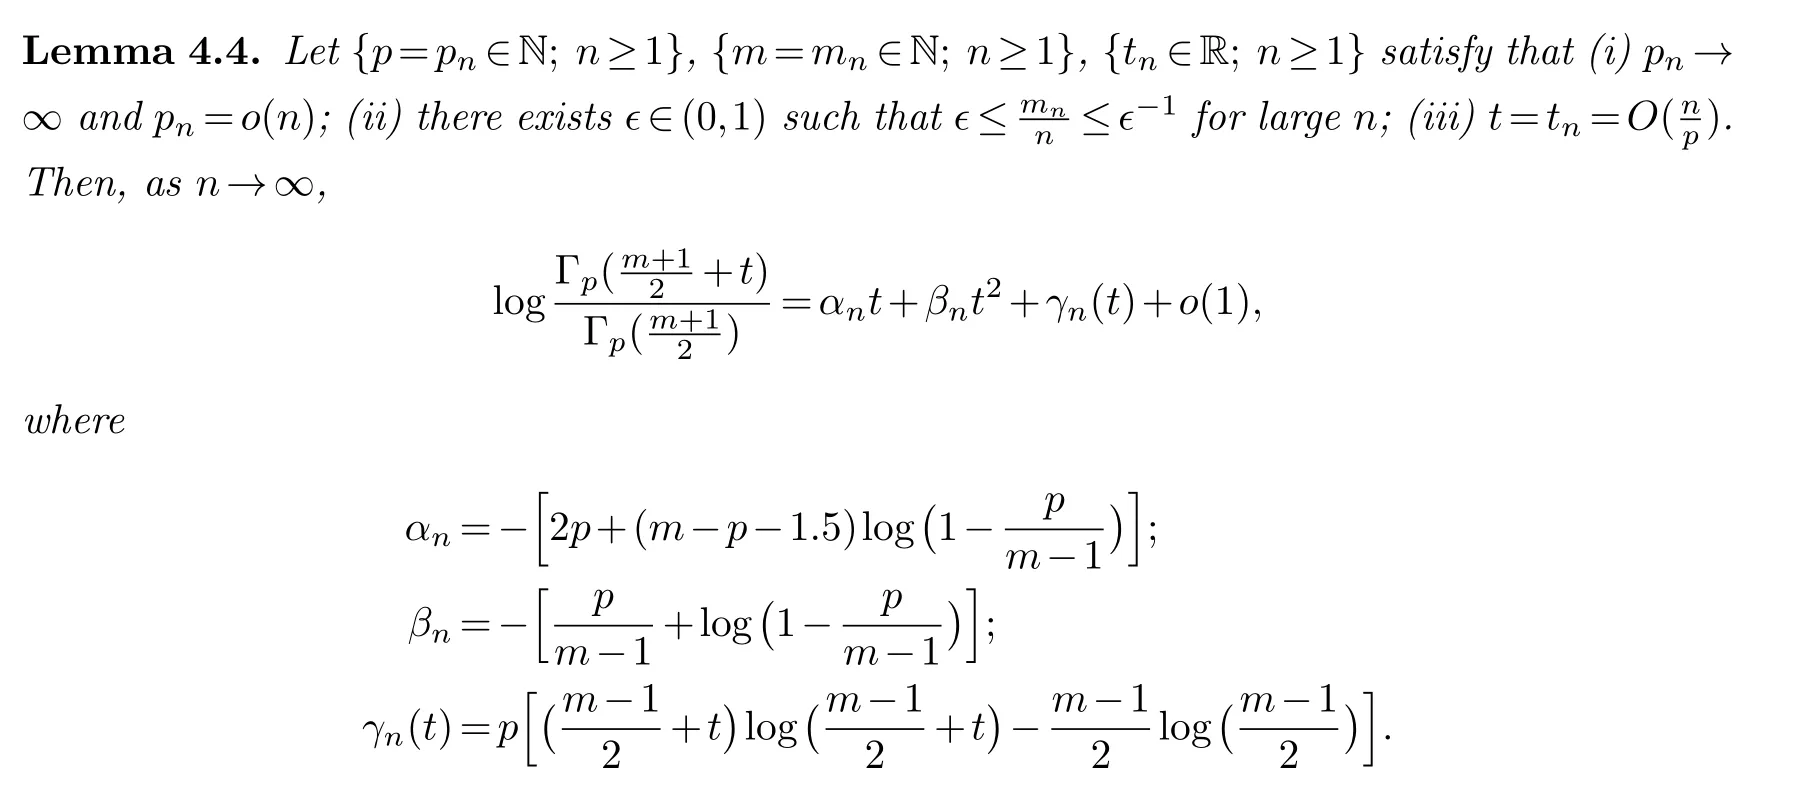
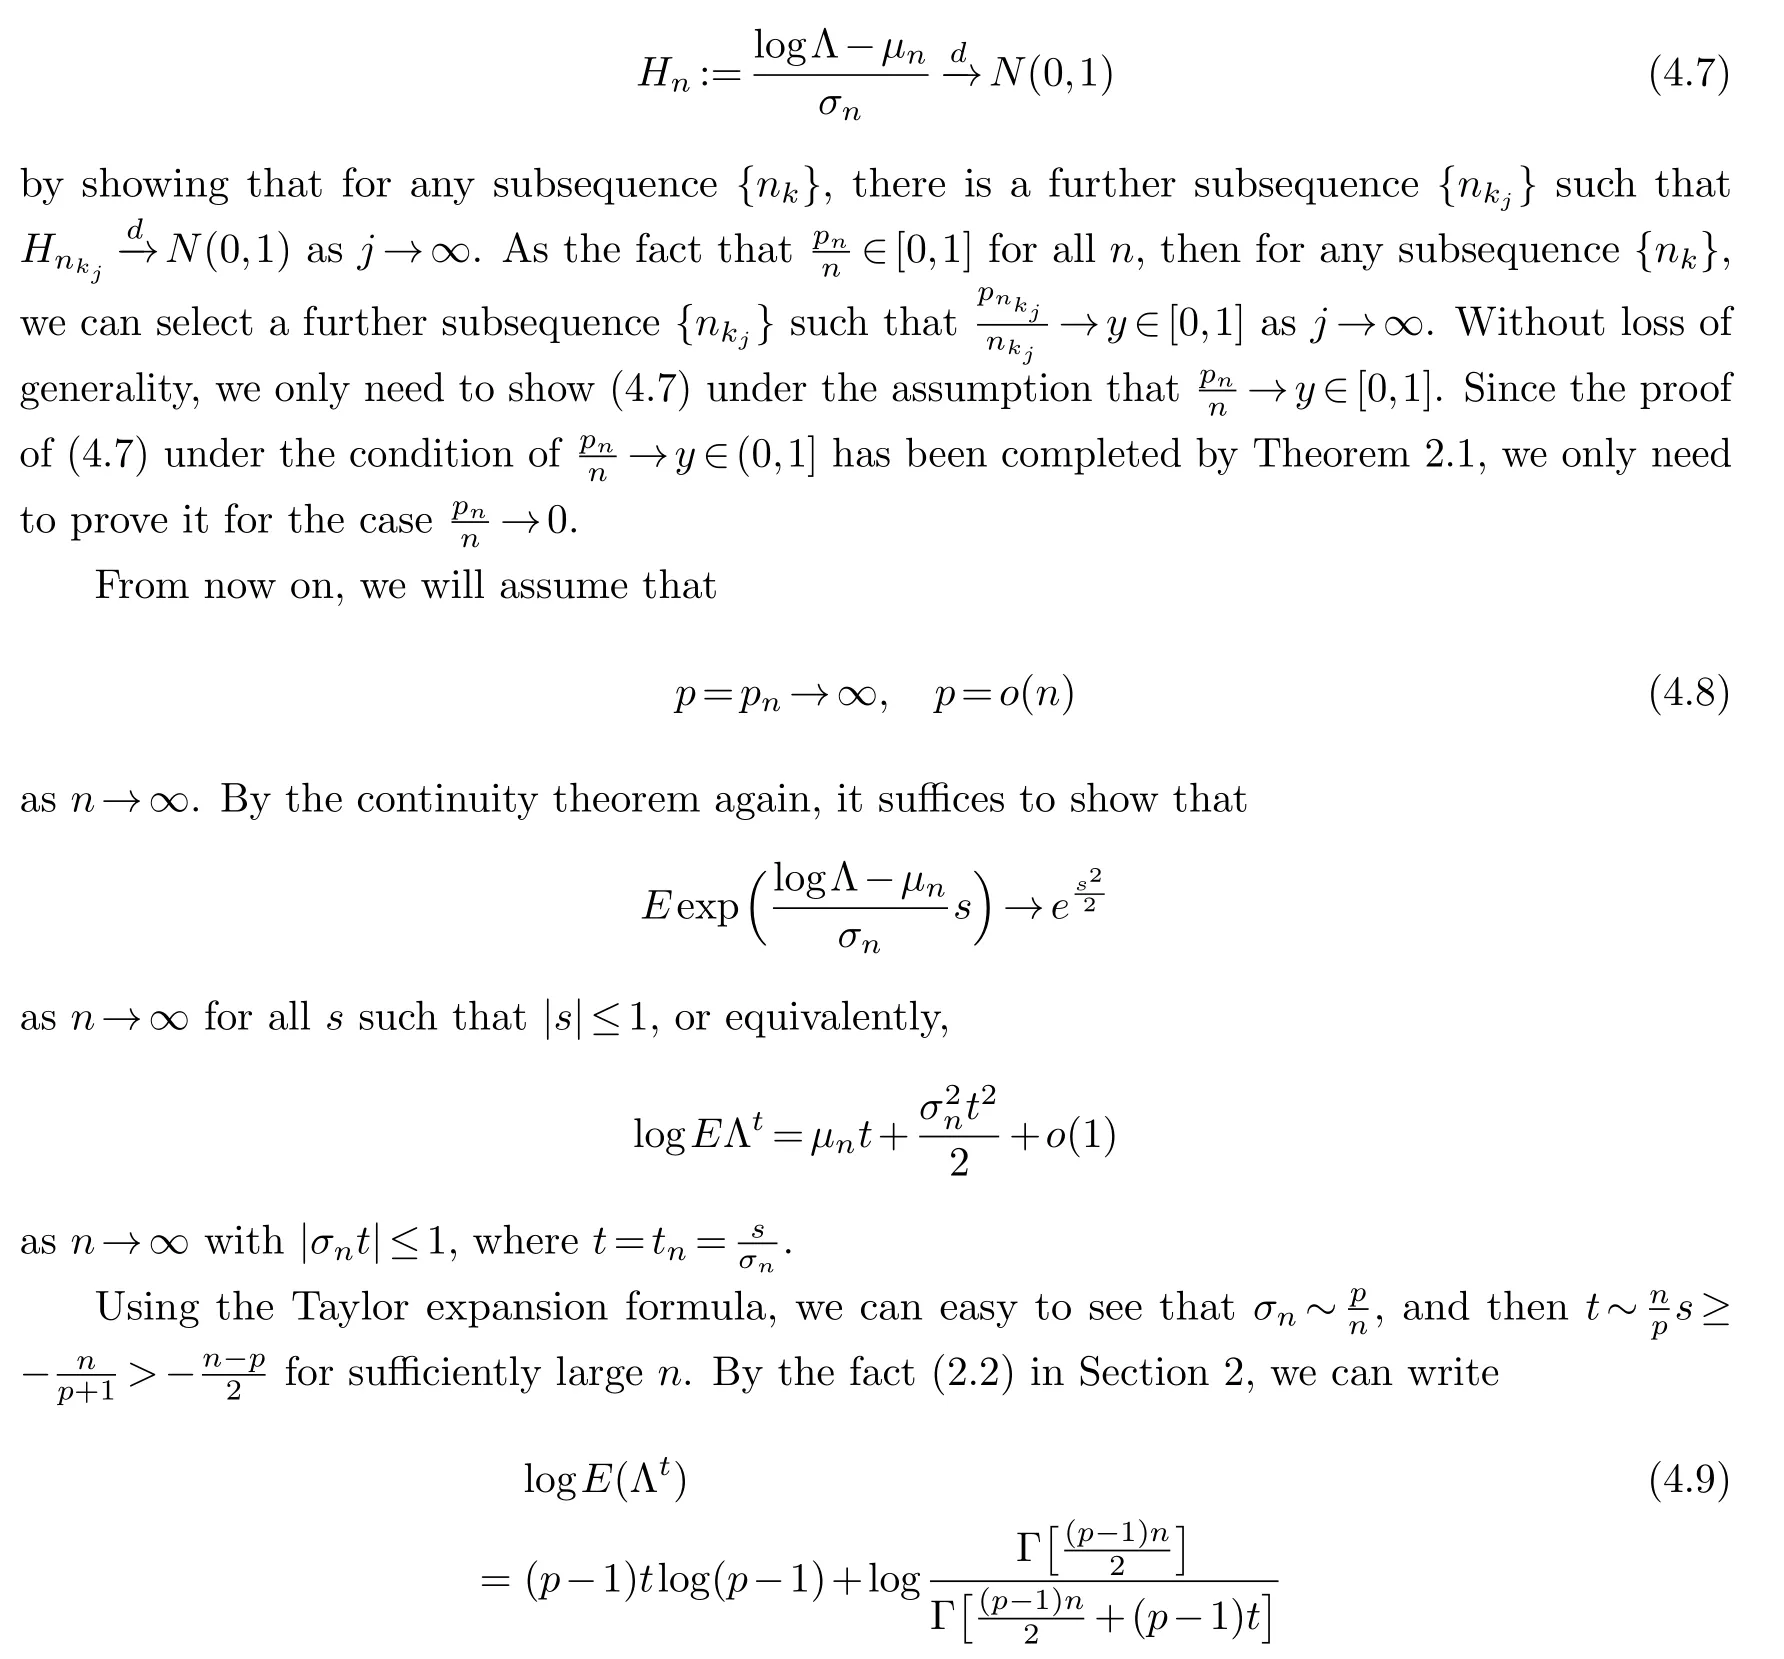
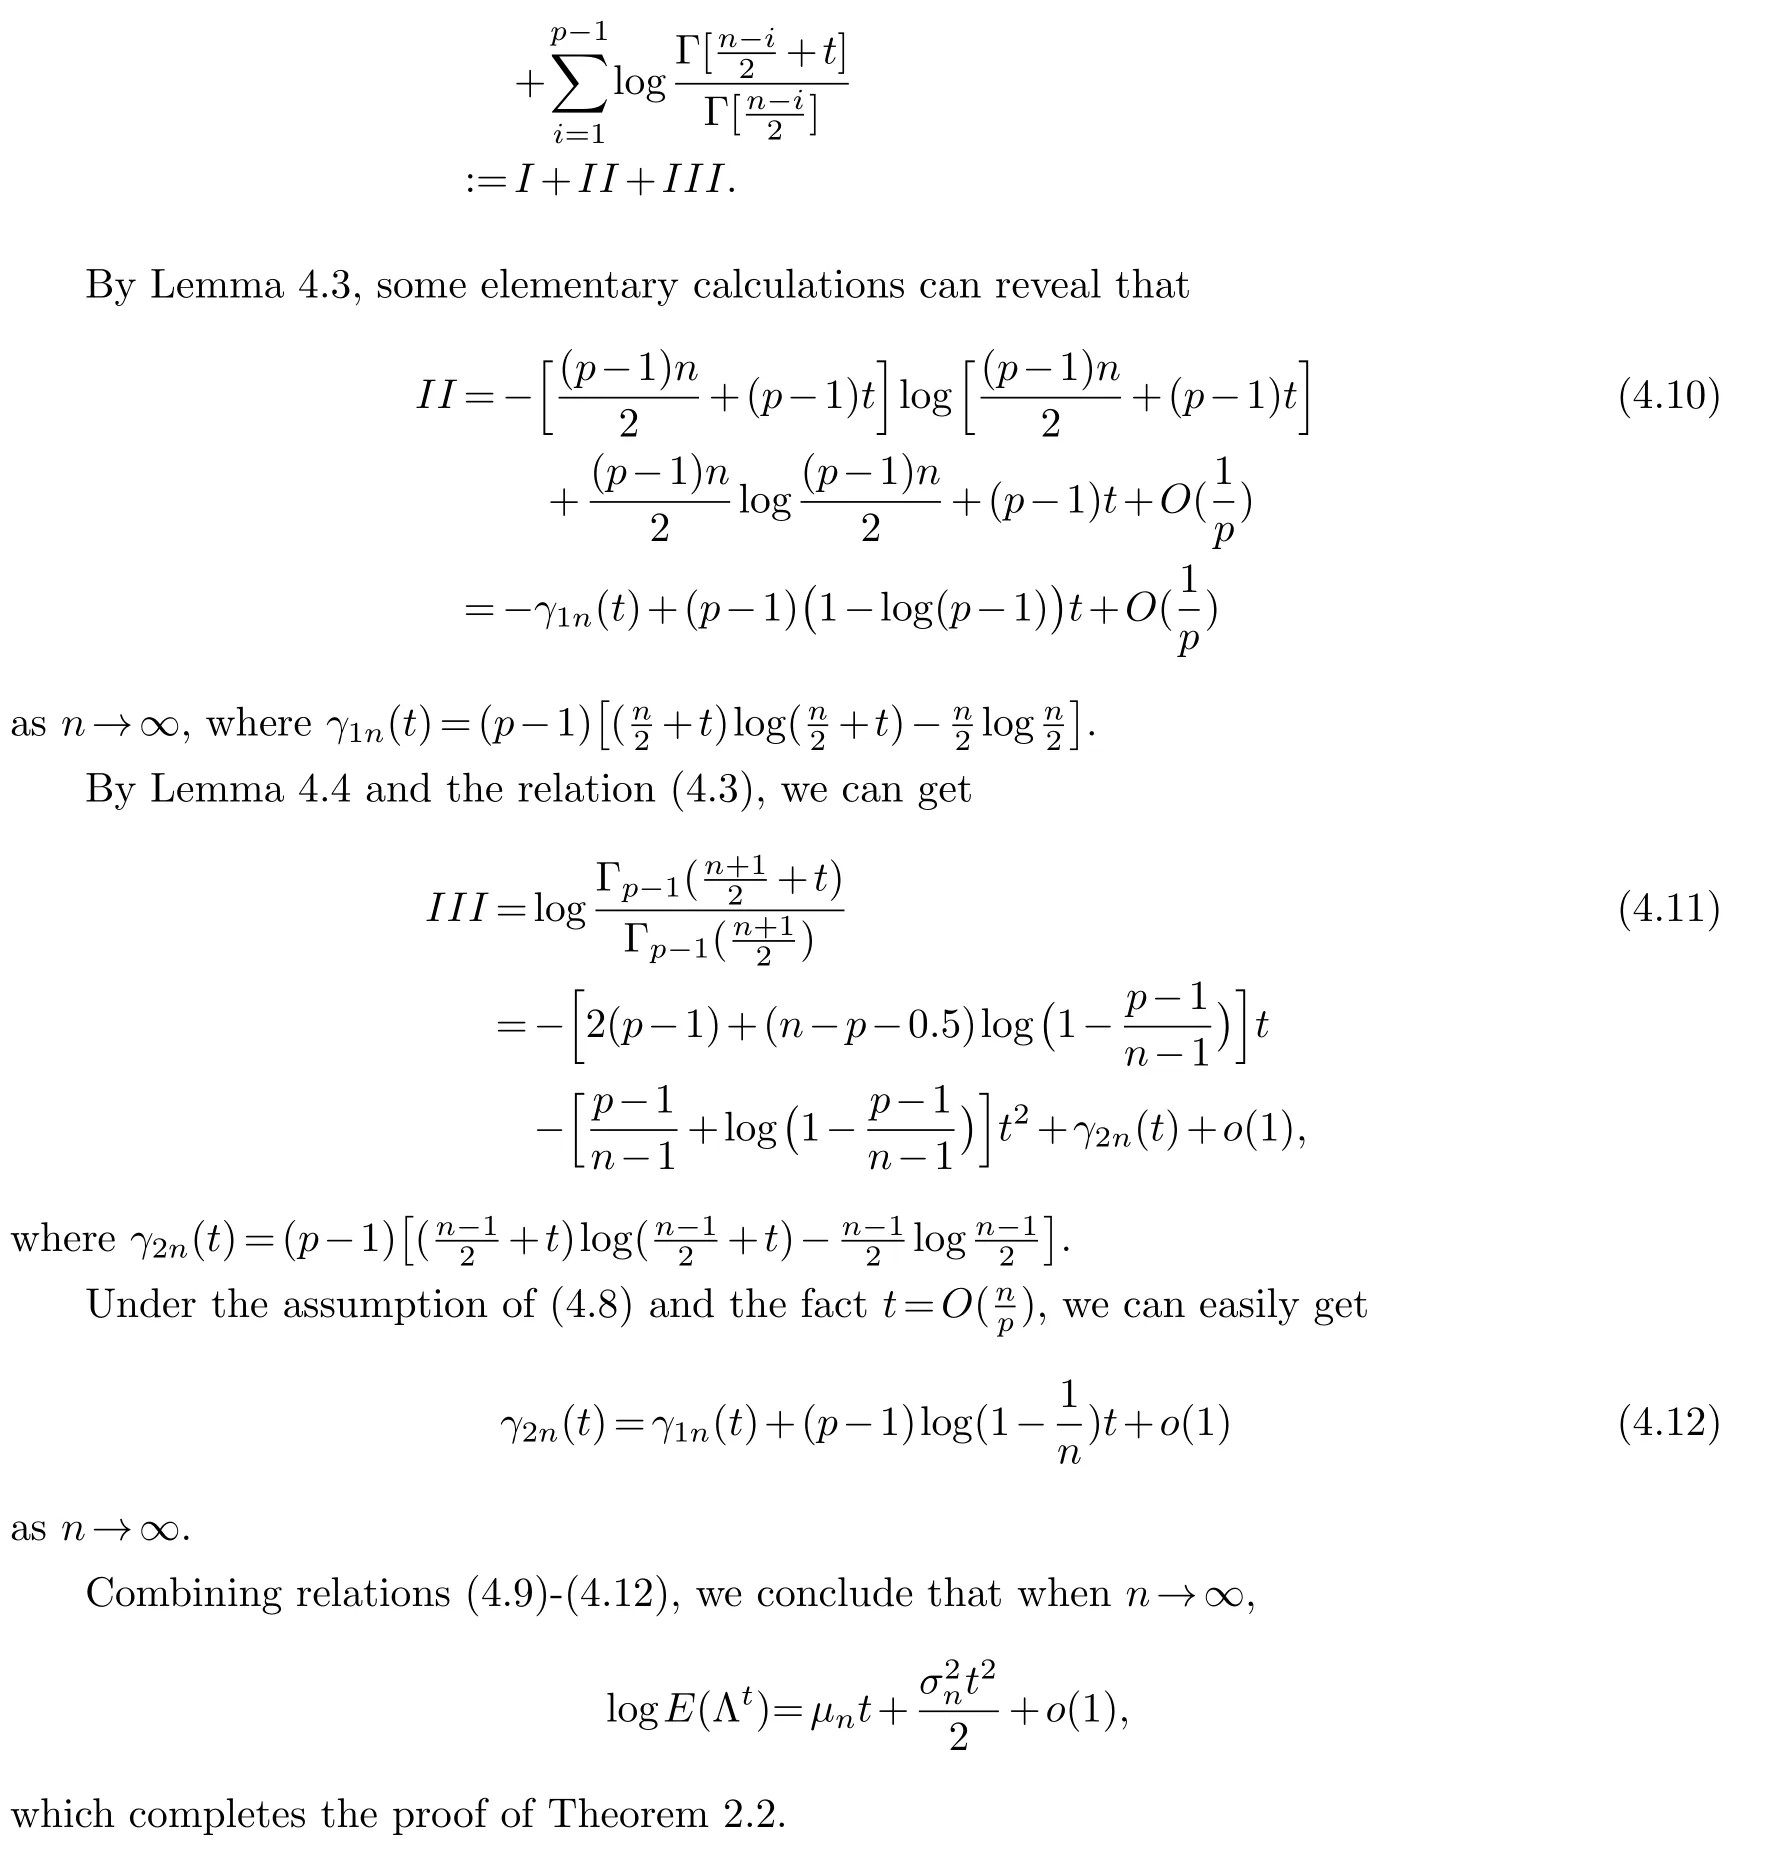
§5.Conclusion
杂志排行
Chinese Quarterly Journal of Mathematics的其它文章
- Well-Posedness for Timoshenko System with Thermodiffusion Effects and Delay
- The Normal Family of Meromorphic Functions Concerning Shared Analytic Function
- Stability of Traveling Wavefronts for a Spatially Nonlocal Population Model with Delay
- Generalized Wave Operators in Von Neumann Algebras
- Spatial Decay Estimates for the Solutions to Stokes Equations in Four Kinds of Semi-Infinite Cylinders
- A Note on the Representation of an Integer in Two Different Bases
