A Consistency Check of Synchrotron Radiation with Fermi GRB Spectra*
2022-04-02WANGDaozhouLUOShuanglingPENGZhaoyang
WANG Dao-zhou LUO Shuang-ling PENG Zhao-yang
(1 College of Physics and Electronics, Yunnan Normal University, Kunming 650500)
(2 Yunnan Yuxi Hengshui Experimental High School, Yuxi 653100)
ABSTRACT We define a new quantity, the curvature width, to check the consistency of the synchrotron model with the spectra of gamma-ray bursts (GRBs). This quantity measures the spectral break sharpness at the emission energy spectral (νFν, ν is frequency and Fν is energy flux as a function of ν)peak in GRBs.Using this quantity,we check the consistency between the theoretical synchrotron model and the observed GRB spectra. We first calculate the curvature widths of several typical synchrotron models including the mono-energetic,single power-law and broken power-law electron synchrotron models.Then we choose a GRB sample including a total of 1198 spectra from the Fermi/GBM (Gamma-ray Burst Monitor) long GRB time-resolved spectra catalog,fit the spectra with commonly used empirical models and compute the spectral curvature widths of best-fit models. By comparing the two curvature widths, we find most of the sample are incompatible with the synchrotron models, because the spectral breaks of the synchrotron models are much smoother than those of the data. Our results suggest that the synchrotron models are hard to accommodate most of the observed GRB spectra. Further, a tight anti-correlation between the photon flux and curvature width is found within a pulse of a burst, which suggests the higher flux, the sharper spectral break or the more deviating from the synchrotron models.
Key words (stars:) gamma-ray burst: general, radiation mechanisms: non-thermal, methods:data analysis
1 Introduction
Gamma-ray burst (GRB) is one of the most intriguing astronomical phenomena in recent decades. How gamma rays of GRBs are produced and how GRB spectra are formed, i.e., the radiation mechanism, is one of the crucial open questions and still highly debated. In observations,most GRB photon spectra can be fitted well with several empirical models, including the BAND function (BAND)[1], Comptonized (COMP) and smoothly broken power-law models (SBPL)[2-4].However, the downside of the models are no physical motivation and thus the radiation physics are not directly understood with the fitted parameters.
Some models have been proposed to explain the GRB spectra. One of the most important models is thermal emission from the GRB fireball photosphere[5-7]. However, the observed GRB spectra are non-thermal since their spectral shapes are simply broken power-law, so disfavor thermal dominated origin. More complex photosphere models involve more radiation components and radiative transfer process[8-9]. The emerged spectrum depends sensitively on some unknown factors, such as the optical depth of photosphere[10].
It is generally believed that synchrotron and inverse Compton (IC) process can produce a nonthermal GRB spectrum. But the current observations in the prompt phase have found that the IC component emerges in a high energy band[11], and may be hard to be detected. So synchrotron radiation is a more viable model, which involves relativistic electrons and magnetic field. In the standard fireball shock model[12-17], shells with different Lorentz factors are ejected during the prompt emission phase. When a faster shell catches up with a slower shell, an internal shock is generated,electrons inside will be accelerated and the magnetic field is magnified. The energy of the accelerated electrons can be radiated by synchrotron emission (internal-shock model)[17]. In the standard model, the energy of magnetic field is only a small fraction of the total energy of the fireball. If the magnetic field energy is dominated,the collision of the shells may induce magnetic field reconnection and electrons are accelerated by the magnetic field (magnetic reconnection mechanism)[18-19].The dominated radiation is synchrotron emission again.
However, the simple synchrotron model with a constant magnetic field and a power-law electron distribution is hard to accommodate the data[20].Especially, the typical observed low energy spectrum of GRB is not consistent with any segment of the synchrotron model. Even some bursts suffered the so-called line-of-death problem[21-23],i.e.,there are a small fraction of bursts with low energy slopes ofα >-2/3, which is harder than the theoretical synchrotron limitation. The above mentioned problems may be solved under IC cooling in Klein-Nishina(KN)regime[24-27]or magnetic field decay in the emission region[28-31]. Because the electron cooling rate changes from∝γ2eto be∝γe(γeis the electron energy) in both cases, this makes the electron distribution below the injection minimum energy tends to,and the synchrotron model is basically consistent with the observed data since the synchrotron photon spectrum with a slope of~-1.
Since the electron distribution below the injection minimum energy can be changed to a slope of 1 due to the KN effect or the magnetic field decay, the synchrotron spectra of a broken powerlaw electron distribution with the slopes of-1 and-3.5 can be consistent with the typical GRB spectrum. However, this does not mean the synchrotron model can fit the data because its break sharpness is not necessarily satisfying those of the data. The synchrotron spectrum of a power-law electron distribution is the superposition of single electron emission and thus the synchrotron break sharpness for the broken power-law electron distribution is very smooth since the synchrotron emission of single electron has an extensive tail with the slope of 1/3 (electron spectrum, i.e., the energy flux spectrum(Fν)as a function ofν)below its synchrotron peak.Whether this break sharpness is consistent with the data needs to be checked.
Recently,Axelsson&Borgonovo[32]characterized the spectra in terms of an auxiliary quantity,the spectral width, measuring the spectral broadness. Comparing the spectral widths of data with those of theoretical models,they found most of the data are inconsistent with the synchrotron model.Similarly, Yu et al.[33]defined a sharpness angle(θ) of the triangle constructed under the peaks or breaks of the model fitted spectra to describe the spectral break sharpness, and test the ability of the synchrotron theory to interpret the observed spectra. They also gave the conclusion that the synchrotron model is not able to interpret most of the data. Without the need of fitting the data with theoretical models,these methods can test whether the theoretical models are consistent with the data or not.
In this paper, we introduce a new quantity,the curvature width, measuring the spectral break sharpness. This quantity describes how sharp the spectral break is for a broken power-law spectrum.We calculate the spectral curvature widths of the synchrotron models and the spectra from a Fermi/GBM (Gamma-ray Burst Monitor) long GRB sample, aiming at testing the validity of the synchrotron model as the radiation mechanism of GRB with this quantity. This paper is organized as follows. In Section 2, the spectral curvature width is defined and comparison is made between the curvature width and the sharpness angle or the spectral width. In Section 3, we present the calculation of several theoretical synchrotron spectra and the curvature widths. In Section 4, we adopt a Fermi/GBM GRB sample including 1198 timeresolved spectra and fit the spectra with some empirical models. Then the curvature widths are calculated with the fitted parameters and the comparison between the theoretical model and the data is presented. Finally, we summarize and discuss our results in Section 5.
2 The definition of the curvature width
For a given spectrum functionf(ν), the curvature as the function of the frequencyνis given by

wheref′andf′′are the first and second derivatives off,respectively.Then we calculate the curvature width ofk, as

whereν1andν2are the lower and upper frequency bounds of the full width half-maximum (FWHM)of the curvaturek(ν), respectively. As a comparison, the spectral width is defined by the FWHM off(ν)[32]while the sharpness angle(θ)represents the opening angle of the spectrum[33].
In Fig. 1, we take a typical burst, GRB 080817 (with an interval of 17.397–18.589 s after the trigger), as an example, whose best-fit spectrum (black thick line) and spectral curvature(black thin line)are shown. For a more convenient calculation,Wis normalized between (0, 1). One can find thatθrepresents the opening width of the spectrum, but it is hard to describe the break sharpness of the energy spectrum from low energy to high energy.We cannot distinguish between the two types of spectra, denoted by the black thick line and the dashed line, in terms ofθ. The spectral width has similar problem. While the curvature width we defined can better characterize the difference between the two types. The sharper the spectrum break,the smaller the curvature width.If the shape of the spectrum is a broken line(dashed line in Fig.1), the width of the curvature is zero.Thus the curvature width can be used as a proxy of the spectral break sharpness. In the following, we will calculate the curvature widths of synchrotron models and the fitted spectra of GRB sample.
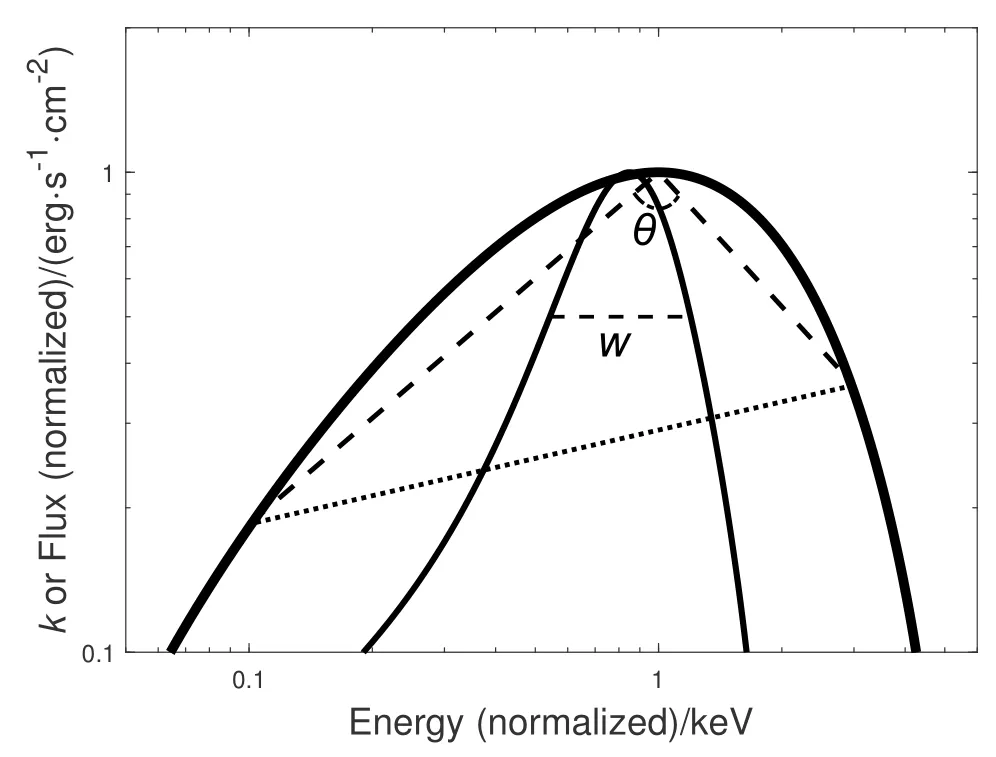
Fig. 1 Schematic illustration of our definition of curvature width W and the comparison with the spectral sharpness angle (θ) defined by Yu et al.[33]. The thick solid line is a typical GRB spectrum and the thin solid line is its curvature. The dashed lines show the definition of the spectral sharpness angle (θ), and the dotted line represents the hypotenuse of the triangle.
3 Synchrotron emission spectral curvature width
Synchrotron plays an important role not only in the GRB afterglow phase but also possibly in the prompt phase, or GRB itself. For monoenergetic electrons, the synchrotron emissivity averaged over an isotropic distribution of pitch angles isP(ν,γe)(erg·s-1·sr-1·Hz-1),which scales as[34]

wheret=ν/(3γ2eνL),νL=eB/(2πmec),Bis the magnetic field,meis electron mass,Kn(t) is the modified Bessel function of ordern.In general,the synchrotron spectrum of mono-energetic electrons(hereafter MES) is the narrowest case in the synchrotron spectra. For a given electron distributionne(γe)∝γ-pe, the synchrotron radiation intensityIν(erg·s-1·cm-2·sr-1·Hz-1) scales as

wherep,γminandγmaxare the power-law index,minimum and maximum injection energies of the electron population, respectively.
A phenomenological synchrotron spectrum from a broken power-law electron distribution with slopes ofp1=1 andp2=3.5(hereafter PS model)is applied, which reproduces the observed typical GRB spectrum[2], i.e.,
whereγbis the break energy of electrons. By considering the electron injection slope of 2.5 allowing for the synchrotron cooling and IC cooling in KN regime[26]or magnetic field decay[29-30], such an electron distribution can be derived. Ifp1= 2, it corresponds to the fast cooling case.
Given these electron distributions, we can calculate the corresponding synchrotron spectrum and spectral curvature width at around theνFν(∝νIν) spectral peaks. For the mono-energetic electron case,the spectral curvature width around the synchrotron peak is derived. Table 1 lists the curvature widths of various theoretical synchrotron models.

Table 1 The curvature width of several synchrotron models
4 Data analysis and results
In this section,we use a GRB sample to check the consistency of data and the theoretical synchrotron models in terms of the defined curvature width.
4.1 The data
The GRB sample we used is from the official Fermi GBM GRB time-resolved spectral catalog[35]. The Fermi GBM contains 14 detectors, including 12 NaI (8 keV to 1 MeV) and 2 BGO (bismuth germanate) (200 keV to 40 MeV)detectors,which cover an energy range from 8 keV to 40 MeV[36]. The catalog contains 1802 timeresolved spectra of the 81 brightest long bursts in the first four years. There are several criteria for the choice of these bursts:(1)10 keV~1 MeV energy fluencefe>4×10⁻⁵erg·cm-2; (2) 10 keV~1 MeV peak photon fluxFp>20 ph·s-1·cm-2in either 64, 256, or 1024 ms binning timescales;(3) there are at least 5 time bins for each burst when binned with signal-to-noise ratio S/N = 30(for more details, please refer to Ref. [35]).
All the spectra are fitted with the GBM offi-cial spectral analysis software RMFIT1https://fermi.gsfc.nasa.gov/ssc/data/analysis/rmfitand three empirical models including the COMP,BAND and SBPL models are used. The functional forms of these models and the corresponding curvature expressions are presented in Appendix. The SBPL model is a five-parameter function because an additional break scale Δ (fixed at Δ = 0.3 in the paper), is introduced other than the broken power law (see the appendix). This model can approach the asymptotic low-energy power law more quickly and the smoothness of the curvature connecting two power-law segments is allowed to be changed[3,37]. Thus the model can not only apply to spectra with very sharp breaks,but also to spectra with very smooth curvature[3]. In contrast, the BAND model has a fixed exponential connection of the two power laws.
In the 1802 time-resolved spectra,311 have no specific spectral parameters, 152 spectra are best fitted by a simple power-law, 70 have a low energy spectral slope of<-2 or high energy spectral slope>-2 so that theirνFνspectra have no turnover and 71 have no spectral curvature peaks.These 604 spectra are excluded because the curvature width cannot be derived. Finally, the sample including the left 1198 spectra is used,in which 980 are best fitted by COMP, 108 by BAND, and 110 by SBPL. We get the empirical spectral function with the fitted parameters of the best-fit model and then calculate the width of the spectral curvature using the definition in Eq.(2).We computeWof the spectra. The width will be in “units” of dex. In addition, we perform a Monte-Carlo simulation to compute the uncertainty of the width for each spectrum. We first generate a set of spectral parameters with the best-fitted parameters and errors following the standard normal distribution,then we recalculate the new curvature width by using these new parameters. This process is repeated 1000 times for each spectrum, finally, the uncertainty of the width is calculated.
4.2 Distribution of W and its comparison with theoretical models
The curvature width distribution of the whole sample with the best-fit empirical model is shown in Fig.2. One can find the values ofWare mostly distributed between 0.1 and 0.5, although it can be seen that the maximum width can reach 2.5.More than 60% and more than 90% of the spectra are incompatible with the MES model and the single power-law models of SP4 (also the models SP2 and SP3, sinceWincreases as thepvalue decreases), respectively. Also, 90% of the spectra are incompatible with the PS and FC model. The distribution of the uncertainties of allWis shown in Fig.3, the median value of these uncertainties is approximately 0.05, which is not enough to influence our conclusions.
The best-fit model for most of the sample is COMP. So Fig.2 actually suggests the bursts best fitted by COMP model are incompatible with synchrotron model. The distributions ofWderived from the sample with the best-fit model being SBPL and BAND,are shown in Fig.4.It is found that over 65%and 80%out of 108 spectra best fitted by the BAND model can be explained by the models SP4 (solid) and PS (dashed), respectively. Over 60% of 110 spectra best fitted by the SBPL model are consistent with the SP4 and PS model. If the detector with higher resolution and sensitivity detects more high-energyγphotons,the high-energy spectrum index(β)will be better constrained,and BAND and SBPL are the preferred models. The inconsistency between synchrotron model and observation data will be reduced if the spectrum of GRB is wider.
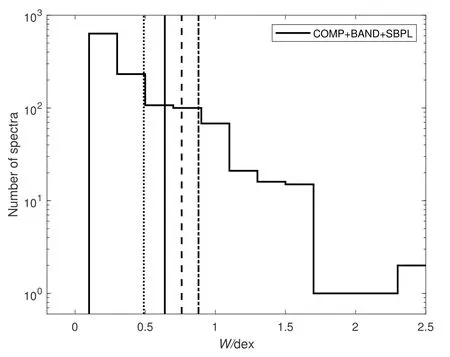
Fig. 2 The distribution of W for the whole sample. In the above legend, “COMP + BAND + SBPL” represents the overall population of the three best-fit models. The vertical lines represent the curvature width from the physical synchrotron models: MES (dotted), SP4 (solid), PS (dashed)and FC (dash-dotted).
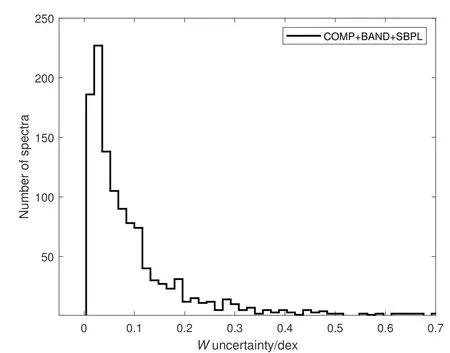
Fig. 3 The uncertainty of W for the three best-fit models
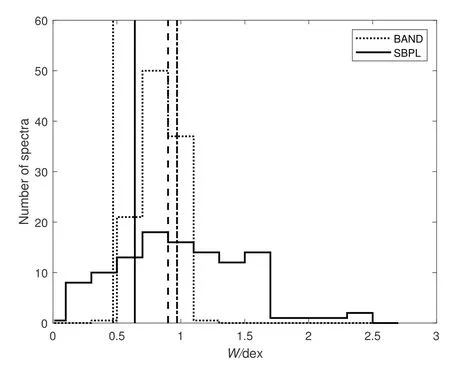
Fig. 4 The distribution of W derived from the models SBPL and BAND. The dotted, solid, dashed and dash-dotted vertical lines represent the models MES, SP4,PS and FC, respectively.
4.3 Spectral evolution and flux-W correlation
Now, we consider theWevolution of timeresolved spectra within a GRB,motivating the exploration of the possible correlation ofWwith flux. TheWevolution in several example bursts is shown in Fig.5. Limits of the models MES, SP4 and PS are overlaid, and the 10 keV–1 MeV photon flux is also displayed on the right axis.
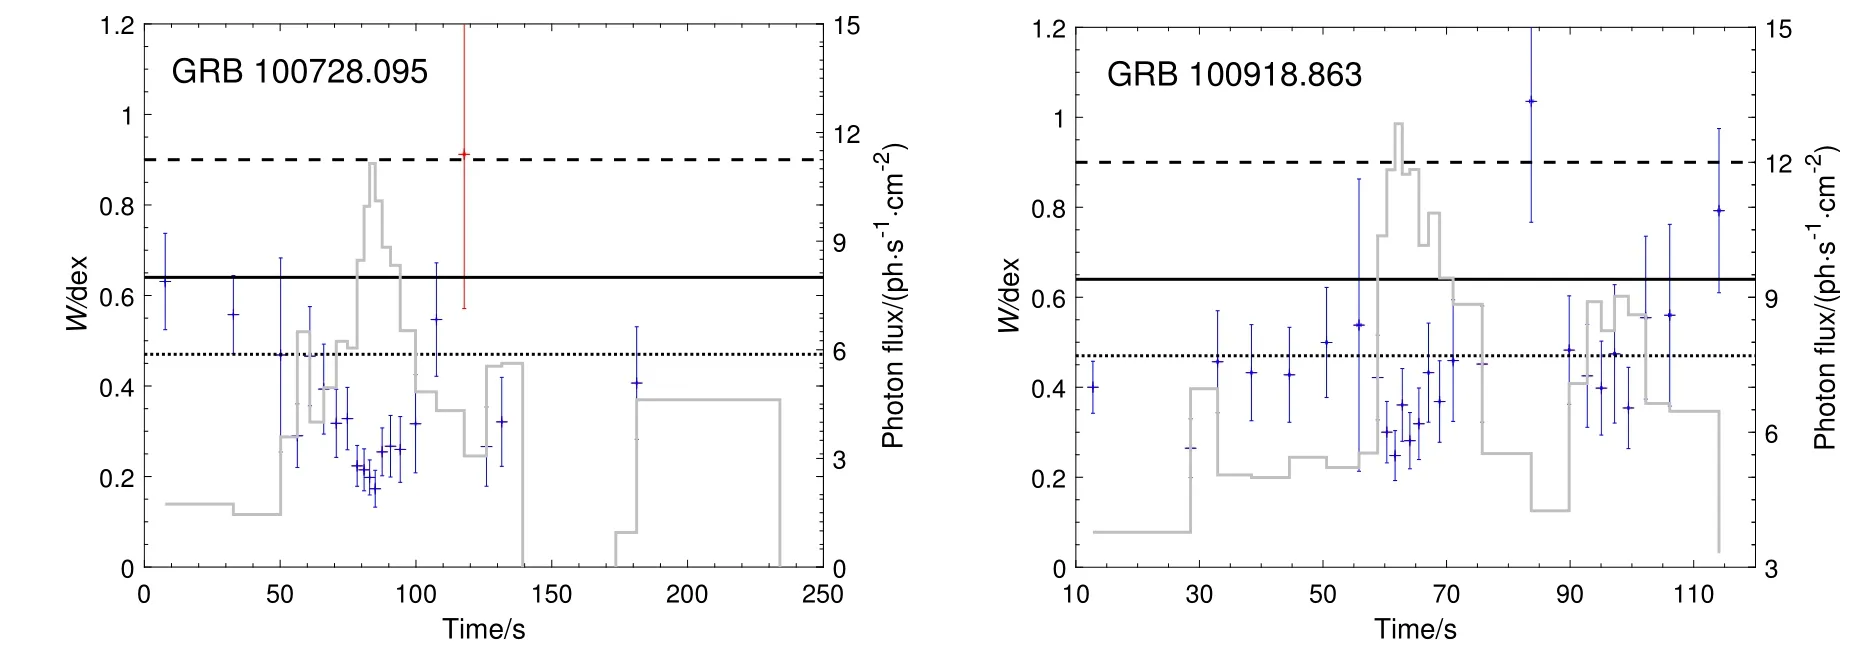
Fig.5 Continued

Fig. 5 Eight examples of evolutionary trends of W. The best-fit models are indicated by different colors, which are COMP(blue), BAND (green) and SBPL (red). The limits MES (dotted line), SP4 (solid line), PS (dashed line) and the 10 keV–1 MeV photon flux (gray histograms, right axis) are overlaid.
In GRB 120328.268 and GRB 120624.933,the spectra become narrower as time evolves. TheWvalues of the first 7 s in GRB 120328.268 are very large.It decreases from above the limit of PS to below the limit of single-electron,and finally remains approximately constant and forms a plateau.
In GRB 120204.054 and GRB 100322.045,the spectra become wider as time evolves. In GRB 120204.054, we note that the first time bin gives the largestW,thenWincreases from below singleelectron limit to above the SP4 model. During the 9–20 s of GRB 100322.045, the catalog bestfit model is power-law.We did not calculateWfor this period because the power-law model has no curvature.
In GRB 100414.097 and GRB 090719.063,Wremains approximately constant in the plateau.Violations of the synchrotron models are clearly shown in these two sample bursts.
In GRB 100728.095 and GRB 100918.863,the evolution ofWis chaotic. In GRB 100728.095,Wdecreases from the SP4 limit to below the singleelectron limit and then increases again to above the SP4 limit. In GRB 100918.863,Wfluctuates around the limit of MES and most of the spectra are compatible with the model MES (16 out of 26 spectra, 62%).
These 8 sample bursts are selected to denote the various evolutionary trends ofW: gradual decrease; gradual increase; remaining roughly constant in the plateau.In summary,Whas no general evolutionary trend with time. But in some samples, there is a weak anti-correlation between the curvature width and the photon flux within the pulses of the bursts. We choose the zoom-in figures of six bursts to show the evolutionary trend of this anti-correlation in Fig.6.For example,in GRB 100728.095, the photon flux increases first and then decreases with time, while the evolution of curvature width is opposite exactly.In addition,we also systematically check whether or not the relation betweenWand photon flux holds within these GRBs. In the above content we have obtainedWand photon flux values for 1198 spectra of 68 GRBs. Then we apply the Spearman rank correlation analysis to calculate the linear correlation coefficients (r) and chance probabilities (P) for each burst. The distribution ofrwithin 68 bursts is presented in Fig.7, and we find that about 60%of GRBs show this tight anti-correlation according tor <-0.50 andP <1×10⁻⁴.We show this relation of 9 sample bursts in Fig.8.It can be seen that the anti-correlation seems to be drawn mainly from the sample best fitted with the COMP model, this is because most of the samples (see Section 4.1) are COMP spectra. These results show that this anticorrelation holds within these GRBs well, which suggests that the higher flux, the sharper spectral break or the more deviating from the synchrotron models within a pulse.

Fig. 6 The evolutionary trend of the inverse correlation between W and photon flux with time in six sample bursts. The curvature width in the figure is derived only from COMP (black) spectrum. The limits MES (dotted line), SP4 (solid line), PS(dashed line) and the 10 keV-1 MeV photon flux (gray histograms, right axis) are overlaid.
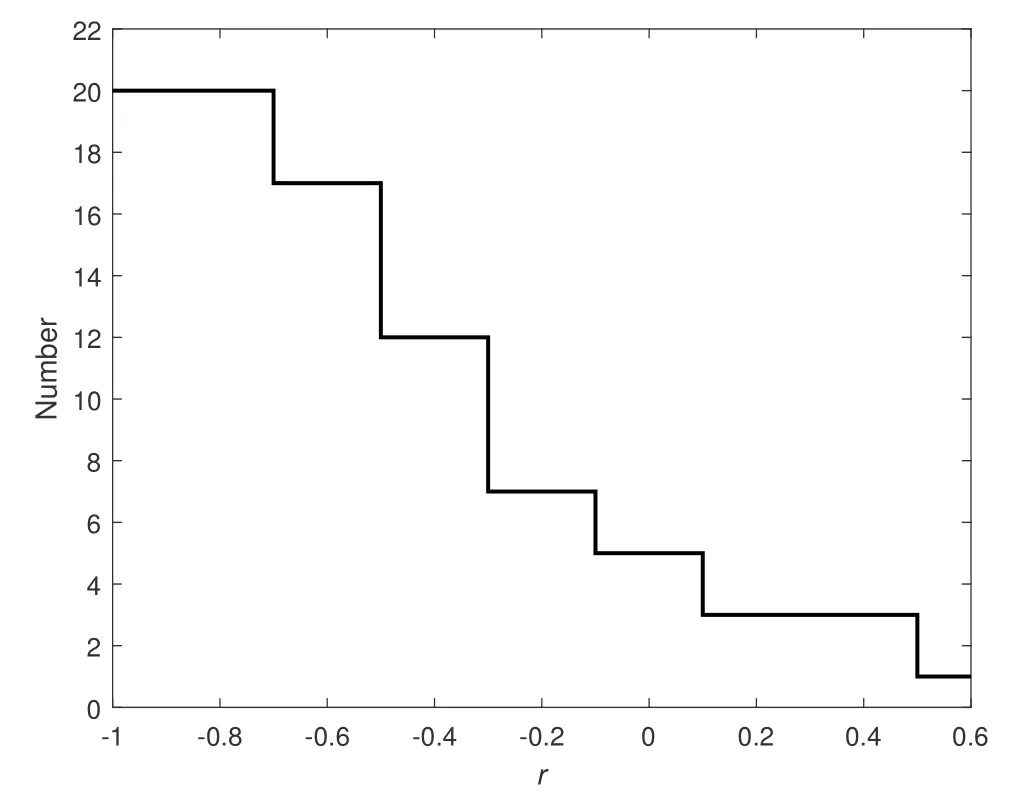
Fig. 7 Distribution of the linear coefficients for lg Pf -W,where Pf is the photon flux
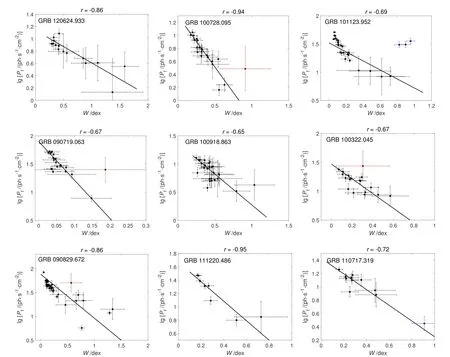
Fig. 8 The relation between observed photon flux and spectral curvature width. The headings in the figure indicate the values of the correlation coefficient r. The fitting models are indicated by different colors, which are COMP (black), BAND (blue),SBPL (red).
5 Summary and discussion
In this paper,we have introduced a new quantity, the curvature widthW, to describe the spectral break sharpness at around the (νFν) spectral peakEp.We compute the curvature widths of several typical theoretical synchrotron models and the best fit empirical models of a GRB sample and find that over 60%, 90% and 90% of the sample are incompatible with the MES, SP4 and PS models,respectively. The curvature widths of synchrotron models are generally much larger than those of data,which means the observed spectral break is too sharp, while the synchrotron model is smoother.At this point,the synchrotron emission model does not accommodate most of the data. For a single power-law electron synchrotron model, the slope ofp <4 leads to largerWand thus more inconsistent with the data.We also find that a small part of bursts best fitted by the BAND and SBPL models have similar curvature widths to those of the SP4 and PS models. In summary, these results suggest that the spectral break of data is too sharp while that of the synchrotron model is smoother. The synchrotron model does not accommodate the data better.In addition,we findWis anti-correlated with photon flux within the GRB pulse for more than half of the sample,although it has no general evolutionary trend in a whole burst. This suggests that the closer to the light curve peak, the sharper spectral break or the more deviating from the synchrotron models within a pulse.
Our results make it difficult to reconcile the synchrotron models and the data. As we know, if the spectral break of the data is smoother than that of the synchrotron model, then it can be easy to explain, since the electron distribution may not be a good power law or the distribution of broken power law is not a sharp connection as considered in this paper, so that the corresponding synchrotron spectral break will be smooth. Such electron distribution can be derived if the magnetic field decay of the emission region is considered[29-30]or acceleration process of the realistic electrons in shock is considered[38]. While the contrary case is hard to understand, because the superposed synchrotron emission from electron population would make any spectral break smoother, rather than sharper. Bear in mind that,the synchrotron emission from a single electron has an extended tail toward low energies with the slope of 1/3. On the other hand, it is possible that other processes we do not know are at work.Thus more sophisticated investigation in the synchrotron model is needed.
It needs to be noted that in the current results, a factor can affect our results. The bestfit empirical models are taken as a proxy of the data, which can introduce a bias that the properties of data are affected by the function forms of the best models themselves[39]. To reduce this effect, better models with more parameters are needed, or directly fit the GRB data with physical models[39-40]. However, such models are not favored due to the poorly constrained and highly cross-correlated parameters[3], which is essentially due to the limitation of the energy resolution of the current instruments.
As for the tight anti-correlation between the spectral curvature widthWand photon flux within a GRB pulse, the current results suggest that the closer to the peak of a pulse, the more deviating from the synchrotron models. Meanwhile,this implies that the spectral shape (W) is related to the flux of GRBs, this relation also supports the positive correlation between flux and lowenergy spectral slope (α) which is derived from a Bayesian GRB spectral catalog[41]report by Ref. [42] recently, and they argued a thermal origin for GRB prompt emission according to the correlation.Because the non-thermal synchrotron spectra are smoother, the observation spectra are sharper.
Appendix
Fitting functions and curvature expressions
The BAND model is composed by two power laws which are smooth connected. The BAND model is defined as[1]

and the curvature expression
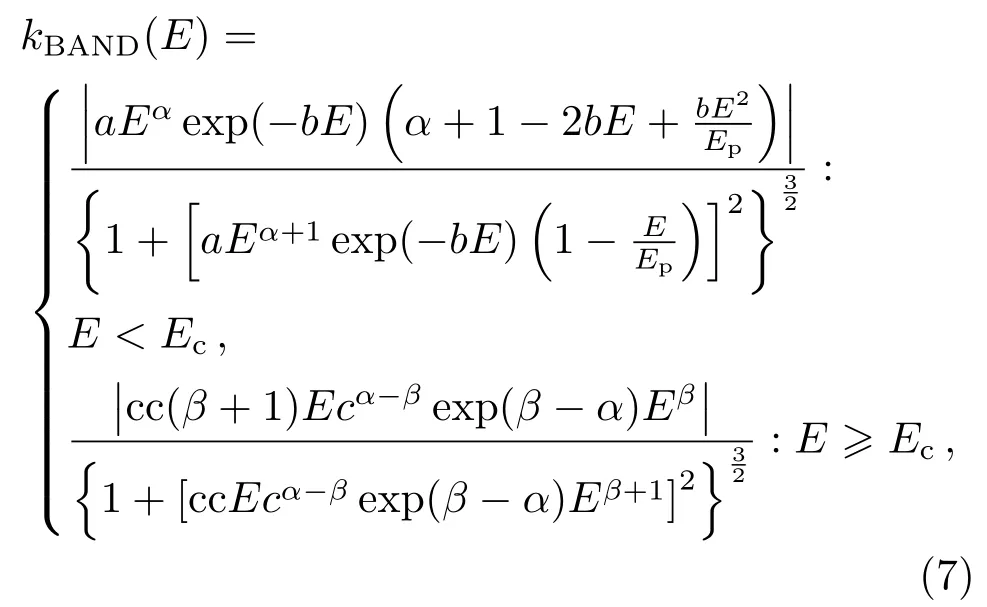
where

In Eqs. (6)–(8),Ais the normalization factor at 100 keV in units of ph·s-1·cm-2·keV-1,Eis the photon energy in units of keV,Ecis the characteristic energy in units of keV.
The COMP model is a special case of the BAND model (i.e.,β →-∞), it is a high-energy exponential cutoffwhich is defined as

and the curvature expression is
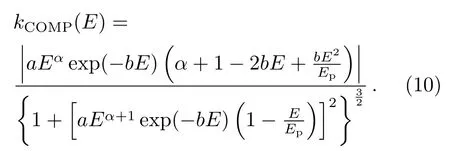
The smoothly broken power law (SBPL) is a model in which two power laws are connected by a smooth transition. The SBPL model were parameterized by Refs.[43]and[3],respectively.The SBPL function is defined as

and the curvature expression

where

In Eqs. (11)–(13),Ebis the break energy in units of keV, we use Δ=0.3 in our paper because in all Fermi GBM GRB catalogs it is fixed at 0.3.
