Investigation of paeonol-geniposide on acute alcoholic liver injury based on uniform design method
2022-03-16LIUKeLIUYulongSUNMinLIULinglingZHANGLuningYANGuiming
LIU Ke, LIU Yu-long, SUN Min, LIU Ling-ling, ZHANG Lu-ning, YAN Gui-ming
Anhui University of Chinese Medicine, Hefei 230012, China
Keywords:
ABSTRACT Objective: To explore the optimal ratio and compatibility effect of paeonol-geniposide combination on acute alcoholic liver injury by uniform design.Methods: Lieber-DeCarli alcoholic liquid feed was used to induce acute alcoholic liver injury in mice.Uniform design was used to select the best dosage combination of paeonol and geniposide, and the related indexes of liver injury and oxidative stress were detected by kit.Serum inflammatory factors were detected by ELISA, and the expressions of p38 MAPK, JNK and NF-κB P65 related proteins in liver were detected by Western-blot.Results: The regression equation suggested that paeonol: geniposide = 220: 20 was the best ratio of paeonol and geniposide to resist alcoholic liver injury.Compared with the model group, the liver injury indexes and oxidation products of the paeonol+geniposide group decreased significantly, the antioxidant activity of liver tissue increased significantly, and the expression levels of p-p38 MAPK, p-JNK and NF-κB P65 protein decreased significantly.Conclusion: The optimal dosage of paeonolgeniposide was effectively optimized by uniform design and pharmacodynamic analysis.The combination of the two drugs could reduce the alcoholic liver injury by reducing the oxidative stress injury and inflammatory response in the liver tissue of mice, and its effect might be related to the targeting of p38 MAPK/JNK/NF-κB channel.
1.Introduction
Alcoholic liver disease is a liver disease caused by long-term heavy drinking, with fatty liver at the initial stage and hepatitis,liver fibrosis and cirrhosis at the further development [1].At present,the incidence of alcoholic liver disease in China is increasing,and it has become one of the serious hazards to human health[2].Uniform design method can significantly reduce the number of trials when the range of test factors is large and the number of levels is large [3], and it is widely used in the optimization of Chinese medicine compatibility and extraction process of Chinese medicine.Paeonol (Pae) is an active ingredient extracted from the dried root bark of Paeonia suffruticosa and the dried root or whole grass of Xu Changqing.It has many pharmacological effects, such as antipyretic, anti-inflammatory, antibacterial, and analgesic [4,5].Geniposide (Gen), an active ingredient extracted from the dried and mature fruit of Gardenia jasminoides Ellis, has been proved to have the effects of protecting liver and gallbladder [6].Our previous research has revealed that paeonol has a good anti-alcoholic liver injury effect [7], but we are not sure whether the combination of paeonol and geniposide has a compatible effect.In this study, the uniform design method was used to explore the protective effects of the combination of paeonol and geniposide on alcoholic liver injury in mice, so as to provide new ideas for the study of the compatibility of Chinese medicine.
2.Materials and methods
2.1 Experimental animal
Male C57BL/6 mice (6 weeks old and weighing 20~25 g) were obtained from Hangzhou Ziyuan Experimental Animal Science and Technology Co., Ltd.(Certificate No.SCXK (Zhejiang) 2019-0004,Hangzhou, China).All the animals were approved by the Laboratory Animal Ethics Committee of Anhui University of Chinese Medicine[animal ethics number: AHUCM-mouse-2022041].
2.2 Experimental drug
Paeonol and geniposide (Lot No.X21A11S111651,S17O11Y127293) were purchased from Shanghai Yuanye Biotechnology Co., Ltd.(Shanghai, China).Silibinin capsule (Sil,Lot No.05010059) was purchased from Tianjin Tianshili Shengte Pharmaceutical Co., Ltd.(Tianjin, China).
2.3 Main reagents and instruments
2.3.1 Main reagents
Liquid control feed (TP4030C) and alcoholic liquid feed(TP4030D) were purchased from Nantong TLOF Feed Co., Ltd.(Lot No.20220223, Jiangsu, China).Alanine transaminase (ALT)test box, aspartate transaminase (AST) test box, triglyceride (TG)test box, total cholesterol (TC) temst box, reduced Glutathione(GSH) test box, catalase (CAT) ultraviolet (UV) test box, superoxide dismutase (SOD) test box and malondialdehyde (MDA) test box were all purchased from Nanjing Jiancheng Institute of Biotechnology (Lot No.20220309, 20220310, 20220310, 20220409,2021230, 20220526 and 20220526, Nanjing, China).Mouse IL-6,IL-1β, TNF- ELISA kits were purchased from Jiangsu Enzymefree Industry Co., Ltd.(Lot No.220563M, 220540M and 220532M,Jiangsu, China).P38MAPK rabbit anti-infective was purchased from Wuhan Sanying Biotechnology Co., Ltd.(Lot No.00107905,Wuhan, China).P38MAPK rabbit anti-infective was purchased from Wuhan Sanying Biotechnology Co., Ltd.(Lot No.00107905,Wuhan, China).GADPH mouse antibody was purchased from Zhongshan Jinqiao Biotechnology Co., Ltd.(Lot No.220040209,Beijing, China).P-p38MAPK rabbit antibody, NF-κB P65 mouse antibody, and HRP-labeled goat anti-rabbit IgG were all purchased from Chengdu Zhengneng Biotechnology Co., Ltd.(Lot No.LL0408, LL0223 and LL0425, Chengdu, China).HRP-labeled goat anti-mouse IgG was purchased from Aibixin (Shanghai)Biotechnology Co., Ltd.(Lot No.AS002, Shanghai, China).
2.3.2 Main instruments
K3 microplate reader and HM352 microtome were purchased from Thermo Fisher Scientific Shier Technology Company (Thermo,USA).OLYMPUS BX51 orthoscopic microscope was purchased from Shanghai Fulai Optical Co., Ltd.(Shanghai, China).DYY-6C electrophoresis apparatus was purchased from Beijing 61 Biotechnology Co., Ltd.(Beijing, China).Tanon 5200 automatic chemiluminescence imaging analysis system was purchased from Shanghai Tianneng Technology Co., Ltd.(Shanghai, China).
2.4 Experimental methods
2.4.1 Establishment of alcoholic live injury model
The mouse model of acute alcoholic liver disease was induced by using NIAAA (Nationwide Medication and Alcoholism) [8] and Lieber-DeCarli alcoholic liquid feed.During the modeling, except for the mice in the control group who were given the control liquid feed with free diet, those in other groups were given the alcohol liquid feed with free diet, and the fresh liquid feed was changed at 5:00 p.m.every day for 10 consecutive days.
2.4.2 Uniform design experimental scheme
According to the uniform design experimental method, paeonol and geniposide were taken as the investigation factors, and six levels were selected for each factor, corresponding to the daily dosage of mice.According to the previous experimental results of our research group and the relevant literature using safe dose [9], the dosage range of paeonol was set to be 50~300 mg/kg, and that of geniposide was set to be 20~120 mg/kg [10].The factors and levels were set according to Table U6(64) and the usage table, and a grouping table for uniformly designed experiments was obtained (Table 1).
A total number of 64 male C57BL/6 mice were randomly divided into the control group, model group, and evenly designed groups(Groups 1~6), with eight mice in each group.During modeling, the drugs were administered at 8:00 a.m.every day.According to the gavage volume standard of 1 mL/100 g, the corresponding drugs in each group were uniformly designed for gavage, and each drug was prepared with 0.5% CMC-Na solution.The rats in the control group and the model group were intragastrically administered with 0.5%CMC-Na solution.

Tab 1 Grouping of uniform design experiments
2.4.3 Verification experiment scheme
A total number of 48 male C57BL/6 mice were randomly divided into the control group, model group, Pae+Gen group (220 mg/kg paeonol +20 mg/kg geniposide), Pae group (220 mg/kg paeonol),Gen group (20 mg/kg geniposide), and Sil group (36.8 mg/kg silybin), with eight mice in each group.During the modeling period, the drugs were given at 8:00 a.m.on time every day, and according to the volume standard of 1 mL/100 g gastric perfusion,the corresponding drugs in each administration group were intragastrically administered with 0.5% CMC-Na solution in the control group and model group, respectively.
2.4.4 Determination of TC, TG, GSH, CAT, SOD, MDA in liver tissue
The liver tissues of mice in each group were mixed with normal saline for homogenization, and the homogenate was centrifuged to obtain the supernatant for later analysis.The protein concentration was determined with BCA kit, and the content of relevant indicators was determined according to the kit instructions.
2.4.5 Determination of serum ALT and AST
Serum was taken and measured according to the kit instructions.
2.4.6 HE staining of liver tissue
The liver tissue fixed with 4% paraformaldehyde was dehydrated,embedded in a paraffin embedding machine, and serially sectioned(4μm) into slices, which were then stained with hematoxylin-eosin(HE) staining.The pathological changes of the liver were observed under a light microscope and photographed.
2.4.7 Serum levels of IL-1β, IL-6 and TNF-α were measured by ELISA
Serum was taken and measured according to the kit instructions.
2.4.8 Expression of p38MAPK/NF-κB related protein in liver detected by Western-blot
The total protein in liver tissue of mice in each group was extracted with lysis solution for verification, and the BCA was quantified.After denaturation, it was separated with SDS-PAGE gel, transferred to PVDF membrane by wet method, and blocked for 2 h.The primary antibodies p38 MAPK (1:1 000), p-p38 MAPK (1:1 000),NF-κB (1:1 000), JNK (1:2 000), p-JNK (1:1 000), and GAPDH (1:2 000) were incubated overnight after TBST washing.They were taken out the next day.The secondary antibodies (1:5 000) were incubated after TBST washing for 1 h.After TBST washing, ECL color developing solution was used for color development and exposure.The gray scale of protein bands was analyzed by ImageJ software.
2.5 Statistical processing
All data were statistically analyzed using SPSS 23.0 software.Measurement data are all expressed as meas±standard deviations(S.D.).The comparison among groups was performed using oneway ANOVA Q test.First, the homogeneity test of variance was performed.For homogeneity of variance, the LSD (Lead-significant difference) test was used, and for heterogeneity of variance,Games-Howell test was used, and P<0.05 indicated statistically significant difference.In the uniform design experiment, DPS7.05 data processing system was used for quadratic polynomial stepwise regression analysis.
3.Results
3.1 Effects of uniform design each groups on liver histopathology in mice
HE staining was performed on the liver of mice in each group with uniform design, and it was found that in the control group, the structures of hepatic sinusoids and hepatic lobules were intact, the hepatic cords were arranged neatly, and the cytoplasm of hepatocytes was uniform.Compared with the control group, the sinusoids and lobules of the liver in the model group were significantly damaged,and the hepatic cords were loosely arranged, with different sizes of fat droplets and focal inflammatory response cell infiltration visible.Compared with the model group, the liver histopathological changes in Groups 1 to 6 were improved to varying degrees, with reduced fat droplets and weakened inflammation (Figure 1).

Fig 1 The liver pathological staining of mice in each uniform designed group(HE×200)
3.2 Effects of uniform design groups on liver lipid levels in mice
Compared with the control group, the liver TC and TG contents in the model group were significantly increased (P<0.001) (Table 2).The contents of TC and TG in the mouse liver tissue were taken as the dependent variables Y1and Y2respectively, and geniposide and paeonol as the independent variables x1and x2.To obtain the fitting equation: Y1=0.151 8-0.000 918x2+0.000 001 48x12+0.000 002 07x22+0.000 000 38x1x2(adjusted r12=0.874, P<0.001).The efficacy was expected to be the best when x1=20 mg/kg and x2=220 mg/kg.Y2= 0.663 2-0.001 14x2+0.000 024 3x12+0.000 002 9x22-0.000 005 655x1x2(adjusted r22=0.65, P<0.01), where x1=25.6 mg/kg and x2=220 mg/kg,the effect isexpected to beoptimal.Since r12>r22,x1=20 mg/kg andx2=220 mg/kg were finallyselectedasthe optimal dosage forthe combination.
Tab 2 Liver injury indicators of each uniform designed group (mmol/L, n=6, ±s)
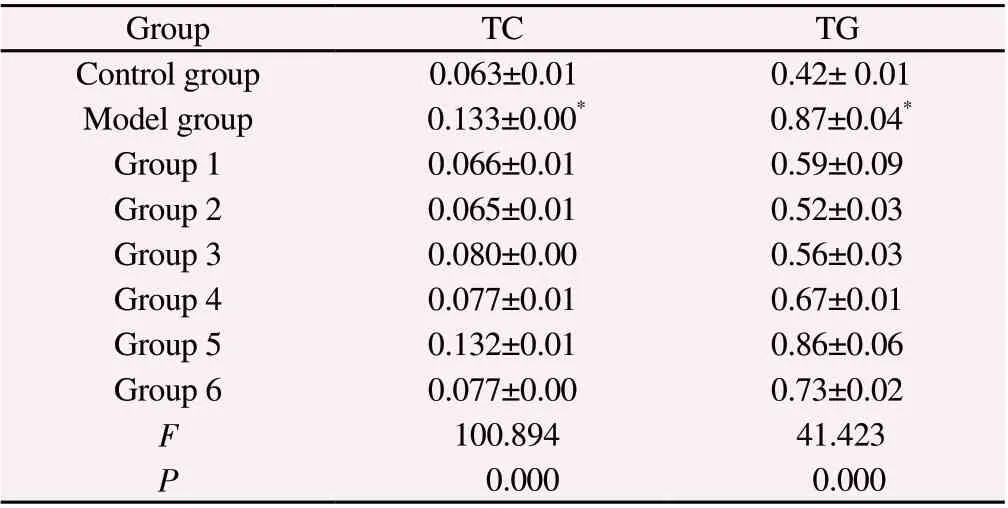
Tab 2 Liver injury indicators of each uniform designed group (mmol/L, n=6, ±s)
Group TC TG Control group 0.063±0.01 0.42± 0.01 Model group 0.133±0.00* 0.87±0.04*Group 1 0.066±0.01 0.59±0.09 Group 2 0.065±0.01 0.52±0.03 Group 3 0.080±0.00 0.56±0.03 Group 4 0.077±0.01 0.67±0.01 Group 5 0.132±0.01 0.86±0.06 Group 6 0.077±0.00 0.73±0.02 F 100.894 41.423 P 0.000 0.000
3.3 Effects of verification experiment each groups on liver histopathology in mice
The liver tissues of the control group and the model group were similar to those of the uniform design experiment in pathology.Compared with the model group, the fat droplets in the liver tissues of the Sil group, the Pae group, the Gen group and the Pae+Gen group were decreased, the inflammatory area was decreased, and the liver cords were arranged in a more orderly manner.Compared with the Pae group and the Gen group, the inflammatory areas in the Pae+Gen group were reduced, and the liver cords were relatively arranged neatly (Figure 2).
3.4 Effects of verification experiment each groups on liver injury indicators in mice
Compared with the control group, the contents of TC and TG in the liver homogenate and the activities of ALT and AST in the serum of the model group were significantly increased (P<0.001).Compared with the model group, the contents of TG, ALT and AST in the Pae group were significantly reduced (P<0.05, P<0.001).The contents of TC, ALT and AST in the Gen group were significantly reduced(P<0.01, P<0.05).The contents of TC, TG, ALT and AST in the Sil group and the Pae+Gen group were significantly reduced (P<0.01,P<0.001).Compared with the Pae group, the TC, ALT and AST contents in the Pae+Gen group were significantly reduced (P<0.05).Compared with the Gen group, the TG content of the Pae+Gen group was significantly reduced (P<0.001, Table 3).

Fig 2 Pathological change of mouse liver tissue in each verification experimental group (HE×200)
Tab 3 Related indicators of mouse liver injury in each verification experimental group (n=6, ±s)

Tab 3 Related indicators of mouse liver injury in each verification experimental group (n=6, ±s)
Note: Compared with the control group, *P<0.001; Compared with the model group, △P<0.05, △△P<0.01, △△△P<0.001; Compared with Pae group, ▲P<0.05;Compared with Gen group, ◇P<0.001.
Group TG(mmol/g) TC(mmol/g) ALT(U/L) AST(U/L)control group 0.35±0.02 0.048±0.070 15.59±4.42 32.18±0.85 model group 0.73±0.02* 0.094±0.016* 38.29±5.61* 94.15±3.92*Sil group 0.40±0.02△△△ 0.065±0.008△△ 24.13±2.00△△ 45.03±7.50△△△Pae group 0.49±0.06△△△ 0.084±0.006 30.17±6.76△ 52.81±5.00△△△Gen group 0.70±0.06 0.068±0.008△ 22.88±2.51△△ 47.07±8.66△△△Pae+Gen group 0.45±0.02△△△◇ 0.060±0.013△△▲ 21.11±2.99△△△▲ 41.99±6.41△△△▲F 45.154 7.759 9.675 39.532 P 0.000 0.002 0.001 0.000
3.5 Effects of verification experiment each groups on liver oxidative stress-related indicators in mice
Compared with the control group, the activities of GSH, CAT and SOD in liver homogenate of mice in model group decreased significantly (P<0.01), and the content of MDA increased significantly (P<0.01).Compared with the model group, the activities of GSH and CAT in Pae group increased significantly(P<0.01), and the content of MDA decreased significantly (P<0.01).The content of MDA in Gen group decreased significantly (P<0.05).The activities of GSH, CAT and SOD in Sil group and Pae+Gen group increased significantly (P<0.05), while the content of MDA decreased significantly (P<0.01).Compared with Pae group, the activities of CAT and SOD in Pae+Gen group increased significantly(P<0.01, P<0.05).Compared with Gen group, the activities of CAT and GSH in Pae+Gen group were significantly higher (P<0.01,P<0.05, Table 4).
Tab 4 Antioxidant related indexes of mice in each verification experimental group (n=6, ±s)
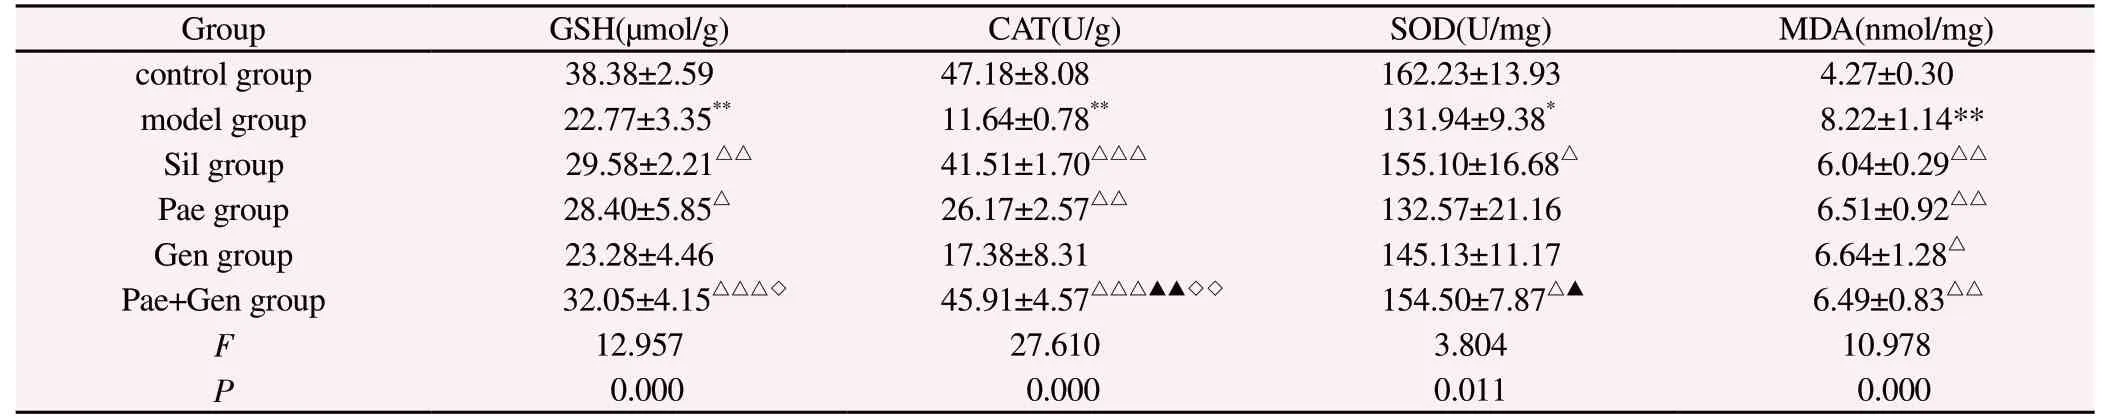
Tab 4 Antioxidant related indexes of mice in each verification experimental group (n=6, ±s)
Note: Compared with the control group, *P<0.01, **P<0.001; Compared with the model group, △P<0.05, △△P<0.01, △△△P<0.001; Compared with Pae group,P<0.05, ▲▲P<0.01; Compared with Gen group, ◇P<0.01, ◇◇P<0.001.
Group GSH(μmol/g) CAT(U/g) SOD(U/mg) MDA(nmol/mg)control group 38.38±2.59 47.18±8.08 162.23±13.93 4.27±0.30 model group 22.77±3.35** 11.64±0.78** 131.94±9.38* 8.22±1.14**Sil group 29.58±2.21△△ 41.51±1.70△△△ 155.10±16.68△ 6.04±0.29△△Pae group 28.40±5.85△ 26.17±2.57△△ 132.57±21.16 6.51±0.92△△Gen group 23.28±4.46 17.38±8.31 145.13±11.17 6.64±1.28△Pae+Gen group 32.05±4.15△△△◇ 45.91±4.57△△△▲▲◇◇ 154.50±7.87△▲ 6.49±0.83△△F 12.957 27.610 3.804 10.978 P 0.000 0.000 0.011 0.000
3.6 Effects of verification experiment each groups on the levels of hepatic inflammatory factors in mice
Compared with the control group, the serum levels of IL-1β,IL-6, and TNF-α in the model group were significantly increased(P<0.001).Compared with the model group, serum IL-1β, IL-6, and TNF-α levels in the Sil group, Pae group, Gen group, and Pae+Gen group were significantly reduced (P<0.05, P<0.01).Compared with the Pae group, serum IL-1β, IL-6, and TNF-α levels of the Pae+Gen group were decreased, but the difference was not statistically significant (P>0.05).Compared with the Gen group, the serum IL-1β and IL-6 levels of the Pae+Gen group were decreased, and the TNF- level was increased, but the difference was not statistically significant (P>0.05, Table 5).
Tab 5 Levels of inflammatory factors in mice of each verification experimental group (n=6, ±s)
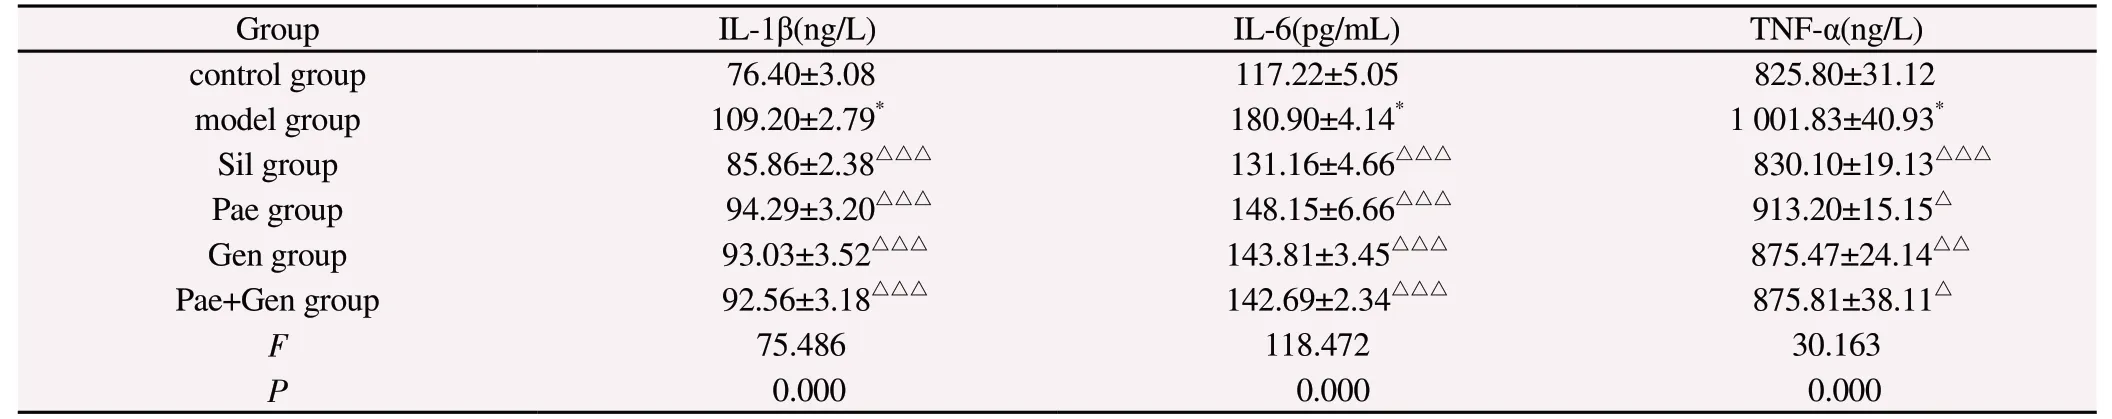
Tab 5 Levels of inflammatory factors in mice of each verification experimental group (n=6, ±s)
Note: Compared with the control group, *P<0.001; Compared with the model group, △P<0.05, △△P<0.01, △△△P<0.001.
Group IL-1β(ng/L) IL-6(pg/mL) TNF-α(ng/L)control group 76.40±3.08 117.22±5.05 825.80±31.12 model group 109.20±2.79* 180.90±4.14* 1 001.83±40.93*Sil group 85.86±2.38△△△ 131.16±4.66△△△ 830.10±19.13△△△Pae group 94.29±3.20△△△ 148.15±6.66△△△ 913.20±15.15△Gen group 93.03±3.52△△△ 143.81±3.45△△△ 875.47±24.14△△Pae+Gen group 92.56±3.18△△△ 142.69±2.34△△△ 875.81±38.11△F 75.486 118.472 30.163 P 0.000 0.000 0.000
3.7 Effects of Verification experiment Each Groups on the Levels of p38 MAPK/JNK/NF-κB pathway related protein in Mice
Compared with the control group, the expressions of NF-κB P65,p-p38 MAPK/p38 MAPK and p-JNK/JNK proteins in the liver tissue of the model group were significantly increased (P<0.001, P<0.05).Compared with the model group, the protein expression levels of NF-κB P65, p-p38 MAPK/p38 MAPK and p-JNK/JNK in the Sil group, Pae group, Gen group and Pae+Gen group were significantly reduced (P<0.001, P<0.05).Compared with the Pae group and Gen group, the expressions of NF-κB P65, p-p38 MAPK/p38 MAPK and p-JNK/JNK proteins in the Pae+Gen group were decreased without statistical difference (P>0.05, Figure3).
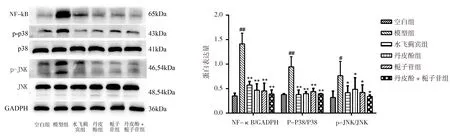
Fig 3 Detection of p38 MAPK/JNK/NF-κB related protein in liver by Western-blot
4.Discussion
Uniform design method is a test design method that only considers the uniform distribution of test points within the test range.The number of trials was reduced when the uniform design method was used to compare the advantageous dose distributions of the active ingredients in Chinese medicine compared with the traditional orthogonal design method.Factor level can be adjusted appropriately; The quantitative regression equation can be obtained for analyzing the influence of each factor on the test results.It can quantitatively predict the advantages such as interval estimation of the optimal dose proportion of Chinese medicinal compound prescriptions [11].The number of experiments with uniform design was equal to the level number, and it had more advantages in the study of Chinese medicine compound proportion with larger number of ingredients, which not only reduced the test cost, but also reduced the test conditions and shortened the test period.Therefore, uniform design method has certain advantages as a modern technical method to reveal the relationship between the pharmacological effects of Chinese medicinal compounds and the effective active components of Chinese medicinal materials.From the perspective of traditional Chinese medicine theory, the combination of Cortex Moutan and Fructus Gardeniae can supplement each other.Both qi and blood can be treated in the same way, with the effects of cooling rather than clotting, and being active rather than rash, thus enhancing the effects of clearing liver, draining heat and cooling blood [12].In this experiment, uniform design and pharmacodynamic analysis were used to explore the optimal advantageous dose of paeonol and geniposide in combination, which not only enhanced the effect of single drug, but also explored the possible mechanism of Chinese medicine in the treatment of alcoholic liver disease, providing a theoretical basis for clinical use.
Acute alcoholic liver injury is the initial stage of alcoholic liver disease.Most of the alcohol intake in the human body is metabolized in the liver.Excessive alcohol intake will hinder lipid metabolism in the liver, leading to lipid accumulation [13].Serum ALT and AST are important enzymes to assess liver injury, and liver injury will lead to a significant increase in serum ALT and AST content [14].Alcohol intake will also lead to the imbalance between oxidation and oxidation resistance in the liver, consuming antioxidant enzymes such as SOD, CAT, and GSH, and increasing the content of MDA, a product of lipid peroxidation [15].
P38 MAPK and JNK, as important components of mitogenactivated protein kinase (MAPK) signaling pathway, can be activated by phosphorylation under the stimulation of inflammatory factors,oxidative stress, and others.After activation, they can increase the release of inflammatory factors, playing an important role in the inflammatory response of alcoholic hepatitis [16].As a transcription factor, NF-κB P65 can be activated by p-p38 MAPK and plays a central role in the inflammation process.It regulates the transcription and synthesis of inflammatory factors such as TNF-α, IL-6, and IL-1β, and induces the inflammatory response in the body [17].The inflammatory reaction was the key link in the development of alcoholic hepatitis.Inhibition of the activation of p38 MAPK, JNK,and NF-κB proteins would alleviate the process of alcoholic liver injury.
Our previous study found that paeonol had a good preventive effect on inflammatory injury caused by alcoholic fatty liver disease [18].Geniposide has good lipid-lowering and anti-inflammatory effects on non-alcoholic fatty liver in rats [19].In this study, by uniform design and regression analysis, it was concluded that paeonol (220 mg/kg) plus geniposide (20 mg/kg) was the best combined dose for anti-alcoholic liver injury.Further verification experiments showed that the Pae+Gen group could significantly reduce the content of TG, TC and MDA in liver tissue and the activity of serum ALT and AST, significantly improve the activity of GSH, CAT and SOD in liver tissue, reduce the level of serum inflammatory factors in mice, and down-regulate the expression of NF-κB P65, p-p38 MAPK and p-JNK proteins in liver tissue.These results suggested that the combination of paeonol and geniposide could reduce the inflammatory response of alcoholic liver injury in mice, and its effect might be related to the targeting of p38 MAPK/JNK/NF-κB channel.However, its mechanism is still unclear and needs to be further explored.Paeonol, as one of the main active components of Cortex Moutan, protects the liver mainly through anti-inflammation and anti-oxidation [20], and it accounts for more in the optimal dosage, which may be related to its prominent anti-oxidation effect.Geniposide, as one of the main active components of Fructus Gardeniae, has a good anti-inflammatory effect on alcoholic liver injury, and can reduce the level of products of lipid peroxidation damage.
In this experiment, there was a certain limitation in the optimization of the optimal ratio of paeonol and geniposide for the anti-alcoholic liver injury, which failed to comprehensively consider the effects of various indicators and made the synergistic effect of the combination of the two drugs not significant.Further exploration of the optimal dose of the combination of the two drugs combined with in vitro experiments is needed in the future to contribute to the clinical research of Chinese medicine.
In summary, using uniform design method and combining with pharmacodynamic analysis, it was concluded that paeonol (220 mg/kg) plus geniposide (20 mg/kg) was the optimal dose combination for the anti-alcoholic liver injury, and it could improve the antioxidant capacity of mouse liver tissue, reduce the level of lipid peroxidation, and reduce inflammatory response to reduce alcoholic liver injury, which might be related to the effect of targeting p38 MAPK/JNK/NF-κB channel.
Author's contribution:
Experimental design was written by communication author Yan Gui-ming, animal modeling and experimental technical guidance were given by Liu Ke, Liu Yu-long and Sun Min, and dosing intervention and experimental index detection were given by Liu Ke, Liu Ling-ling and Zhang Lu-ning.First author Liu Ke wrote the article.
All author declare no conflict of interest.
杂志排行
Journal of Hainan Medical College的其它文章
- Advances in pharmacological action of bergamot lactone
- Progress of improvement of pain and joint function of knee osteoarthritis treated with thunder-fire moxibustion in the last five years
- Abnormal expression of TGFβ1 in acute myeloid leukemia and its regulation effect on leukemia cells
- Analysis of key pathogenic target genes of ovarian cancer and experimental verification of cells in vitro
- Effect of Drynaria total flavonoids on the expression of NMDAR1,GluR2 and CaMK Ⅱ in the brain of hydrocortisone model mice
- Screening and functional analysis of the long-range interaction elements of β-globin genes