Spatial and Temporal Validation of In-Situ and Satellite Weather Data for the South West Agricultural Region of Australia
2022-03-12TristanCAMPBELLandPeterFEARNS
Tristan CAMPBELL and Peter FEARNS
1 Centre for Mine Site Restoration, Curtin University of Technology, WA 6102, Australia
2 Remote Sensing and Satellite Research Group, Curtin University of Technology, WA 6102, Australia
ABSTRACT
Key words: Australian Water Availability Project, land surface temperature, satellite precipitation, validation
1. Introduction
Variations in weather conditions have a significant effect on crop yields, with simplistic crop yield models based on minimum and maximum temperature and precipitation data that are able to describe significant proportions of variances in crop yield (Lobell et al., 2007;Chen et al., 2014; Kheiri et al., 2017). Effects of weather on crop yields can be nonlinear and asymmetric, with differences in maximum temperature of as little as 2°C having a large impact on yields (Schlenker and Roberts,2009). This nonlinear and asymmetric relationship has also been demonstrated for non-cereal agricultural production, such as modeling the production of honey from mature native forests, with floral bud initiation having precise temperature thresholds and precipitation during flowering having a step-wise impact on honey harvest weight (Campbell et al., 2020).
Due to these sensitivities, the accuracy of weather data is an important consideration in data selection for input into both qualitative and quantitative crop yield models.There are a variety of weather datasets commonly available, ranging from in-situ weather stations to satellitebased remote sensing products.
In-situ weather stations are commonly regarded as a source of accurate data for their spatial location, but even scientific-grade weather station temperature gauges such as those used for national scale climate monitoring networks in the United States of America can have inherent instrument errors of ±0.2°C (Lin and Hubbard, 2004).Likewise, precipitation gauges have inherent limitations with, for example, wind having potentially significant effects on the volume of precipitation entering the gauge(Førland et al., 1996). To minimize the effects of location and installation characteristics, it is important for weather station networks to have individual stations installed according to common standards, such as those defined by Canterford (1997).
Efforts have been made to improve the ability of weather station networks to capture spatial variability. In Australia, for example, the Australian Water Availability Project (AWAP) developed national gridded datasets for rainfall, temperature, and vapour pressure that integrate topographic effects between weather stations to the interpolation process (Jones et al., 2009).
Satellite-derived measurements of weather offer the advantage of spatially continuous datasets, which is particularly important when in-situ weather stations are sparse; however the performance can vary widely depending on the weather conditions, landform, and land use types (Mendelsohn et al., 2007).
Retrieval of land surface temperature (LST) parameters from satellite remote sensing data primarily utilizes the thermal infrared (TIR) bands and correcting the data for atmospheric, angular, and emissivity effects (Dash et al., 2004). Validation of the Copernicus LST data, created and distributed by the European Space Agency(Martins et al., 2020) from theHimawari-8satellite operated by the Japanese Aerospace Exploration Agency(JAXA), established a root-mean-square error (RMSE)for the LST product of 2.37°C over Japan, with a bias of−0.55°C over a temperature range from −5 to 33°C(Freitas et al., 2017). Validation studies of this product over a wider geographic region (from Japan to Australia)found similar accuracies, with an RMSE of 2.29°C and bias of −0.70°C from Li et al. (2020) and an RMSE of 3.6°C and bias of −0.1°C by Martins et al. (2018). This last study noted that there was an increasing positive bias for temperatures above 35°C (the temperature range in the study was from −10 to 40°C). It is important to note that these studies relied primarily on validation against other satellite-derived LST products, with limited in-situ weather station validation.
Satellite measurement of precipitation typically uses a combination of passive microwave (PMW) and infrared(IR) data. The Global Satellite Mapping of Precipitation(GSMaP) product produced by JAXA (Kubota et al.,2007) has used data from theHimawari-8satellite since 2015 and includes a suite of products, from near realtime (GSMaP-N), vector filtered data (GSMaP-M), and rain-gauge calibrated products (GSMaP-G). Generally,satellite precipitation products will overestimate precipitation at low rainfall rates and underestimate high rainfall rates (Habib et al., 2012; Ning et al., 2017). Rainfall type can also affect satellite precipitation accuracy, for example cold frontal rainfall events were measured less accurately in Australia than other rainfall types, which indicate a potential seasonal variance in accuracies (Chua et al., 2020).
This study provides a detailed validation of the spatial and seasonal variations in accuracy of temperature and precipitation data from ground-based in-situ and gridded products and satellite products for the South West Agricultural Region of Australia (SWAR; Data WA, 2018).The region contains a weather station network operated by the national Bureau of Meteorology (BOM), which is used to create interpolated gridded products and to calibrate satellite products, as well as an independent weather station network operated by the state’s Department of Primary Industries and Regional Development (DPIRD,2018) to provide improved spatial coverage of weather stations for agricultural producers. While this region has been included in national-scale assessments of weather products (Chua et al., 2020), there has been limited assessment of the accuracy variability across this 350,000-km2area, which accounts for 95% of Western Australia’s$10 billion AUD in agricultural production (Australian Bureau of Statistics, 2020), despite covering less than 12% of the state’s land area.
2. Materials and methods
2.1 Study area
The SWAR is the main agricultural region of Western Australia and extends almost 1000 km to the north from the south coast of the continent, and almost 1000 km to the east from the west coast (Fig. 1).
The region covers five classifications of the Köppen–Geiger climate classification system (Peel et al.,2007), from the hot, arid steppe environment (BSh) in the north to the warm temperate, fully humid, warm summer(Cfb) along the south coast to the cold, to the arid steppe environment (BSk) to the east. The regions are clarified by DPIRD into crop variety testing zones (CVTs) based on temperature and rainfall contours. In Fig. 1, the rainfall regions range from low in the inland areas (< 325-mm average annual rainfall, designated as “L” in Fig. 1)to very high near the coast in the southwestern quadrant of the region (> 750-mm average annual rainfall, designated as “VH” in Fig. 1). Temperature zones range from average annual temperature of greater than 28°C in the north (Zone 1) to less than 24°C in the south (Zone 5).
While the general weather patterns for the region are warmer, drier summers and cooler, wetter winters, rainfall patterns since 1997 have seen a marked decrease in autumn, winter, and spring rainfall (Charles et al., 2010).Regional climate projections for the next few decades indicate a continued drying trend during these seasons,with increased localized summer rainfall events and overall increasing temperatures and increased likelihood of extreme temperature events (Andrys et al., 2017).
2.2 Datasets
The temperature and precipitation datasets for the data validation are selected based on the following characteristics:
1) Data availability, such that users can freely access both current and historical data;2) Dataset longevity:
• Historic data available over a sufficient period to assess the accuracy (the period 2015–2019 for this study);
• Data provided by government entities with historic,current, and future data anticipated to be freely available for future users;
3) Spatial resolution of maximum 10-km cell size for detailed analysis for individual farm use for medium to large landholders (rather than broader regional use).
2.2.1Ground-based measurements
Both BOM and DPIRD have weather station networks in the region with online portals for searching and retrieval of data (Bureau of Meteorology, 2021a; Campbell, 2021), thus meeting the three criteria above. With the BOM weather stations being used for the calibration of several satellite datasets, as well as the generation of inter-station gridded products, the DPIRD weather station network is selected as the baseline for the validation process for this study as the BOM weather station network is utilized in calibration of almost all the other datasets.
2.2.2Ground-based interpolation dataset
As mentioned in the Introduction, BOM has developed an approach for interpolation of in-situ temperature and precipitation data across Australia that incorporates some of the factors that affect these measurements between stations, such as topography (Jones et al., 2009).Grids of interpolated weather data are available for download from Bureau of Meteorology (2021b).
Cross-validation of these datasets across Australia by Jones et al. (2009) calculated RMSEs of monthly maximum and minimum temperature between 0.5 and 1.0°C for the SWAR (national average RMSE 1.6 and 1.5°C, respectively). Cross-validation of the monthly rainfall data across the SWAR gave an RMSE between 10 and 25 mm, against a national average RMSE of 24.7 mm.
2.2.3Satellite-derived LST
While daily maximum and minimum LST data are available globally on scales of 1 km or less from platforms such as the Moderate Resolution Imaging Spectroradiometer (MODIS; Zhu et al., 2017), these measurements are only recorded a few times per day. As a result,they are not reliable measures of the actual daily maximum or minimum as the time of these maxima and minima do not coincide with the time of satellite overpass. Therefore, the hourly Copernicus LST dataset was used for LST (Martins et al., 2020), with the daily maxima and minima extracted and used to calculate the monthly average maximum and minimum temperature. While the spatial resolution of this dataset is coarser than products such as MODIS MOD11 LST product (5 km compared to 1 km, respectively), the significantly higher temporal resolution of the hourly Copernicus LST more reliably captures the maximum and minimum temperature. The Copernicus hourly LST data are available from European Commission Joint Research (2021).
While validation of the Copernicus LST product for the coverage of theHimawari-8satellite gives an RMSE of less than 3°C, it has been noted by Martins et al.(2018) that there is an increasing positive bias above 35°C but this is not quantified. It is therefore expected that for this work a bias-correction would need to be applied to the LST maximum temperature data, particularly in the summer months.
2.2.4Satellite-derived precipitation
While there are a number of global precipitation products derived from satellite data, such as the Climate Prediction Center morphing method (CMORPH; Joyce et al., 2004) and Indian National Satellite (INSAT) Multispectral Rainfall Algorithm (IMSRA), these have resolutions of 0.25°, which are quite coarse when considering local variations in rainfall. Accordingly, the GSMaP products from the JAXA were selected for this study(Kubota et al., 2007). The GSMaP data are available from JAXA (2021). Hereafter, the near real-time GSMaP product is referred to as “GSMaP-N” and the rain gaugecorrected product as “GSMaP-G” if not qualified as the gauge—corrected product.
2.3 Methods
For validation of the products, the statistical methods described in Table 1 were used to compare each of the weather datasets against the DPIRD weather station data as the verification dataset, with all datasets aggregated to monthly values over the period January 2015–December 2019 inclusive. Based on the proximity principle, where a single gauge station can reflect the same rainfall pattern in the surrounding area (Wang et al., 2021), and the relatively high spatial resolution of the gridded and satellite temperature products (5-km grid/pixel size), nearest neighbor analysis was used to compare the weather datasets with the relevant DPIRD weather station data. As the objective of assessing both the BOM weather station data and the BOM gridded weather products was to determine the effectiveness of the gridding process, nearest neighbor analysis was also used for comparing the DPIRD and BOM weather stations.
The validation was performed initially on the aggregate of all monthly data over the 2015–2019 period. The same validation statistics were generated from all monthly data over the period for each DPIRD station to assess spatial variability of accuracy for each weather dataset. The same analysis (aggregate and spatial) was also performed for each month of the year for each DPIRD station to assess seasonal variations in accuracy.
Due to the expected mean bias (MB) of the Copernicus LST product for temperatures greater than 35°C(Martins et al., 2018), a bias-corrected Copernicus LST dataset was calculated by applying a linear bias correction. The bias correction was derived from linear regression model between the daily error of the Copernicus maximum temperature and nearest DPIRD station, and the daily maximum Copernicus temperature (see Fig. 2).An assessment of the bias for the daily minimum temperature was also performed. This assessment gave a significantly lower correlation coefficient compared to the daily maximum temperature but overall showing a strong negative bias. Accordingly, a linear bias-corrected dataset was also calculated for the Copernicus LST daily minimum temperature data. Hereafter, the bias-corrected Copernicus LST data are referred to as “Copernicus_LST_BC,” if not explicitly described as such.
3. Results
3.1 Statistical comparisons of accuracy
The comparisons of statistical analysis of the temperature and precipitation products are shown in Tables 2 and 3, respectively. These summaries show that the BOM gridded products generally had the lowest errors for the three weather parameters assessed (monthly average minimum and maximum temperature, and monthly precipitation). The BOM weather stations generally performed second best out of the four data sources for each weather property, with the gridding process used byBOM reducing the MAE, RMSE, and median error in all datasets.
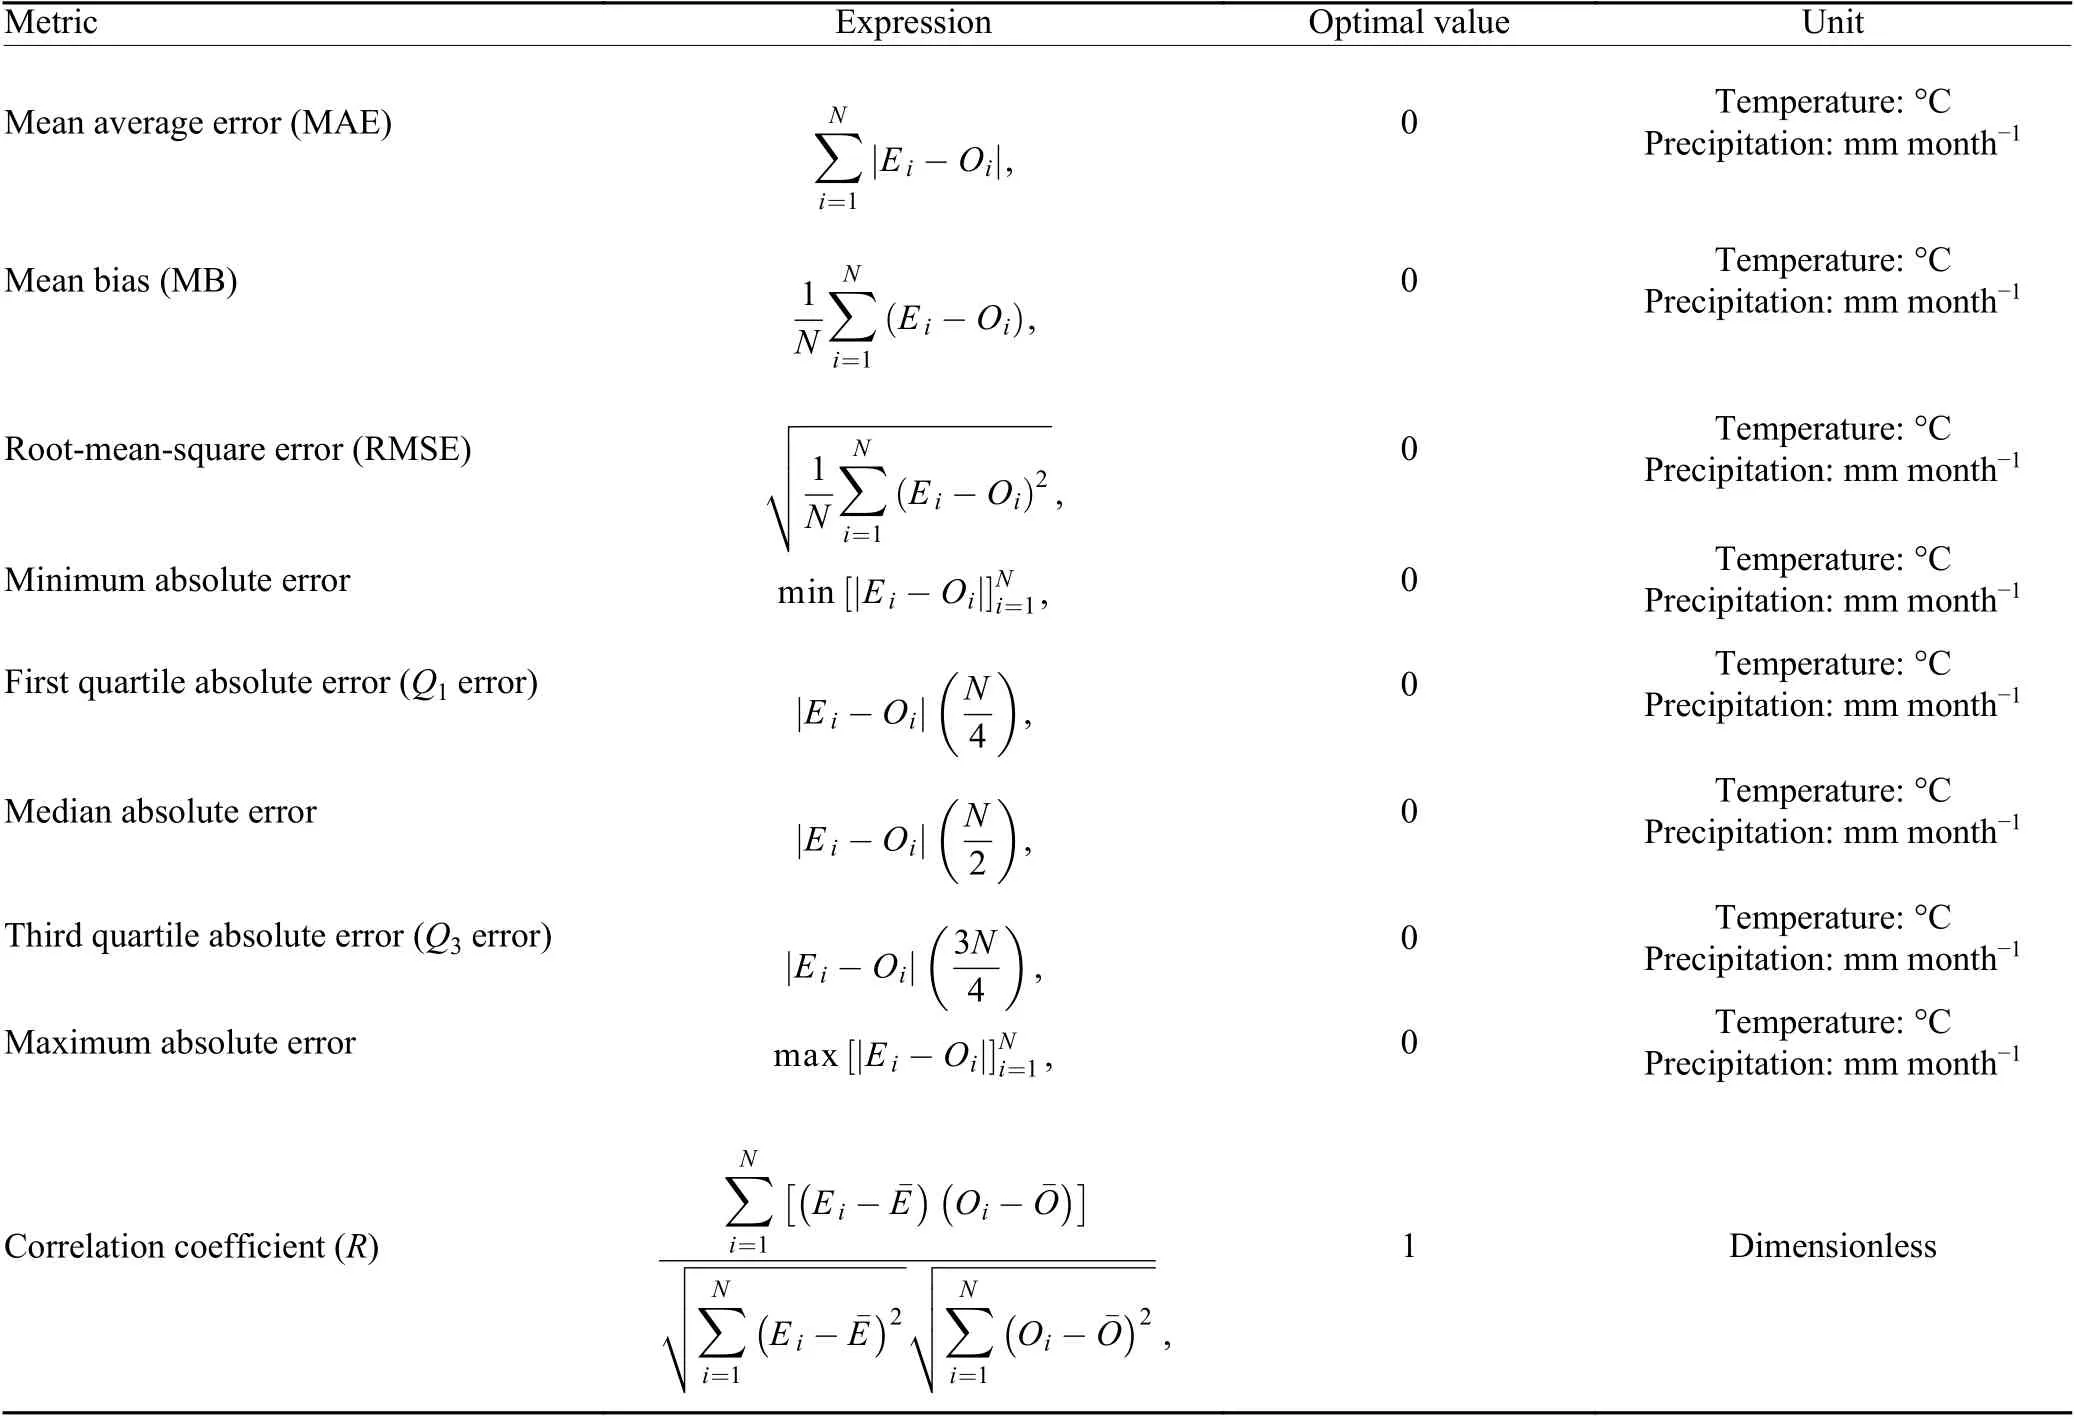
Table 1. Definition of statistical methods used for validation. Note that Ei represents the estimated value at a point i, Oi is the observed value at the nearest DPIRD weather station, and N is the number of samples
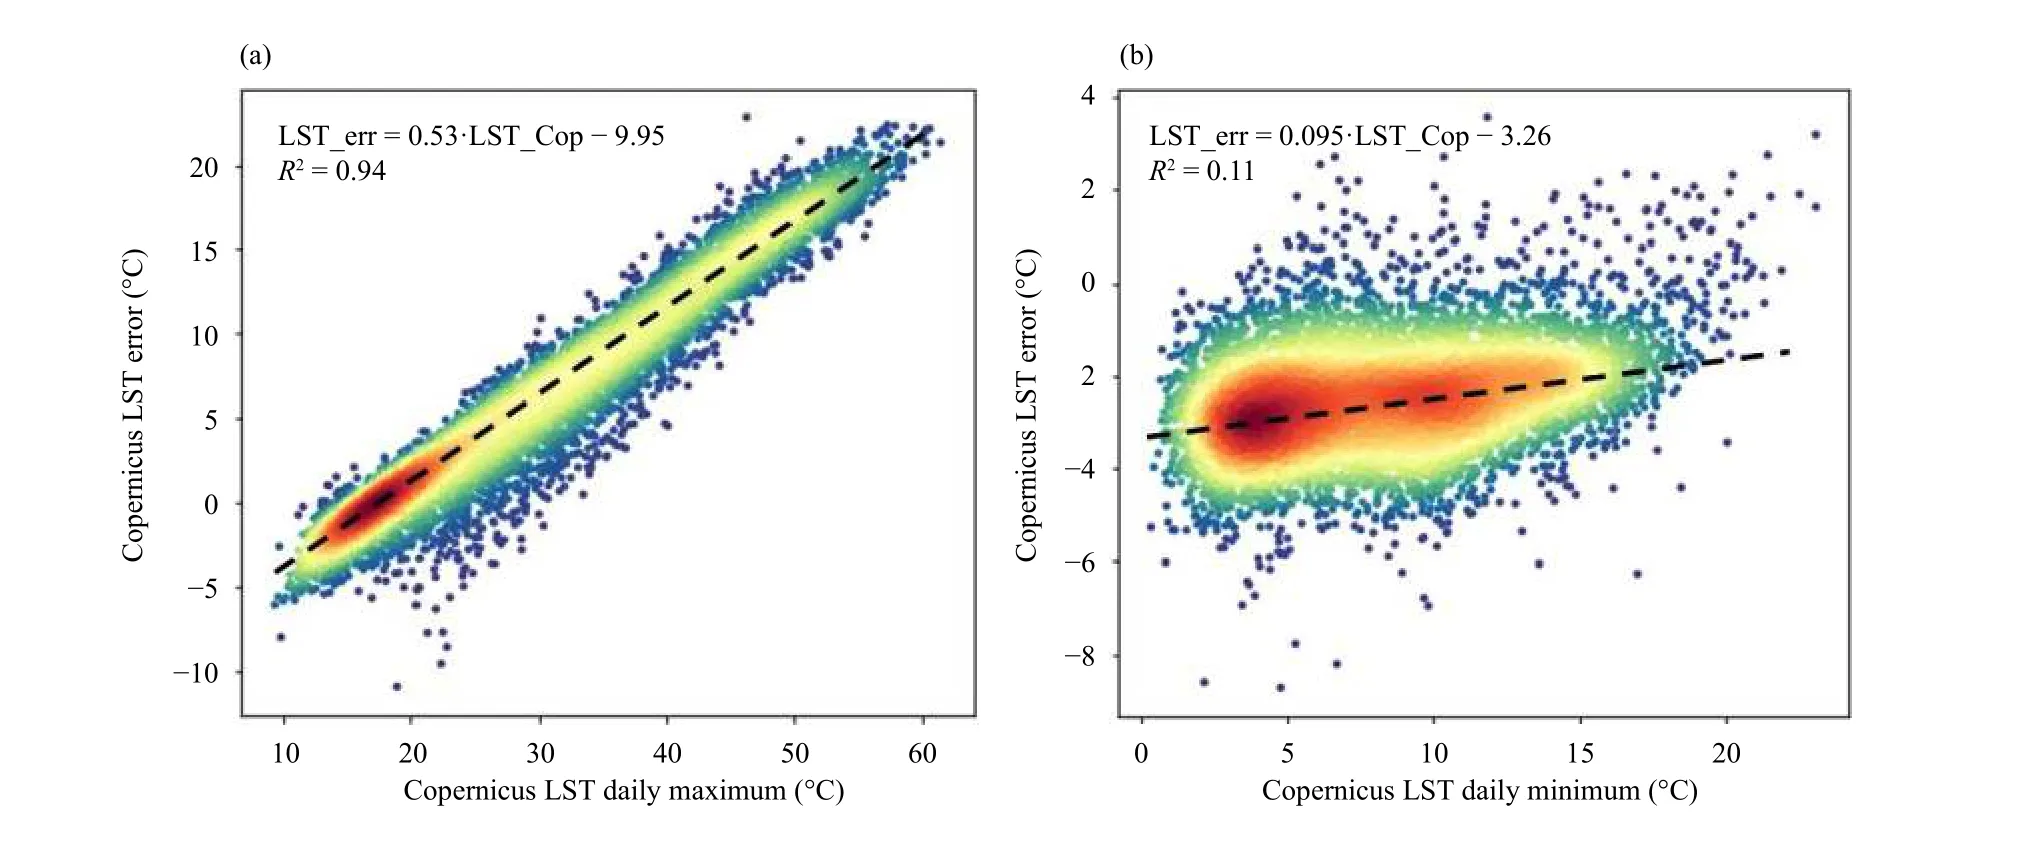
Fig. 2. Error between daily (a) maximum and (b) minimum Copernicus LST compared to DPIRD weather stations. Data are colored in a “heatmap” fashion by the concentration of datapoints.
The uncorrected satellite derived temperature and precipitation products resulted in the highest errors for both temperature and precipitation. However, the bias correction for the Copernicus LST data applied in this study and the precipitation gauge calibration for the GSMaP data provided by JAXA reduced the errors considerably(RMSE improvements of 82% for monthly average maximum temperature, 58% for minimum temperature, and 38% for monthly precipitation). This result highlights the limitation of weather data derived purely from remote sensing data and the need for corrections using groundbased data sources.
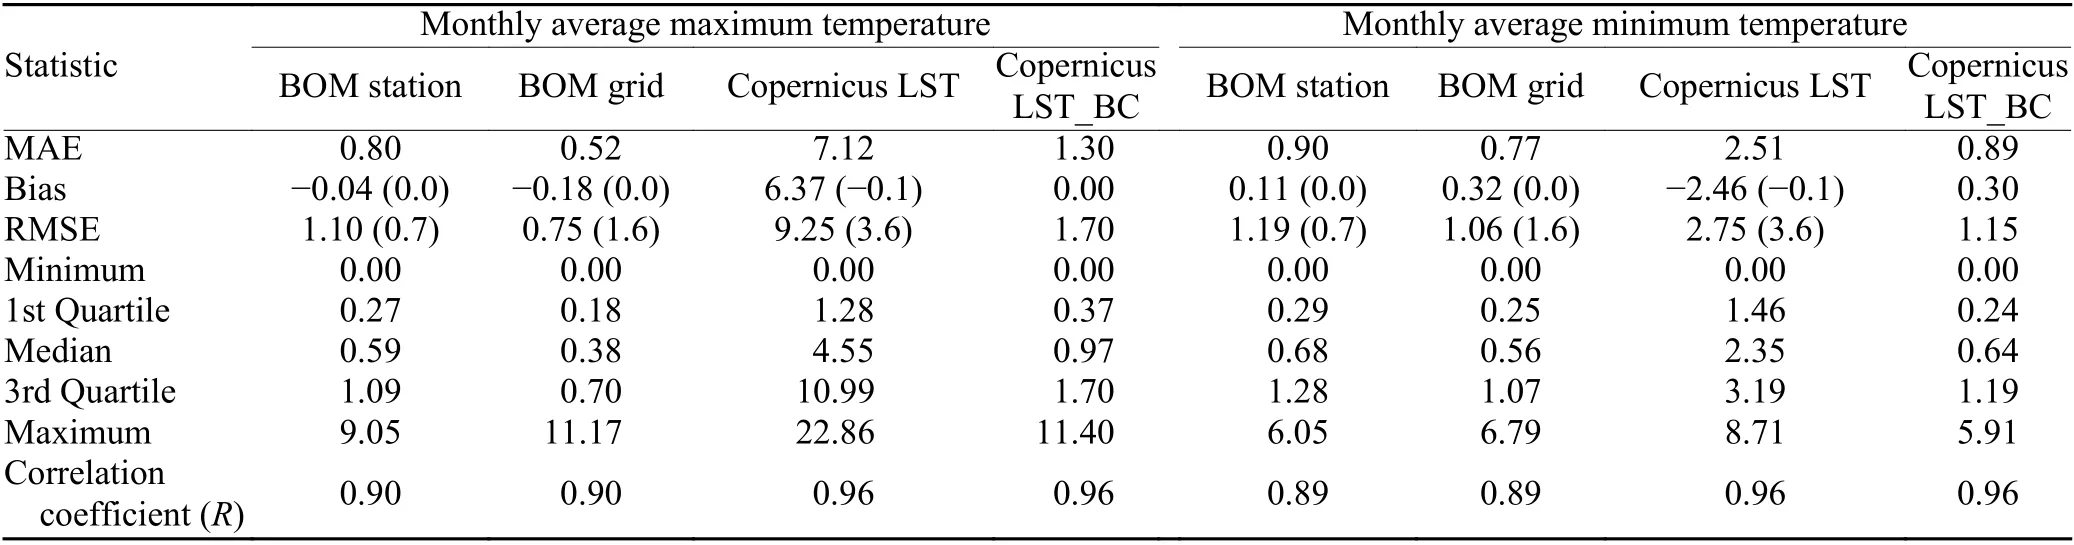
Table 2. Comparison of BOM and Copernicus LST monthly maximum and minimum temperature product accuracies (relative to DPIRD in-situ data). Monthly statistics from January 2015 to December 2019 inclusive. The equivalent statistics from the Australian analysis of the BOM products by Jones et al. (2009) and the hemispheric analysis of Copernicus LST by Martins et al. (2018) are provided in brackets where applicable
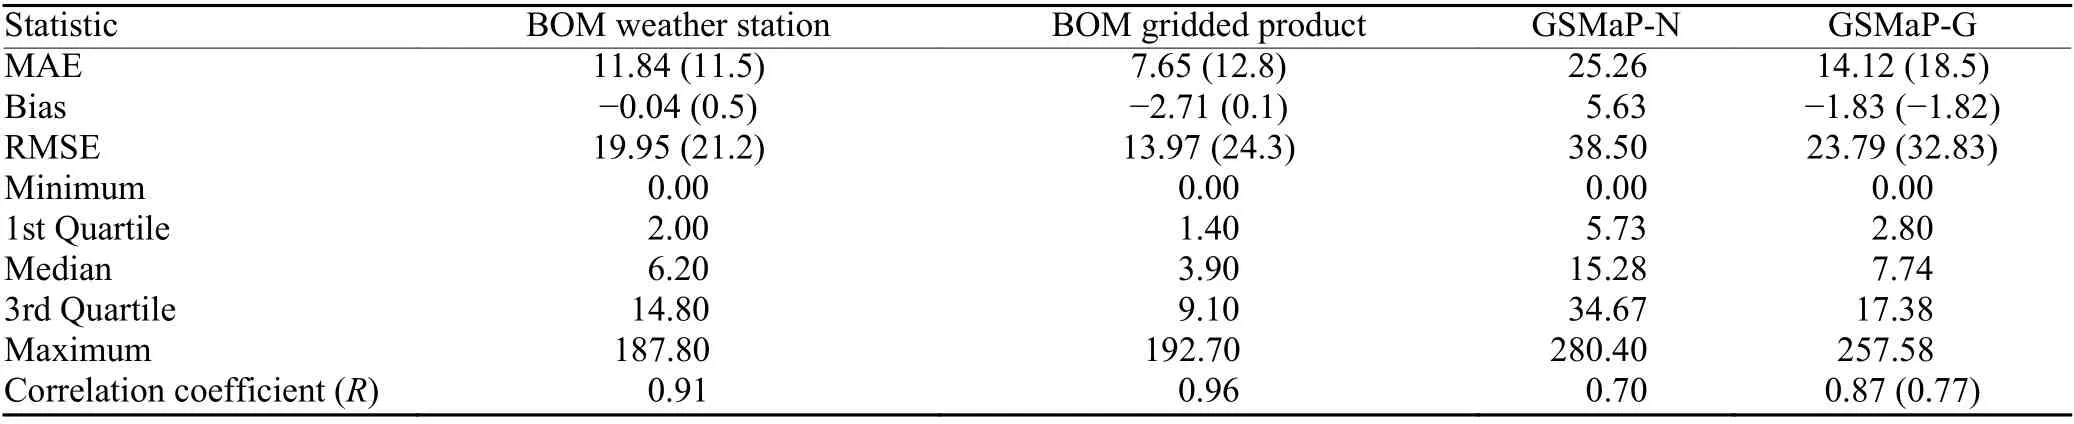
Table 3. Comparison of BOM and JAXA monthly rainfall product accuracies. Monthly statistics from January 2015 to December 2019 inclusive. The equivalent statistics from the Australian analysis of the BOM products by Jones et al. (2009) and GSMaP-G by Chua et al. (2020) are provided in brackets where applicable. Note that for Chua et al. (2020), as the analysis was performed on daily precipitation, the statistics have been scaled to monthly numbers as appropriate
The relative accuracies of the BOM and satellite products are also apparent in cross plots of these datasets against the nearest DPIRD stations, shown in Fig. 3. In all cases, the BOM gridded products have the highest proportion of datapoints on a 1 : 1 trendline compared to DPIRD data, with the BOM weather station data having the next highest proportion on this trendline. The relative performance of the satellite products is less clear in terms of the density of datapoints. The improvements of the Copernicus LST once the linear bias corrections are applied are apparent but the improvements to the GSMaP product once gauge calibrations are applied are only apparent in the summary statistics in Table 3.
3.2 Spatial patterns of accuracy
The average weather conditions over the 5-yr period 2015–2019 for each dataset presented in Fig. 4 show that every dataset captures the broad climatic trends across the study area as described by the Köppen–Geiger climate zones and DPIRD CVTs. Even at this broad scale,the bias of the uncorrected Copernicus LST data is obvious, with the monthly maximum temperature overestimated and monthly minimum temperature underestimated.The lower accuracy of the non-gauge corrected GSMaP product is evident but not as apparent as the Copernicus LST temperature bias.
The BOM gridded temperature and precipitation products and the GSMaP-G product are designed to reduce errors in weather data interpolated between weather stations. Figure 5 shows the annual RMSE for each DPIRD validation point plotted against the distance between the BOM weather station and the DPIRD validation point. There is a clear improvement in the average RMSE between the BOM weather station and BOM gridded products evidenced by the lower spread in data points and lower overall RMSE, as well as from the uncorrected to corrected Copernicus LST and GSMaP satellite products. While there is a general increase in RMSE of the BOM weather station temperature data with increasing distance from the nearest DPIRD weather station, there is not a strong correlation (Rvalues between 0.28 and 0.46). This is only a strong relationship at distances greater than 50 km. Over this distance, it is not reasonable to expect a weather station to be a reasonable measure of weather conditions without some form of interpolation.
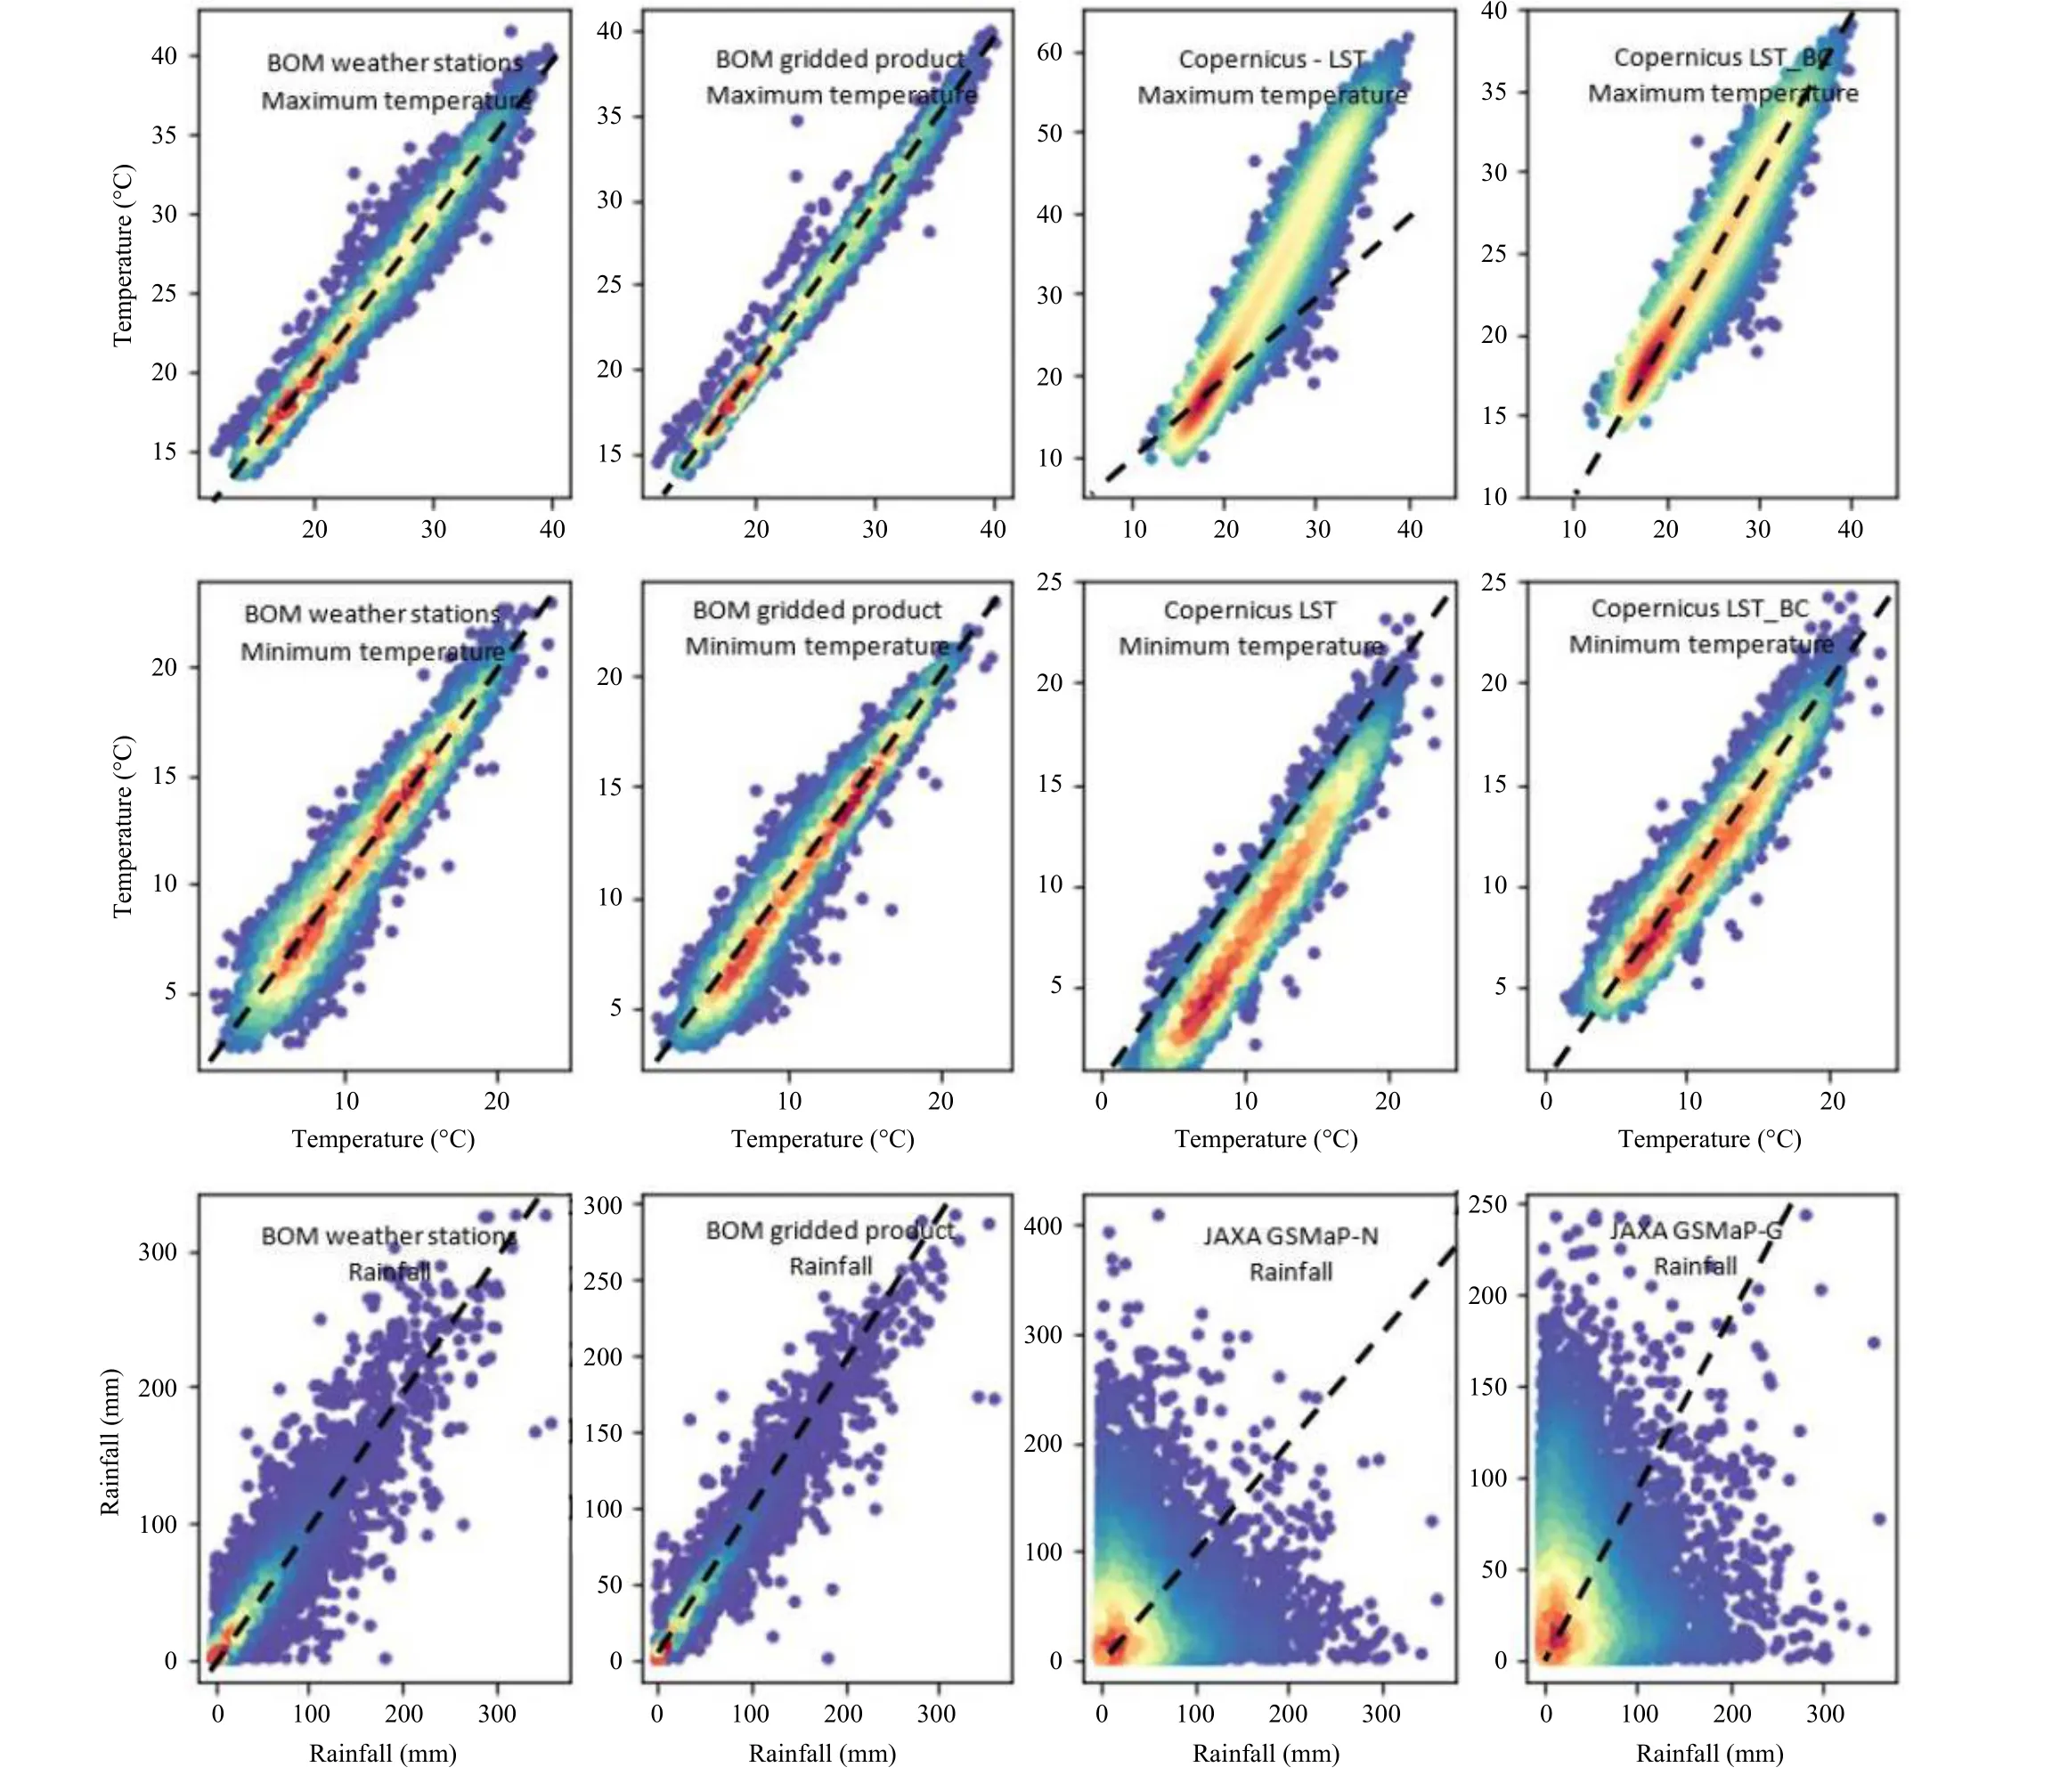
Fig. 3. Crossplots of BOM and satellite weather data against DPIRD station data. Monthly statistics from January 2015 to December 2019 inclusive. Data are coloured by concentration of data points. A 1 : 1 ratio line is presented on each subplot for reference.
The gridding algorithm BOM using does lessen the errors and reduce the correlation between RMSE and distance, reducing theRvalues between 0.17 and 0.28 compared to the weather station data. It is therefore reasonable to assume that the interpolation process is reducing errors resulting from localized weather variations between weather stations.
An assessment of the spatial variability of RMSE and bias of the weather products against the DPIRD validation weather stations shows strong spatial patterns of weather data accuracy (see Figs. 6 and 7 for these data).As expected, all BOM station metrics are improved when the data are gridded and all satellite data metrics are improved when bias correction or precipitation gauge calibration is used (for the Copernicus LST and GSMaP products, respectively).
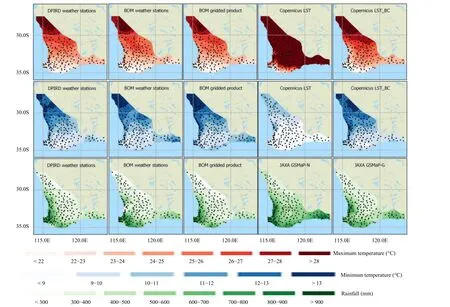
Fig. 4. Annual average weather data for the validation dataset (DPIRD) and the selected weather datasets. Monthly statistics from January 2015 to December 2019 inclusive.
The spatial patterns of RMSE for the BOM weather stations and gridded products are similar, with temperature RMSE’s highest in the northern and eastern edges of the study area (where Fig. 1 shows a lower density of BOM temperature weather stations) and the precipitation less accurate in the south–west quadrant. The bias-corrected LST data show the greatest errors over and around the capital city of Perth, on the west coast of the study area (32.0°S, 115.8°E), which may indicate issues with the ability of the original LST data to adequately account for the urban heat island effect (Price, 1979). The gauge-calibrated GSMaP product has markedly higher RMSE in the south–west corner of the study area,roughly correlating with the “Very High (VH)” rainfall region as classified by DPIRD CVT zones.
The bias patterns for the BOM products are less spatially coherent than the RMSE results. The BOM maximum temperature bias displays no coherent pattern with regards to climatic zones or land use types, although the minimum temperature bias is generally higher in areas of lower spatial density of BOM temperature weather stations. The BOM rainfall products have several “bullseye”features in the south–west quadrant, and higher bias in the eastern extent of the study area, but again no clear relationship to climatic zones.
The spatial patterns of bias are clearer for the satellite products, with the maximum temperature generally underestimated along the Darling Range [a significant geological and topographical feature running from north of Perth to the south coast (Nemchin and Pidgeon, 1997)]and overestimated east of this. The minimum temperature is overestimated near Perth, and the gauge-corrected precipitation is generally underestimated along the western coastal area.
3.3 Seasonal patterns of accuracy

Fig. 5. Weather data RMSE against distance from the nearest BOM weather station. Note the different scales across different plots. Each data point represents a DPIRD station.
The accuracy of spatial temperature products is often dependent on temperature gradients (Jones et al., 2009)and the accuracy of spatial precipitation products is often dependent on precipitation event type (Chua et al.,2020). To assess how summer versus winter weather conditions affect the spatial variability of the RMSE for each product, the RMSE was generated on a monthly basis for the study area and study period. The results for January and July are shown in Figs. 8 and 9 respectively to assess the effects during the warmest-driest–coolestwettest months of the study area. A full set of all months is presented in the supplementary data (Campbell, 2021).
For the month of January, the BOM temperature products showed similar spatial RMSE patterns to the annual RMSE data; RMSE values generally higher in the northern and eastern extents and the gridded product having a lower RMSE than the weather station data. With the annual and January RMSE maps plotted on the same color scale, it is apparent that the maximum temperatures in January have higher RMSE in the northern and eastern zones of the study area than the annual RMSE.Areas of higher RMSE for BOM precipitation products for January are generally bullseye features. This indicates that the weather station network is unable to adequately capture localized, high intensity rainfall events,which are the primary cause of higher rainfall totals for the month of January (Sudmeyer et al., 2016).
The bias-corrected Copernicus LST maximum January temperature product performed similarly to the annual RMSE for the northern, inland, and eastern regions of the study area, but exhibited high errors along the Darling Scarp (identified as an area of higher bias for this product in the annual data). The Copernicus LST minimum temperature product has a lower RMSE on average for January compared with annual data.
鑫两优212是合肥市蜀香种子有限公司利用抗旱性较强的两系不育系蜀鑫1S与抗高温恢复系鑫恢212 2009年配组,2014年通过安徽省审定的杂交水稻新品种(审定编号:皖稻2014022),经上海市农业生物基因中心2012年抗旱性鉴定,抗旱性达1级,是国内选育的首个杂交籼型旱稻品种[13]。笔者拟利用农业部颁布的行业标准《水稻品种鉴定技术规程SSR标记法》(NY/T 1433—2014)中推荐的48个SSR标记,筛选适合的特异引物用于该杂交种纯度的快速鉴定。
The GSMaP-G product performed better in the VH rainfall region in the south–west corner but exhibited bullseye patterns of higher errors elsewhere (similar to the BOM products). Interestingly, there are some areas where the GSMaP-N product performed better than the gauge-calibrated product (along 30°S for example). This may be due to the GSMaP-G product being calibrated to weather stations that are not capturing localized precipitation events that the product is measuring, or extending localized precipitation events at weather stations.
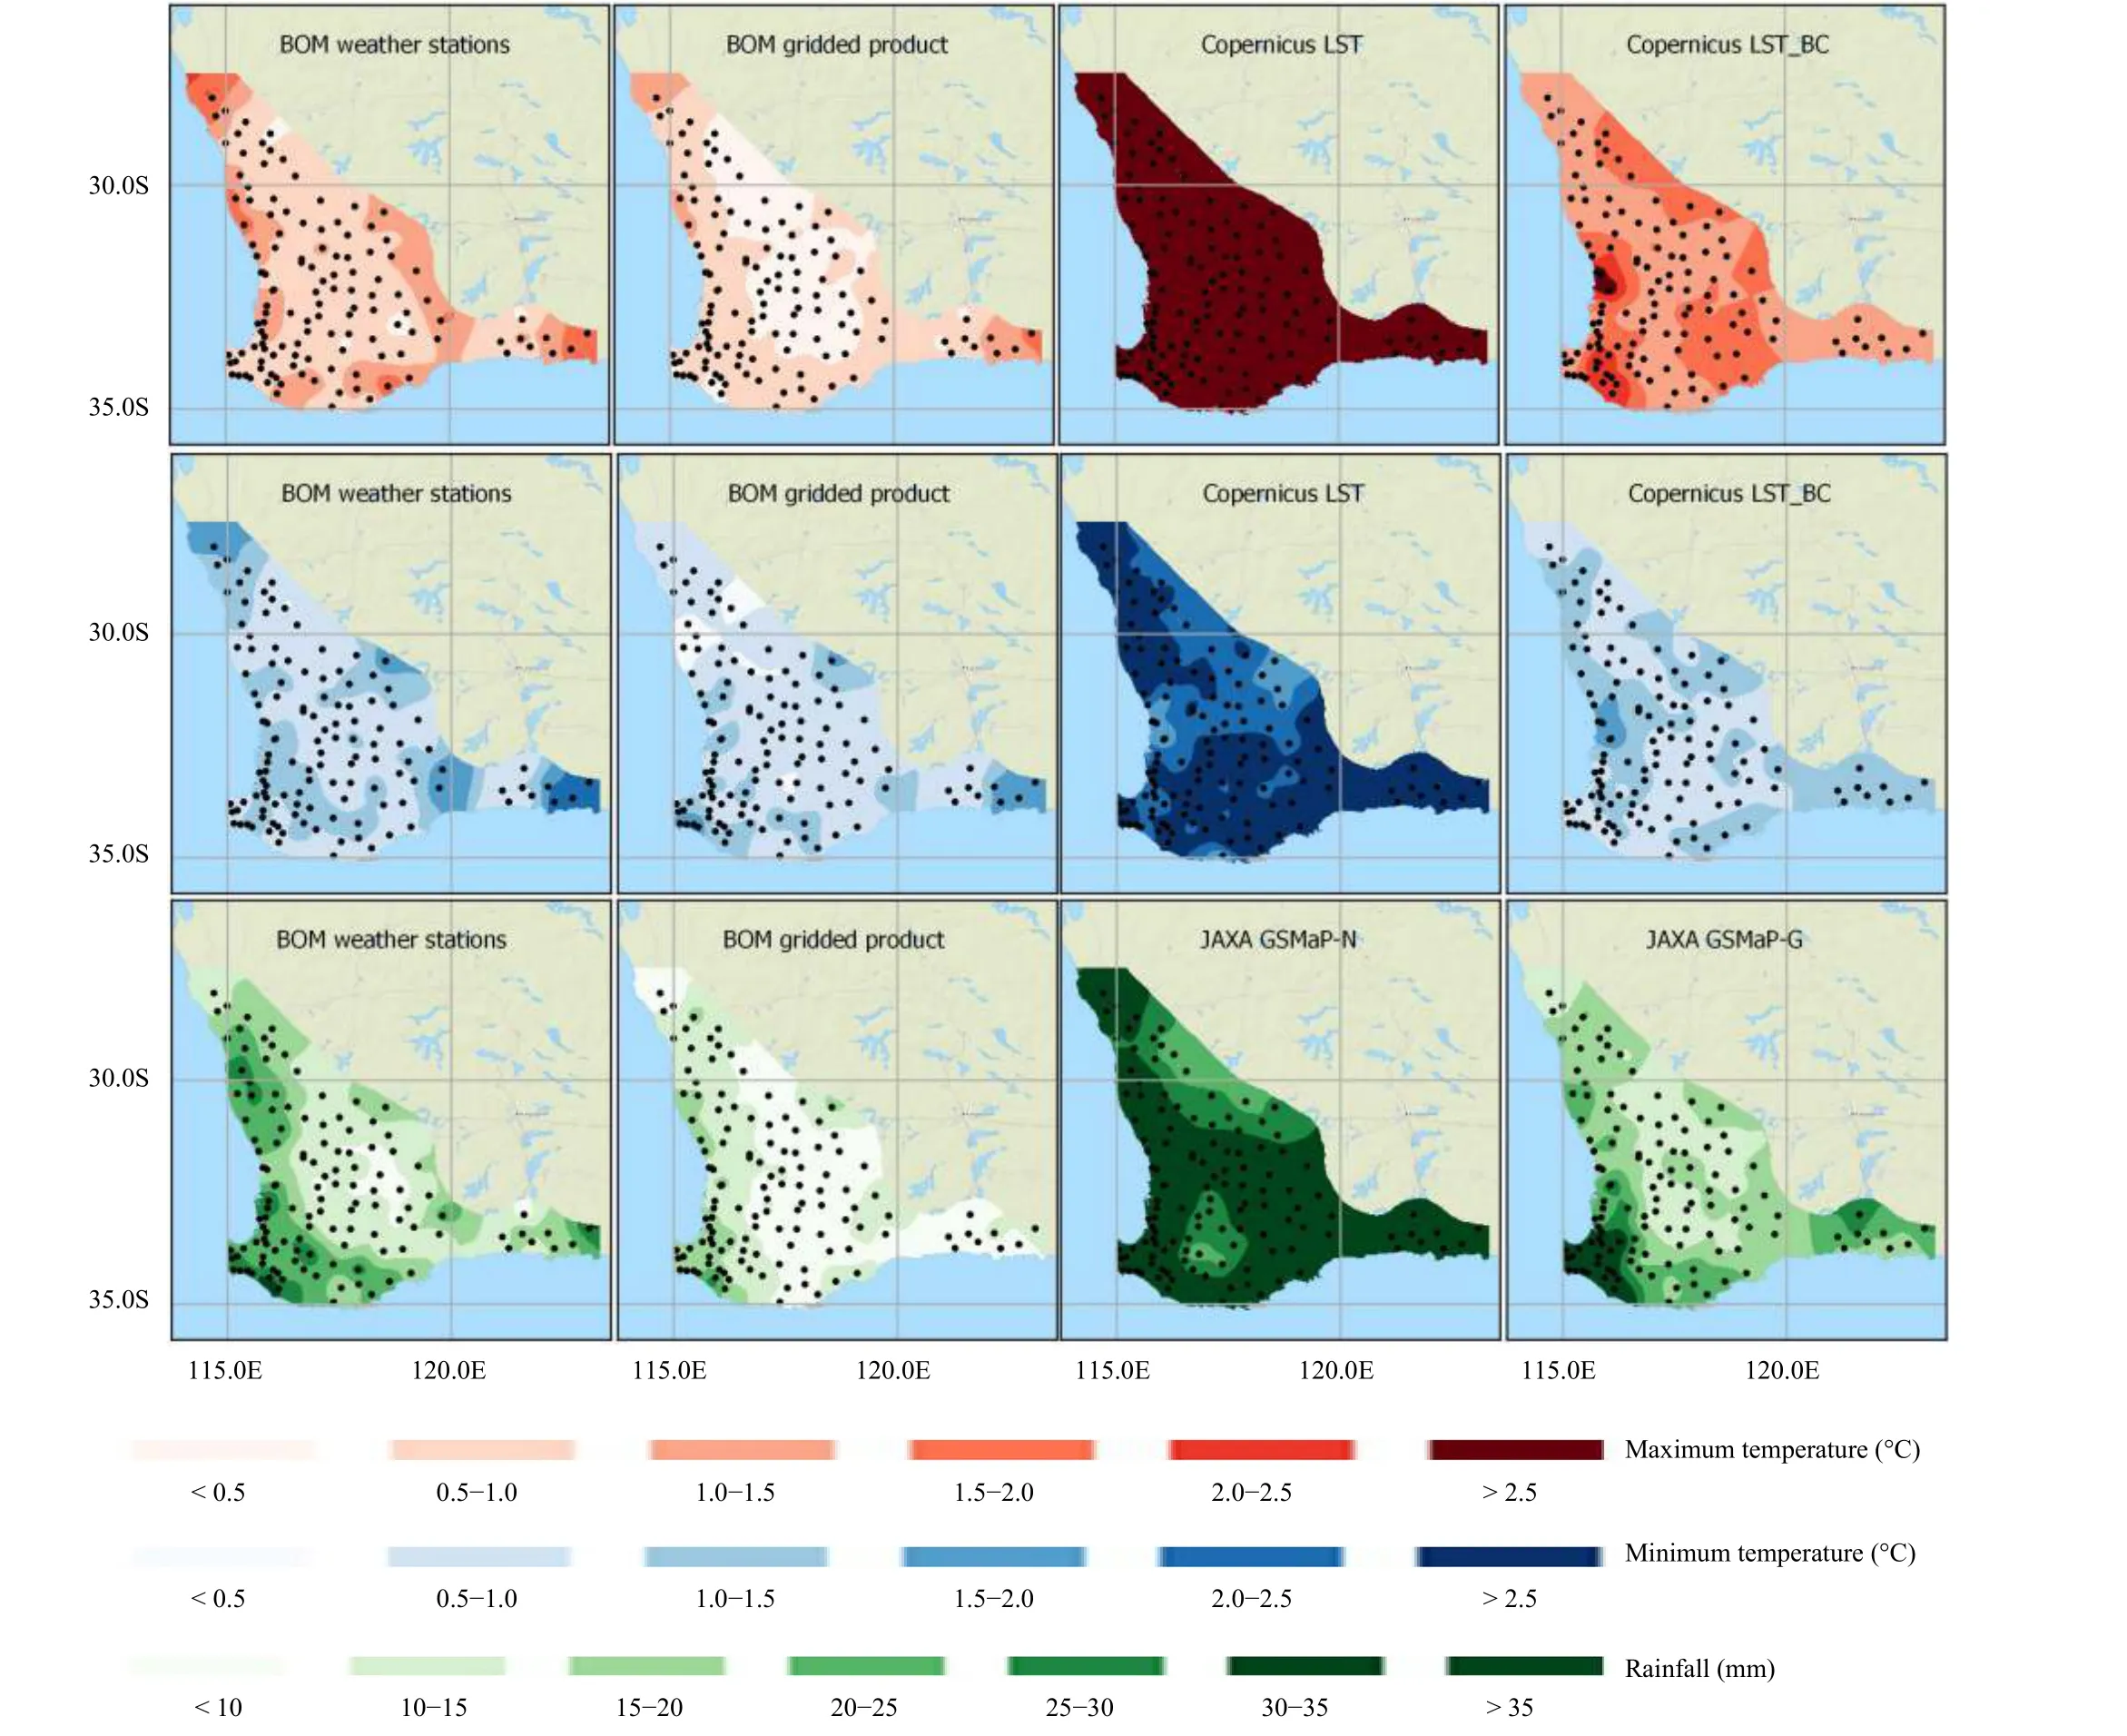
Fig. 6. Comparison of BOM and satellite weather data RMSE against DPIRD stations. Monthly statistics from January 2015 to December 2019 inclusive.
The spatial pattern of errors was noticeably different in July compared to January for all weather products.BOM weather station and gridded temperature products had lower RMSE for both minimum and maximum temperature than the annual RMSE across almost the whole study area. The only exceptions to this are a few areas in the eastern region where the minimum temperature RMSE is slightly higher for July than the annual RMSE.BOM precipitation RMSE for July was higher than the annual RMSE for the very high rainfall area, and some of the high rainfall areas. There is less evidence of bullseye errors from localized events than were prevalent in the January RMSE.
The Copernicus LST maximum temperature RMSE in July was similar to the annual RMSE for the southern region. July RMSE was lower for Perth and higher for the northern region compared with the annual RMSE. There is significantly reduced influence of the Darling Range on the RMSEs for July compared with January. Copernicus LST minimum temperature for July showed similar RMSE compared to the annual and July data.

Fig. 7. Comparison of BOM and satellite weather data bias against DPIRD stations. Monthly statistics from January 2015 to December 2019 inclusive.
The GSMaP-G product showed significantly higher errors in the high and very high rainfall regions of the south–west and south–east coastal regions. This is not unexpected with satellite precipitation generally underestimating higher rainfall events and less accurate for coldfrontal based precipitation (Chua et al., 2020).
3.4 Comparative spatial and seasonal accuracy
To directly compare the accuracy of the BOM gridded products and the calibrated/corrected satellite products (the best performing datasets from ground and satellite-derived data respectively), the relative RMSE maps in Fig. 10 were generated. These maps show the relative accuracy of the BOM grids compared to the calibrated satellite data with the DPIRD weather station network as a baseline in both cases.
The RMSE maps are colored such that green areas show where the BOM grids have a better RMSE than the satellite data, yellow areas here where both datasets have similar RMSE and red where the satellite data have better RMSE. Temperature data were considered better where the RMSE was less than 0.25°C. Rainfall data were considered better where the RMSE was less than 5 mm. This analysis was done on an annual basis and for each month in the year. The annual, January, and July data are shown in Fig. 10 and the full set of figures is provided in the supplementary data (Campbell, 2021).
Overall, the BOM gridded products perform better but there are some exceptions where the satellite data are more accurate, primarily for minimum and maximum temperature in the northern and eastern edges of the study area, and minimum temperature in the south–west corner and isolated areas along the south coast of the study area. These areas are all locations with relatively sparse BOM temperature weather stations (Fig. 1).
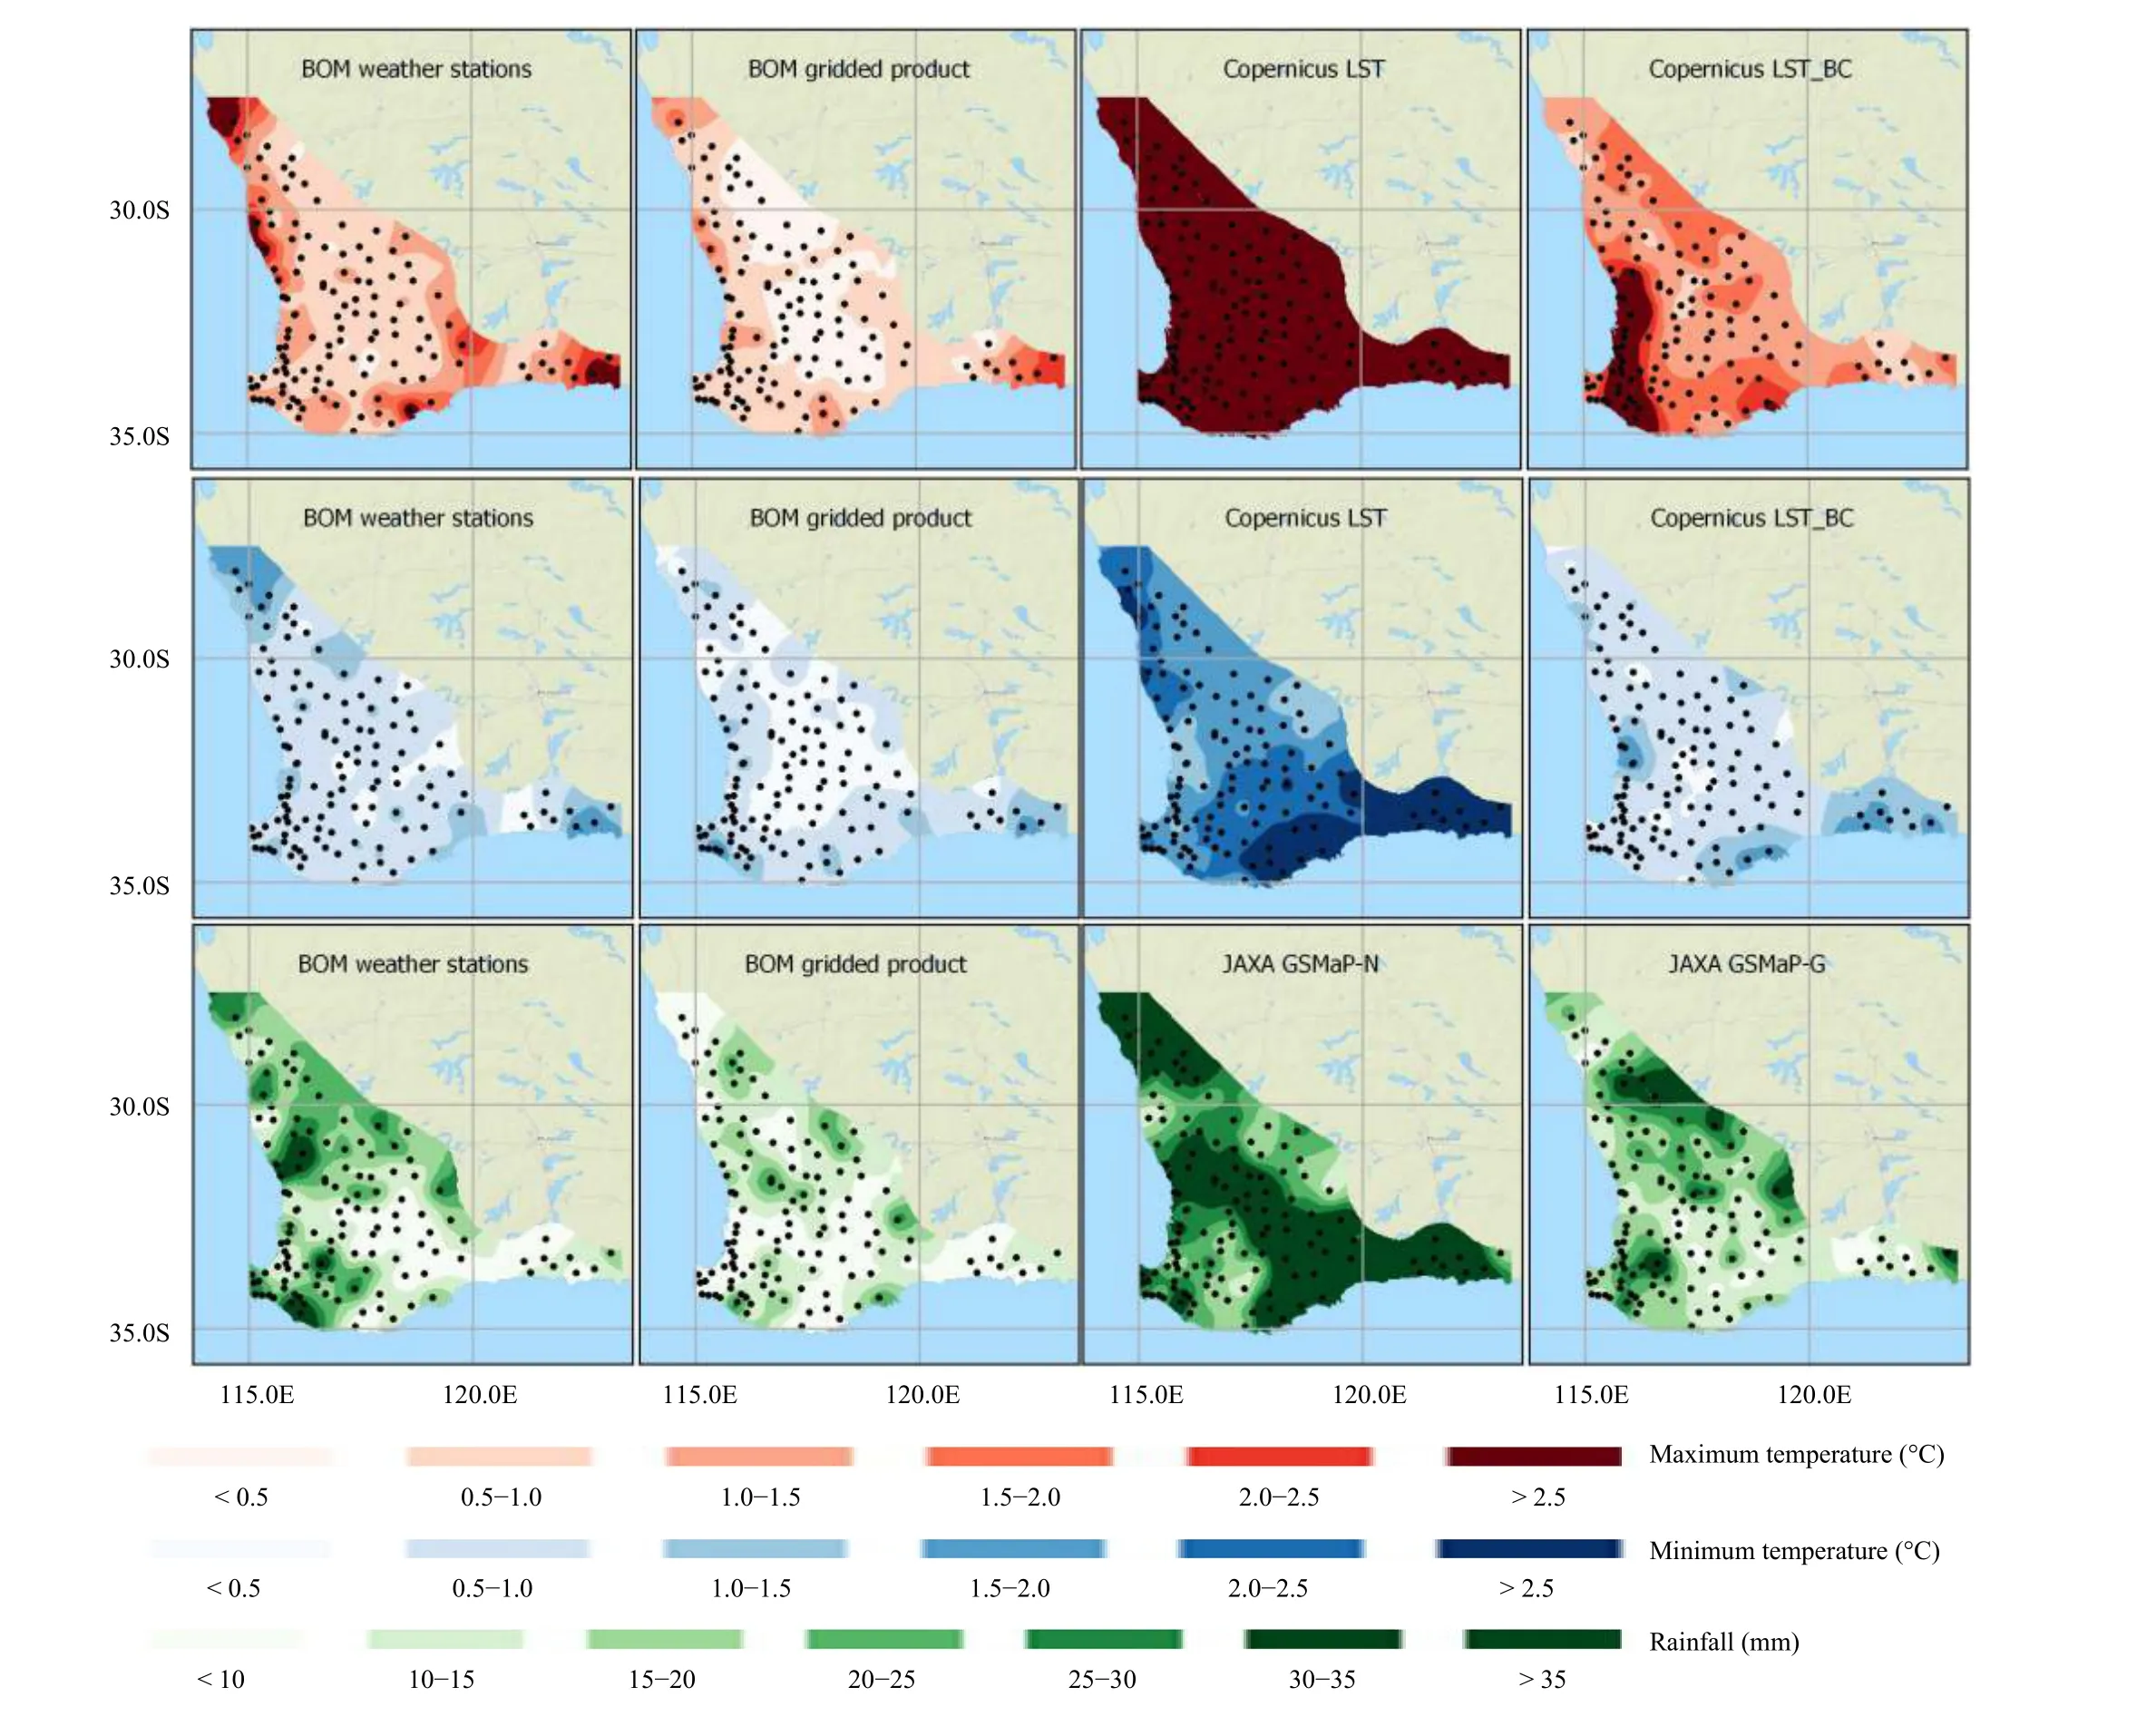
Fig. 8. Comparison of BOM and satellite weather data RMSE against DPIRD stations for January (austral summer). January statistics from January 2015 to January 2019 inclusive.
Apart from some very localized points, the BOM gridded rainfall product performs similarly to better than the GSMaP-G product across the study area.
4. Discussion
4.1 Copernicus LST bias correction
With several validation studies completed for the Copernicus LST product in-situ weather station data, mostly showing a consistent RMSE of 2–3°C (Freitas et al.,2017; Martins et al., 2018, 2020), the size of the positive bias of this dataset at higher temperature was an unexpected result (bias corrections in the order of 20°C for weather station temperature in the order of 40°C). The effectiveness of the linear bias correction for higher temperature (82% improvement in RMSE for average monthly maximum temperature) was likewise unexpected.
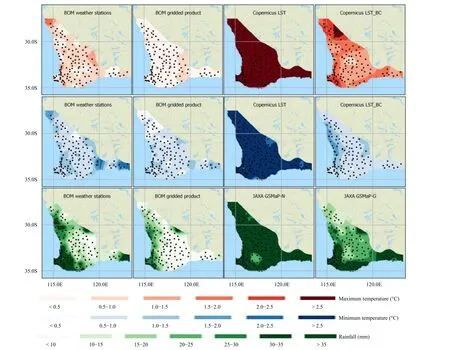
Fig. 9. Comparison of BOM and satellite weather data RMSE against DPIRD stations for July (austral winter). July statistics from July 2015 to July 2019 inclusive.
The Copernicus LST product is validated against both in-situ weather stations (Martins et al., 2018), and for regional and biome assessment, the MODIS LST product(Wan, 2015). While globally the LST product has a strong linear 1 : 1 relationship for temperature ranging from −30 to 50°C for both in-situ weather stations and the MODIS LST product, the comparison with the in-situ Tateno weather station in Japan (the only in-situ validation point for theHimawari-8-based LST) shows a clear increasing positive bias for in-situ temperature measurements above approximately 30°C (Martins et al., 2018).This positive bias trend was not present when comparing the Copernicus LST data to the MODIS LST data in the same validation study (Martins et al., 2018). However,multiple comparisons of MODIS daytime LST and insitu weather station data have found that MODIS daytime LST can be overestimated by 5–20°C in some ecosystems (Vancutsem et al., 2010; Lin et al., 2012; Assiri,2017; Phan et al., 2019). Therefore, the MODIS daytime LST dataset may not be a reliable product for validation of the Copernicus LST dataset at higher temperature.
To assess the degree and consistency of bias of the Copernicus LST product at higher temperature in different climatic zones and ecosystems, Copernicus LST data were compared to BOM weather station temperature data for a series of locations in the northern (warmer) half of Australia. The result of this process, shown alongside the selected BOM weather stations in Fig. 11, again showed an almost linear relationship between increasing temperature and increasing positive bias for the Copernicus LST data. While theR2value is lower, at 0.73, for this analysis versus 0.94 for the main study area of this paper, the same overall pattern is present.
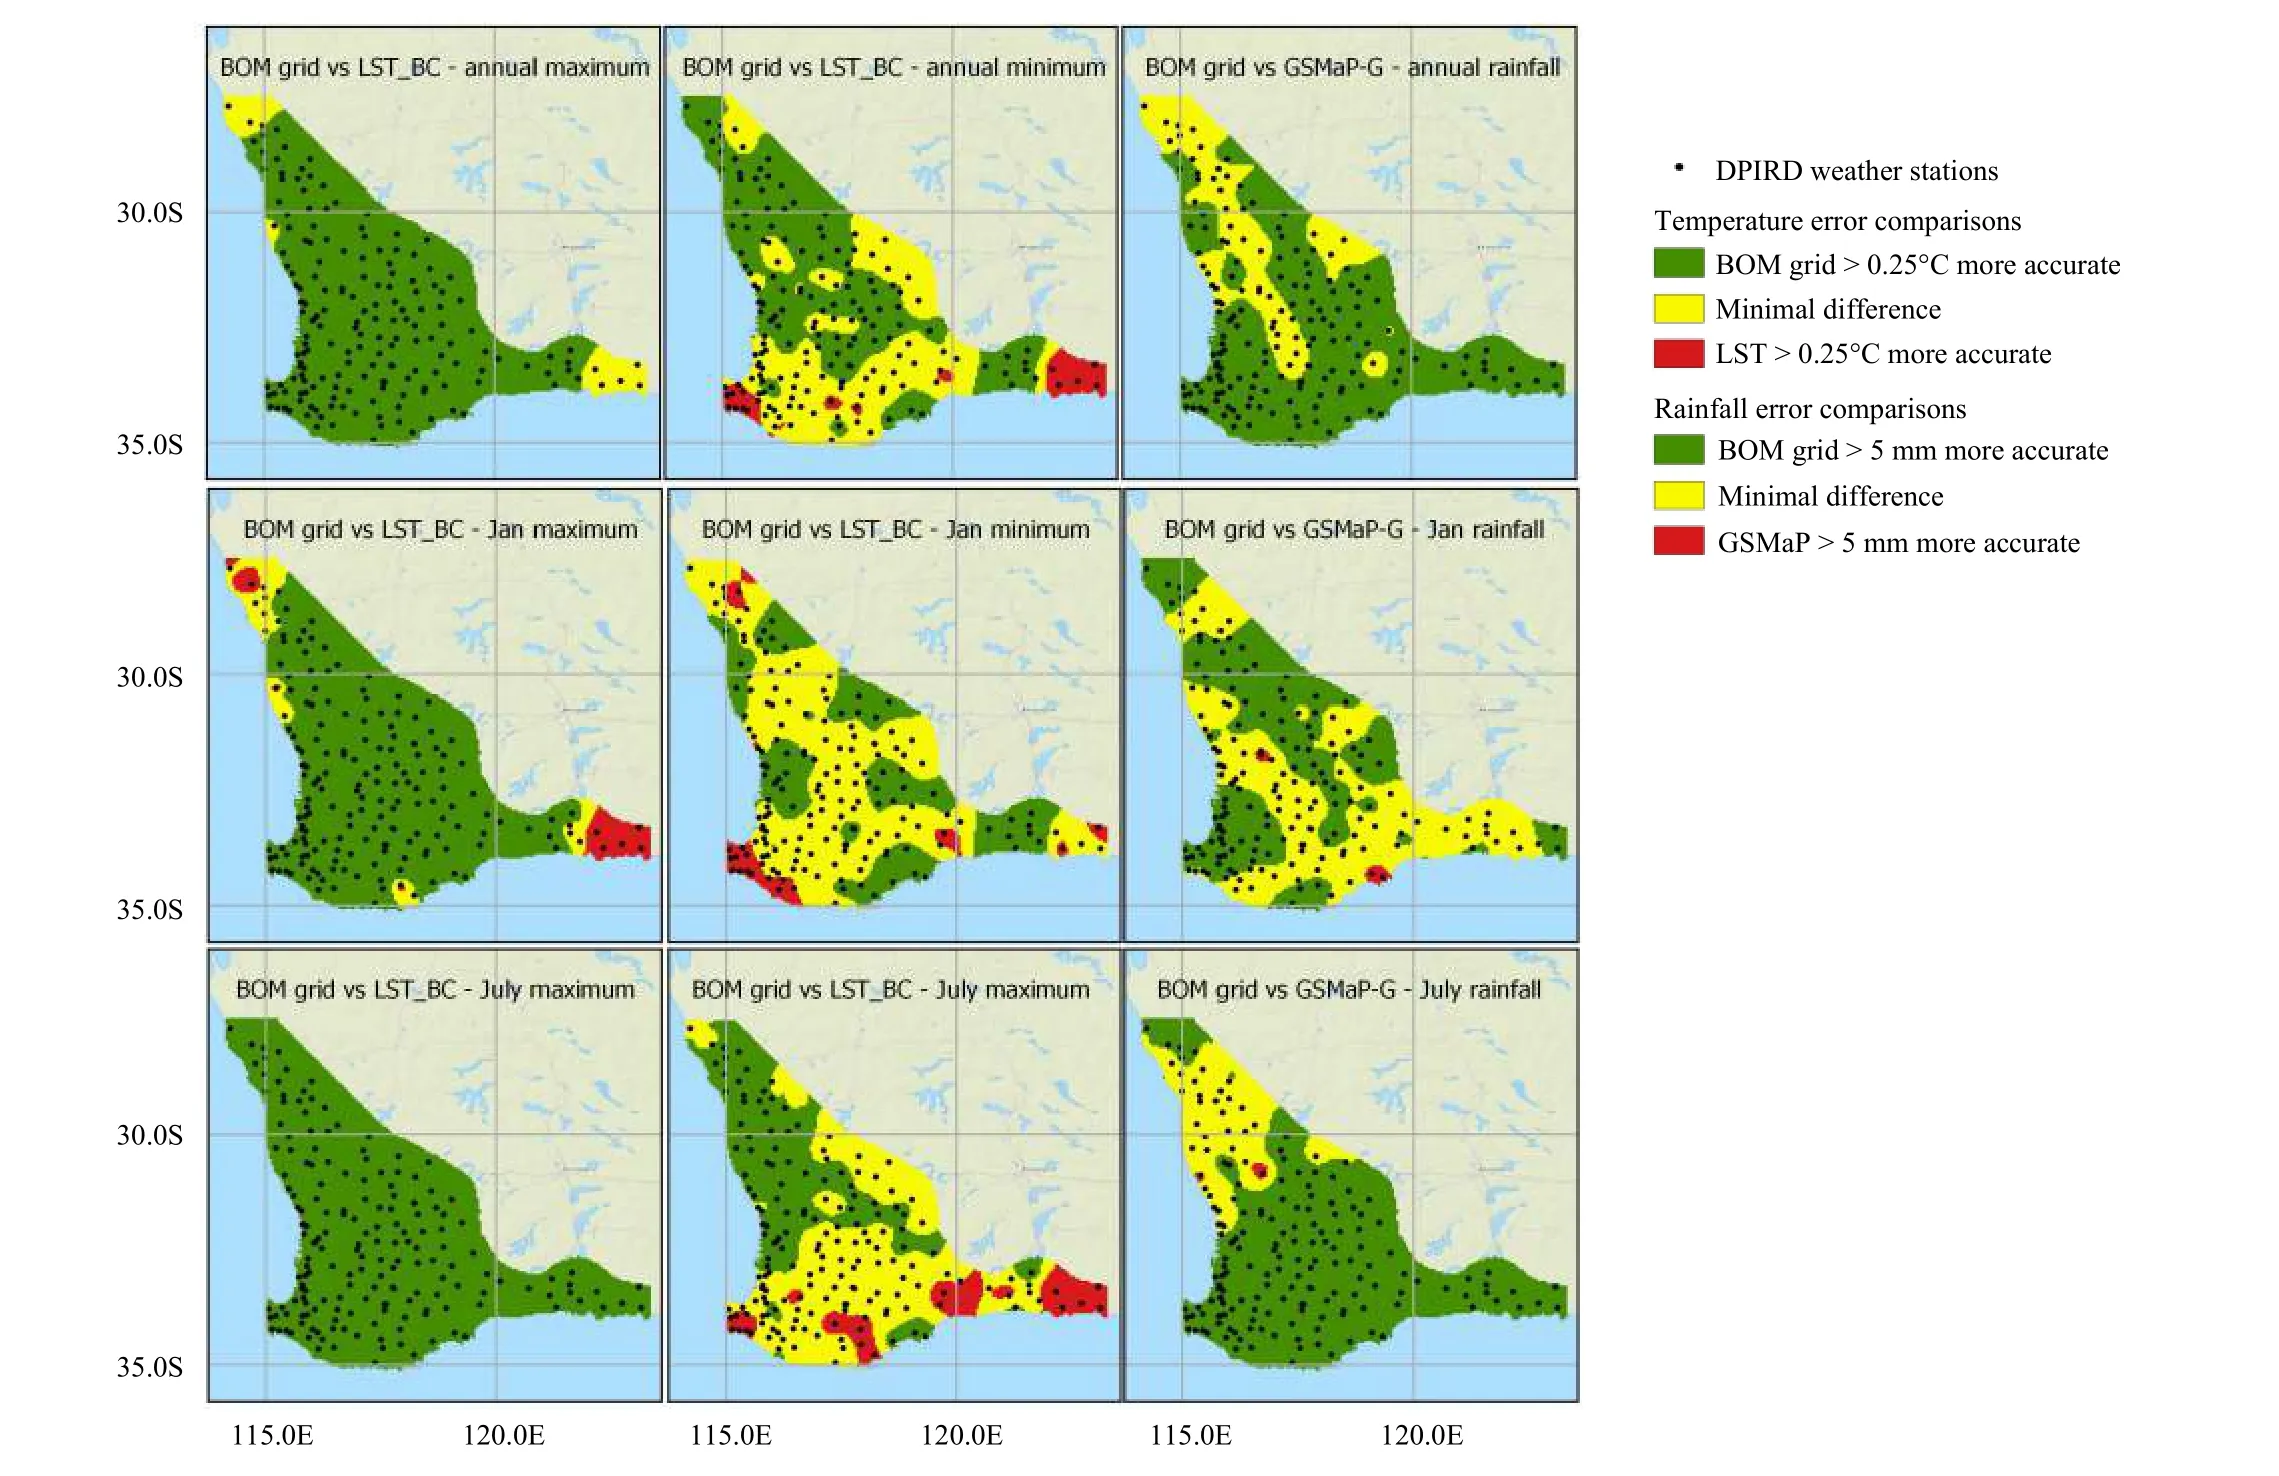
Fig. 10. Performance of BOM gridded products and satellite products versus DPIRD data for annual, January, and July. Green areas are where only the BOM gridded product has an RMSE at least 0.25°C or 5 mm lower than the equivalent satellite product; red areas are where only the satellite product has an RMSE at least 0.25°C or 5 mm lower than the equivalent; and yellow areas are where the RMSEs of both the BOM gridded product and the relevant satellite product have a difference of less than 0.25°C or 5 mm.
Applying the correction factor shown in Fig. 11 to the Copernicus northern Australian LST data improves the RMSE from 15.7 to 2.8°C (an improvement of 82%, almost exactly the same improvement ratio for the SWAR). Applying the SWAR correction factor to the northern Australian data reduced the RMSE to 3.0°C. Although an improved result, the difference in RMSE for the different areas indicates that the bias correction may be improved with localized adjustments. Creating a bias correction factor for each weather station in the northern Australian region resulted in a further slight improvement to an RMSE of 2.4°C (an 84% reduction in RMSE compared to the original Copernicus LST product).
4.2 Effect of land use type and landscape heterogeneity
With land use type and heterogeneity reported to affect both satellite-derived LST (Martins et al., 2018) and satellite-derived precipitation (Chua et al., 2020), the average RMSE for the monthly data at each DPIRD validation point was compared against land use data for the biascorrected Copernicus LST data and gauge-corrected GSMaP product.
Land use classifications by ABARES (2001) are extracted for a radius of 2.5 km around each DPIRD validation point (corresponding to a similar area to the Copernicus LST and GSMaP pixels) in Fig. 12. Land use heterogeneity is calculated from the number of different land use classes within this region and the land use type from the land use type covering the largest area within this region. Of the 126 DPIRD validation points, 2 are in urban areas, 4 in conservation regions, 18 in managed forest regions, 26 in pasture grazing regions, and 76 in broadacre cropping regions.
The results from this process, shown in Fig. 13, indicate that land use heterogeneity has no bearing on the Copernicus LST_BC accuracy or the GSMaP-G product.However, land use type does impact on monthly temperature and precipitation accuracy.
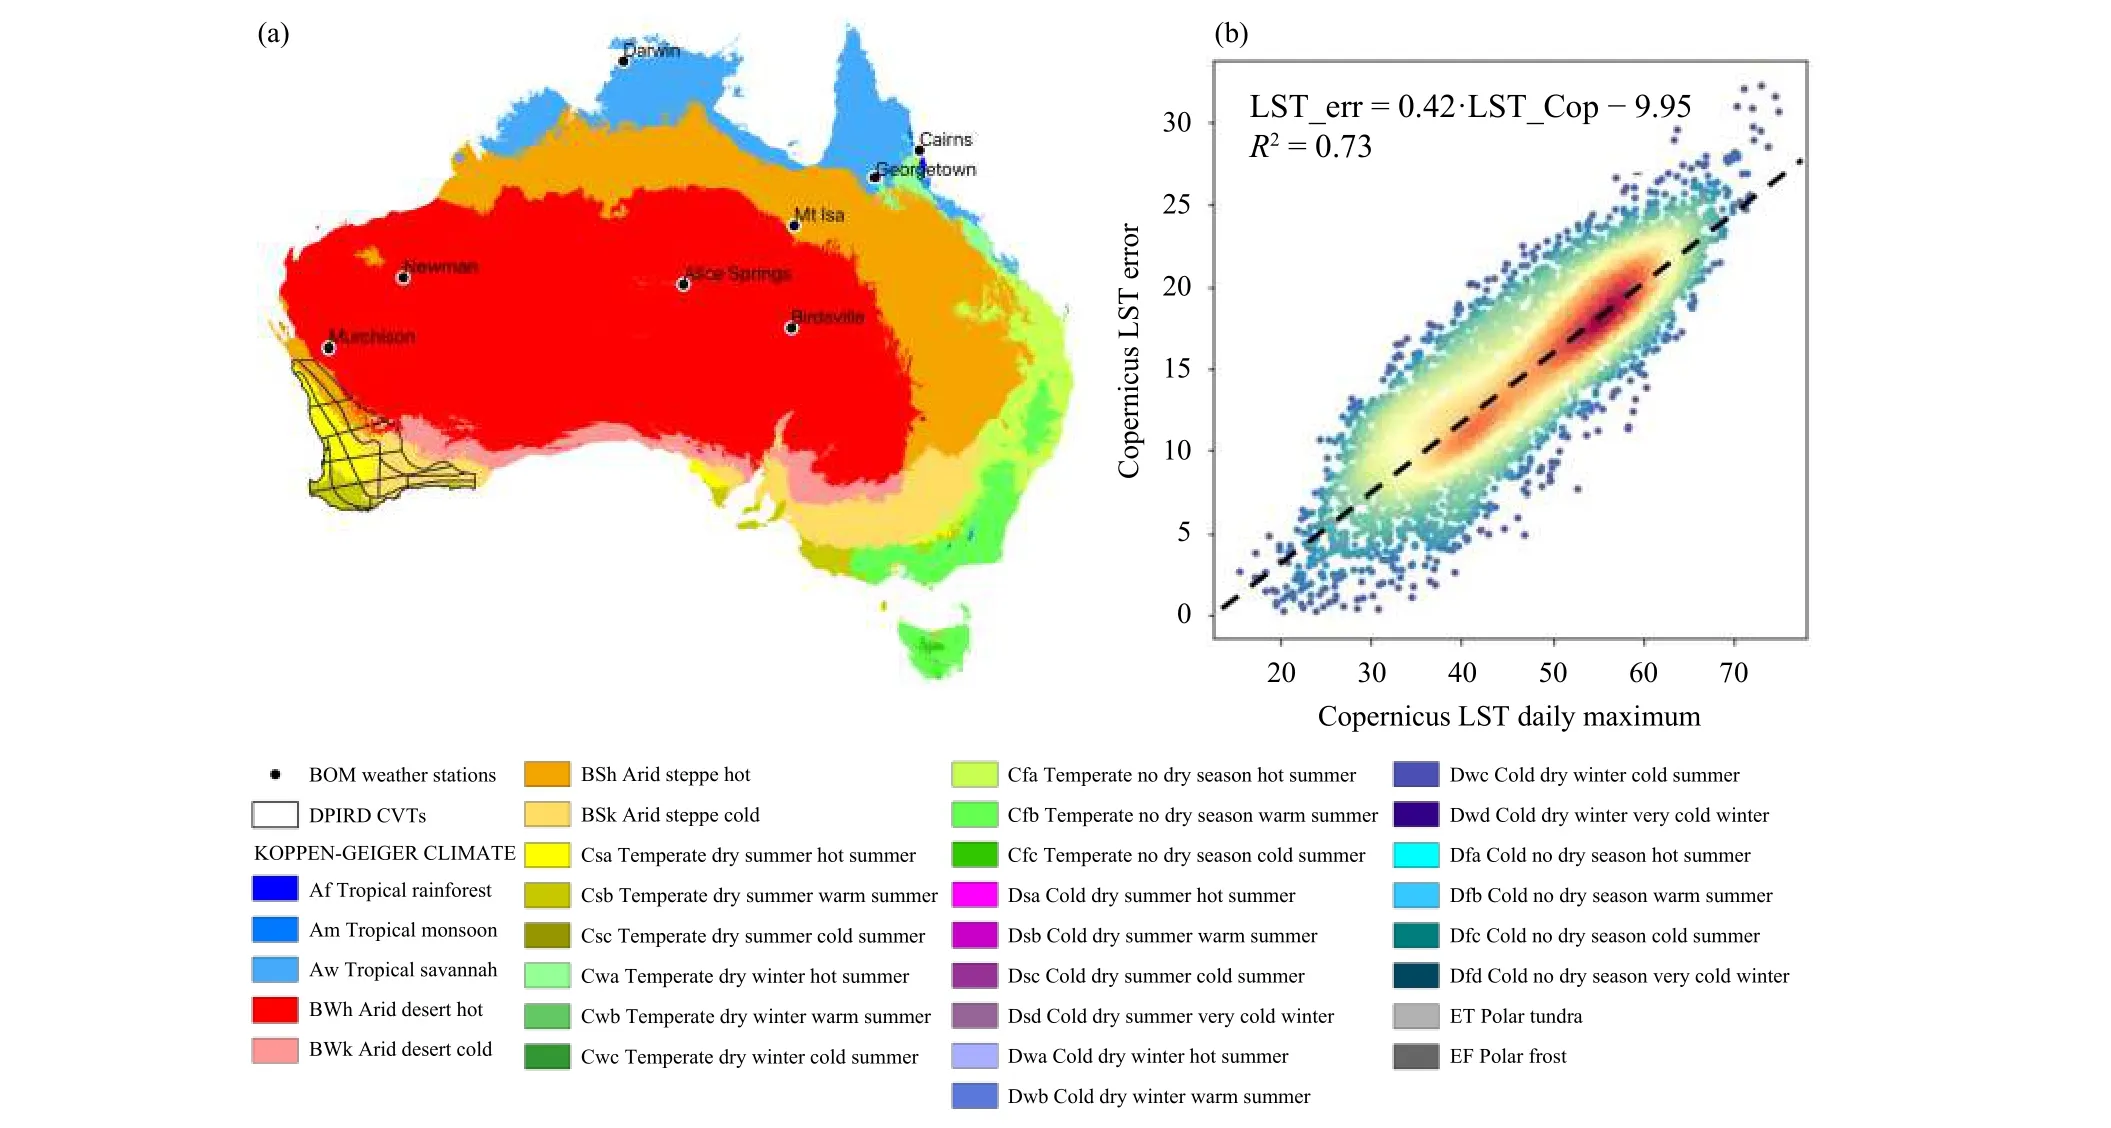
Fig. 11. Comparison of Copernicus LST and BOM weather station daily maximum temperature data for northern Australia. (a) Locations of BOM weather stations over the Köppen–Geiger climate zone and (b) LST errors versus Copernicus LST temperatures (equivalent plot to Fig. 2).
While most of the errors for the LST_BC maximum and minimum temperature products had RMSEs between 0.5 and 1.5°C, managed forest and urban land use types all had errors in some cases higher than the cropping and grazing land use types. More than 90% of the grazing and cropping land use locations had an RMSE of less than 1.5°C for the maximum temperature and 1.0°C for the minimum temperature. While land use heterogeneity based on land use classes was not correlated to temperature accuracy (scatter plots), the variability in vegetation cover for the forest land uses and multiple land cover types within the urban land use classification likely reduces the accuracy of the Copernicus LST_BC product in these regions.
Precipitation accuracy was similar for all land use types except conservation, which had no locations with an average RMSE better than 15 mm month−1. Precipitation accuracies for grazing and cropping land use types were slightly better than for managed forest land.
5. Conclusions
From the accuracy analysis of both ground and satellite-based weather products for the SWAR in this study from January 2015 to December 2019, the BOM gridded temperature and rainfall products provide the most accurate weather data in most regions and months (average monthly temperature RMSE of 0.9°C and monthly precipitation RMSE of 14.0 mm), followed by the BOM weather station data (RMSEs of 1.1°C and 20.0 mm).Calibrated or bias-corrected satellite data generally performed third best (RMSEs of 1.4°C and 23.8 mm) and uncalibrated or uncorrected satellite data were generally the least accurate (RMSEs of 6.0°C and 38.5 mm). These average accuracies are similar to those found in other studies of these weather products in larger and other regions.
A strong linear bias was found for the daily Copernicus LST product. This bias ranged from approximately−5°C at daily maximum LST of approximately 10°C to over 20°C at LST of 60°C. A linear correction of bias based on the daily maximum LST greatly improved the accuracy of the daily maximum LST from an RMSE of 9.25 to 1.7°C (an improvement of 82%). An assessment of the bias correction from other regions in Australia outside the SWAR found that this linear bias pattern was present in multiple climatic regions although the relative scale of the bias did vary to some degree. For the weather stations outside of the SWAR used for this analysis, applying the SWAR correction factor improved the RMSE from 15.7 to 3.0°C. Creating a bias correction factor for each weather station resulted in a further improvement to an RMSE of 2.4°C (an 84% reduction in RMSE compared with the original Copernicus LST product). The success of this relatively simple bias correction process indicates that a bias-corrected Copernicus LST product is a feasible option, similar to the precipitation gauge corrected GSMaP product.
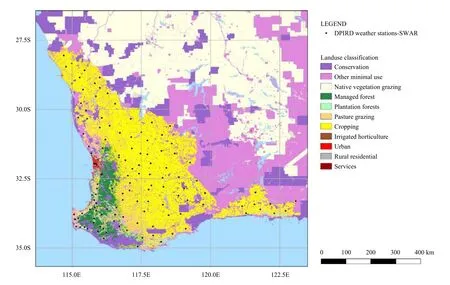
Fig. 12. DPIRD weather stations in the SWAR overlaid on land use types.
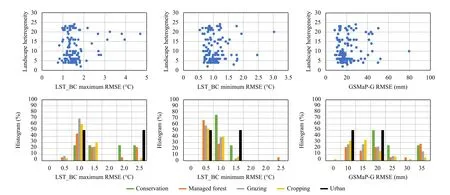
Fig. 13. Scatter plots: Land use heterogeneity (number of different land use types within a 25-pixel region) versus satellite weather product accuracy (LST RMSE and GSMaP-G rainfall). Higher number of pixels implies more heterogeneous land use. Histograms: Cumulative proportion of DPIRD sites for increasing RMSE for the five different primary land use classifications.
The accuracy of the weather products showed both spatial and seasonal varibility. The BOM weather station and gridded products were less accurate in summer at the northern and eastern extents of the study area (where the density of BOM weather stations is markedly reduced).While the bias-corrected satellite temperatures were more accurate in these regions in summer, this product had a marked increase in RMSE in summer over Darling Fault,the main topographic feature of the study area. Minimum temperature was generally better represented by the BOM weather products with the exception of a region along the southern coastal region of the study area.
The BOM precipitation products were less accurate in the very high rainfall zones (> 750 mm yr−1) in the south–west corner of the study area. While the satellite precipitation products did achieve similar accuracies to the BOM products in some areas and seasons, there was no location or month where the satellite precipitation products were markedly more accurate than the BOM precipitation products.
In addition to mapping the spatial and seasonal accuracy of each weather product, a series of maps have been generated to highlight regions and months where the BOM gridded products are more or less accurate than the satellite weather products. This allows users of weather data to both understand the accuracy limitations of weather data for different locations as well as select the best performing weather product based on their location and time of year.
6. Data availability
Monthly DPIRD weather station data used for this analysis are available in Comma Separated Variable format from https://doi.org/10.25917/fry7-nx79 (Campbell, 2021). Maps of statistical analysis on an aggregated annual and monthly basis are also available from this location.
猜你喜欢
杂志排行

Journal of Meteorological Research的其它文章
- A Possible Dynamic Mechanism for Rapid Production of the Extreme Hourly Rainfall in Zhengzhou City on 20 July 2021
- Diagnosing the Dynamic and Thermodynamic Effects for the Exceptional 2020 Summer Rainy Season in the Yangtze River Valley
- Estimation of Chlorophyll-a Concentration in Lake Taihu from Gaofen-1 Wide-Fieldof-View Data through a Machine Learning Trained Algorithm
- A Case Study on the Rapid Rain-to-Snow Transition in Late Spring 2018 over Northern China: Effects of Return Flows and Topography
- Southwesterly Water Vapor Transport Induced by Tropical Cyclones over the Bay of Bengal during the South Asian Monsoon Transition Period
- Energetics of Boreal Wintertime Blocking Highs around the Ural Mountains