A Possible Dynamic Mechanism for Rapid Production of the Extreme Hourly Rainfall in Zhengzhou City on 20 July 2021
2022-03-12JinfangYINHaodongGUXudongLIANGMiaoYUJisongSUNYanxinXIEFengLIandChongWU
Jinfang YIN, Haodong GU, Xudong LIANG, Miao YU, Jisong SUN, Yanxin XIE,Feng LI, and Chong WU
1 State Key Laboratory of Severe Weather, Chinese Academy of Meteorological Sciences, China Meteorological Administration, Beijing 100081
2 Research Center for Disastrous Weather over Hengduan Mountains & Low-Latitude Plateau,China Meteorological Administration, Kunming 650034
ABSTRACT
Key words: extreme rainfall, meso-γ-scale convective system, extreme hourly rainfall rate, devastating flooding
1. Introduction
An extreme rainfall event occurred over Zhengzhou,capital city of Henan Province of central China, during 19–20 July 2021 (hereafter the “21·7” Henan deluge). It caused devastating floods over Zhengzhou City, leaving 292 dead, 47 missing, and a direct economic loss of 114,269 billion Yuan. Distinct features associated with this extreme rainfall event are summarized below. (1)There occurred a record-breaking hourly rainfall rate of 201.9 mm h−1in Zhengzhou, and torrential rainfall maintained for almost 5 days over Zhengzhou and nearby areas. (2) The extreme rainfall took place under coexistence of a more northward western Pacific subtropical high (WPSH) over Northeast Asia, the Tibetan high over West China, and Typhoon In-Fa over the East China Sea as well as Typhoon Cempaka over the South China Sea.Of importance is that all the then operational models under-predicted the extreme hourly rainfall. Therefore, one of the puzzles has been raised—what mechanism(s)could have accounted for the production of the extremely high hourly rainfall? A modeling study is motivated to answer the question in this paper.
Given the extreme rainfall production in Zhengzhou,we will first examine the importance of large-scale weather systems, such as Typhoon In-Fa. It may have acted similarly as Typhoon Nina on the August 1975(“75·8”) Henan flood, which transported warm moist air from the East China Sea. Ding et al. (1978) analyzed in detail the large- and mesoscale weather features on the“75·8” event and proposed that large-scale weather patterns provide favorable moisture conditions for the heavy rainfall, and mesoscale systems and terrain played important roles in producing the extreme rainfall. Yang et al. (2017) found that Typhoon Nina remained stationary due to the blocking from an anomalously strong WPSH with its western ridge dominating northeastern Asia; and the merger of Tropical Depression 05W and Typhoon Nina established a period of anomalously strong lowlevel water vapor transport preceding and during the period of the catastrophic rainfall.
Although some conclusions have been drawn from previous studies (e.g., Ding et al., 1978; Beijing Group of“75.8” Heavy Rain Cooperative Research, 1979; Cai et al., 1992; Ding, 2015; Yang et al., 2017) on the extreme flood in Henan Province during 4–8 August 1975(“75·8”), the record-breaking hourly rainfall rate of 201.9 mm h−1in the present event (“21·7”) is totally unexpected and unexplainable, given the nowadays greatly improved observation techniques and numerical weather prediction models on refined resolutions. Accordingly,the primary objectives of the present study are to (i) determine to what extent the record-breaking rain-producing storm over Zhengzhou on 20 July 2021 could be reproduced with the most advanced weather prediction model; (ii) examine any non-observable small-scale structure(s) that are associated with the record-breaking rainfall; and (iii) reveal the main mechanism responsible for producing the exceptionally high hourly rainfall.
Considerable studies on extreme rainfall over the world have been performed, and substantial progress has been made on understanding of heavy rainfall events(e.g., Tao, 1980; Houze, 2018; Meng et al., 2019; Luo et al., 2020). Generally speaking, heavy rainfall is usually produced by mesoscale processes under stable largescale conditions. Commonly, topographical lifting of the approaching potentially unstable and/or neutral air plays a critical role in determining the distribution and amounts of heavy rainfall along foothills (Houze, 2012; Xu et al.,2012; Hua et al., 2020; Yin et al., 2020; Xia et al., 2021).Besides, many studies confirmed that heavy rainfall is closely related to the low-level jet that provides abundant water vapor (Du and Chen, 2018; Zhang and Meng,2019). Additionally, a quasi-stationary mesoscale vortex usually accompanies heavy rainfall (Zhai et al., 2007,2015; Jiang et al., 2019; Yin et al., 2020). On the other hand, it is found that heavy rainfall is also generated by repeating convective back building (i.e., echo training) of convective cells (Wang et al., 2014, 2021; Peters and Schumacher, 2015). Nonetheless, it is still difficult to understand the formation mechanism of some of the shorttime extremely heavy rainfall events such as the “21·7”deluge based on the existing theories. In this study, we pay special attention to the refined dynamic structures of the mesoscale convective system including convective cells and surrounding updrafts directly involved in the“21·7” Zhengzhou rainstorm, and propose that the arcshaped distribution of updrafts of the convective storm and associated moisture transport play important roles in generating the record-high hourly rainfall in Zhengzhou.
The rest of the paper is organized as follows. Method and data are given in Section 2. Section 3 provides background synoptic-scale weather conditions associated with the “21·7” extreme heavy rainfall in Zhengzhou City.Model verifications against available observations are described in Section 4. Section 5 presents a detailed analysis of convective initiation and the subsequent extreme rainfall production over Zhengzhou based on the highresolution simulation data. The refined structure of a meso-γ-scale convective system is scrutinized and the associated dynamic mechanism for the extremely high rainfall rate is revealed. A summary and concluding remarks are given in the final section.
2. Methods and data
2.1 Model description
The “21·7” rainstorm is simulated, in this study, by using the WRF-ARW model in two-way interactive,triply nested grids with horizontal resolutions of 9, 3, and 1 km. Figure 1a displays the geographical coverage of the model domains, with grid points of 601 × 372, 502 ×433, and 733 × 622 for the outer, intermediate, and inner domains, respectively. The outermost domain (i.e., D01)is centered at 34.5°N, 113°E, and a total of 58 sigma levels is used in the vertical with the model top at 20 hPa.Figure 1b shows a zoomed-in view of D03, in which the Songshan Mountain to the west of Zhengzhou is marked with a dashed polygon.
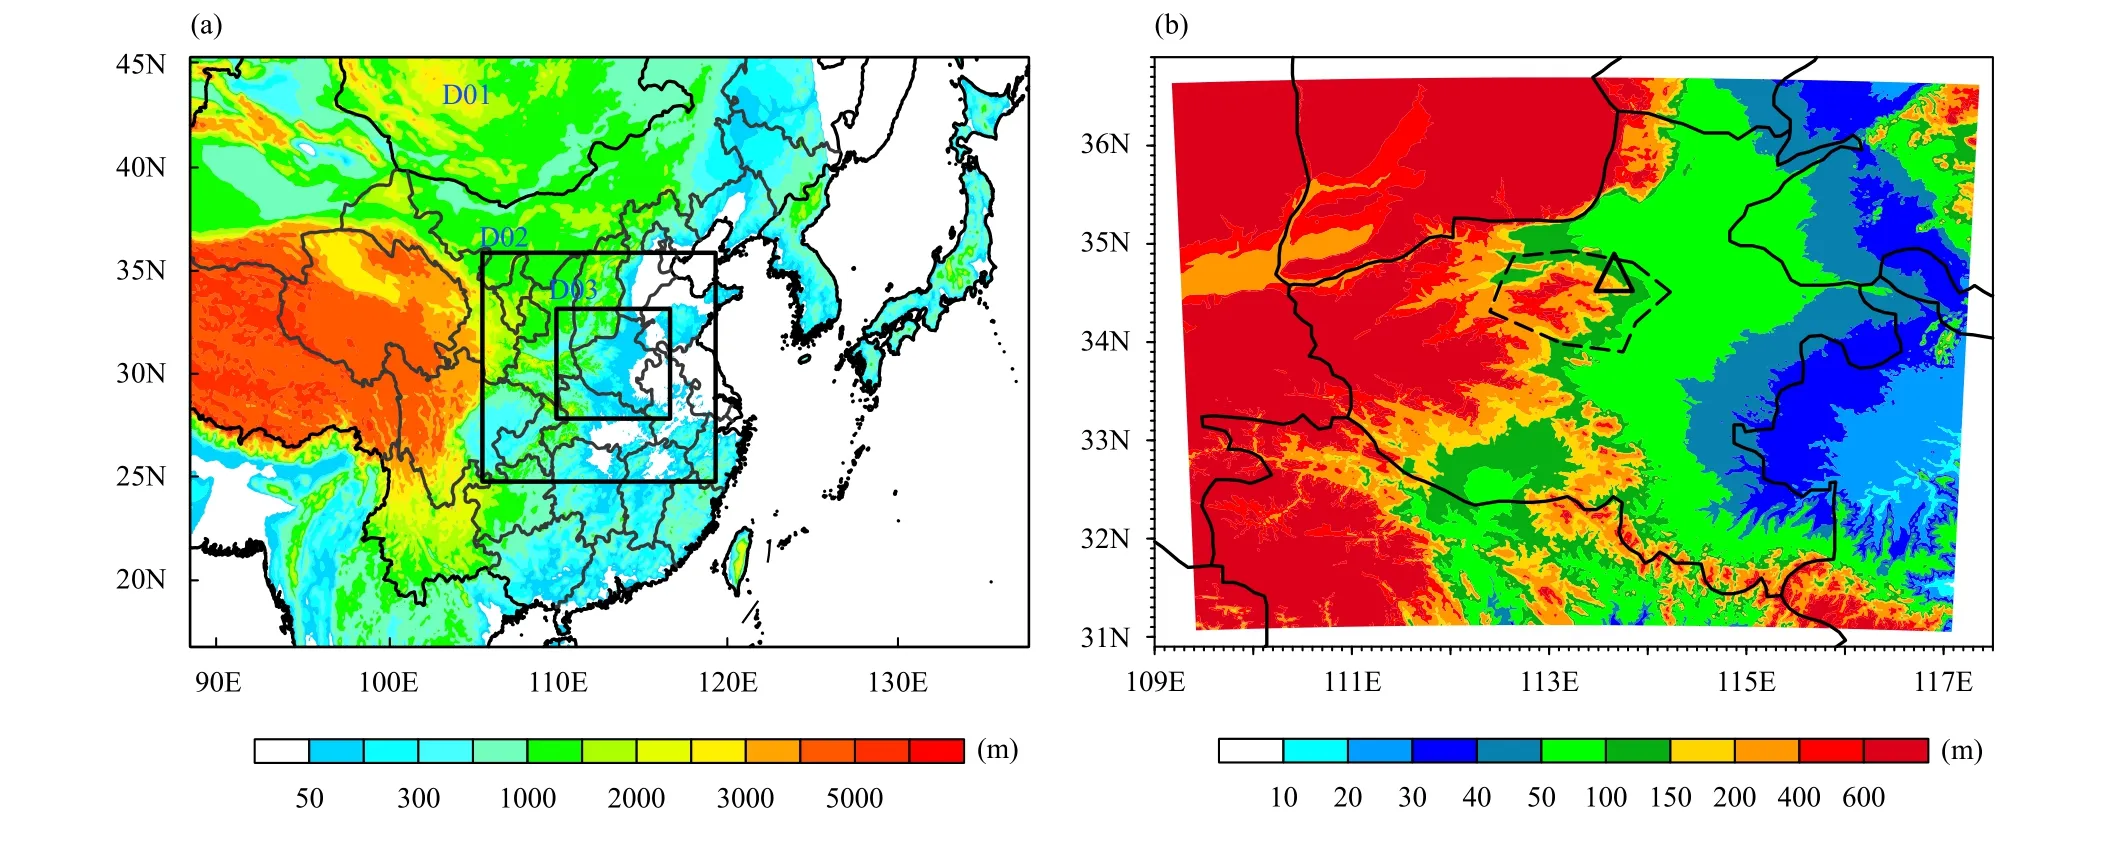
Fig. 1. (a) Nested model domains used for the WRF simulation with grid resolutions of 9 km (D01), 3 km (D02), and 1 km (D03). Shadings denote topography. (b) A zoomed-in view of D03, in which terrain (i.e., the Songshan Mountain) west of Zhengzhou (denoted by the triangle) is marked by a polygon.
The WRF model physics schemes include the US National Severe Storms Laboratory 1-moment 7-class microphysics scheme (Mansell et al., 2010), the rapid radiative transfer model (RRTM) (Mlawer et al., 1997), the Dudhia scheme (Dudhia, 1989) for long- and shortwave radiative flux calculations, the Mellor–Yamada–Janjic TKE (turbulent kinetic energy) scheme for the planetary boundary layer (Janjić, 1994), the Monin–Obukhov(Janjic Eta) scheme for the surface layer (Janjić, 1994,2002), and the unified Noah land surface model (Tewari et al., 2004). The Kain–Fritsch cumulus parameterization scheme (Kain, 2004) is utilized for the outer two domains, but it is bypassed in the finest domain D03.
The WRF simulatons over all the three nested domains are integrated for 40 h, starting from 0800 Beijing Standard Time (BST; BST = UTC + 8 h) 19 July 2021,with outputs at 6-min intervals. The initial and outermost boundary conditions are interpolated from the final operational global analysis data of the Global Forecasting System of NCEP (NCEP-FNL). In order to introduce large-scale fields consistent with the driving fields, the four-dimensional data assimilation (FDDA) functions are activated (Stauffer et al., 1991; Bowden et al., 2012) by performing the grid analysis nudging throughout the model integration. Note that the grid analysis nudging technique is easily employed by turning on FDDA options in the control (i.e., namelist.input) file, with other options all set as default.
2.2 Data
As mentioned above, the initial and outermost boundary conditions are interpolated from the NCEP-FNL global analysis (http://rda.ucar.edu/datasets/ds083.2), with 1-degree resolution and 6-h intervals. It should be noted that the datasets are made by the same model used in the NCEP Global Forecast System (NCEP-GFS), but more observational data coming from the Global Telecommunications System have been assimilated into the NCEPFNL datasets.
Surface hourly observations, including rainfall, relative humidity, temperature at 2 m, and horizontal wind at 10 m above the ground, are provided by the National Meteorological Information Center of the China Meteorological Administration (CMA) (https://data.cma.cn/data/cdcdetail/dataCode/A.0012.0001.html) after strict quality control. The dataset has been extensively used in weather and climate studies. In addition, radiosonde observations from Nanyang and Zhengzhou stations (see Fig. 2 for their locations) at the WRF model initial simulation time are used to reveal the initial vertical structure of the atmosphere.
Composite radar reflectivity observations are derived by combining observations from 18 individual radars in Henan Province and its surroundings, and the target area in this study is mainly covered by four radars at Zhengzhou, Puyang, Luoyang, and Pingdingshan (see Fig. 2).
3. The “21·7” Henan deluge and associated synoptic conditions
3.1 Rainfall characteristics
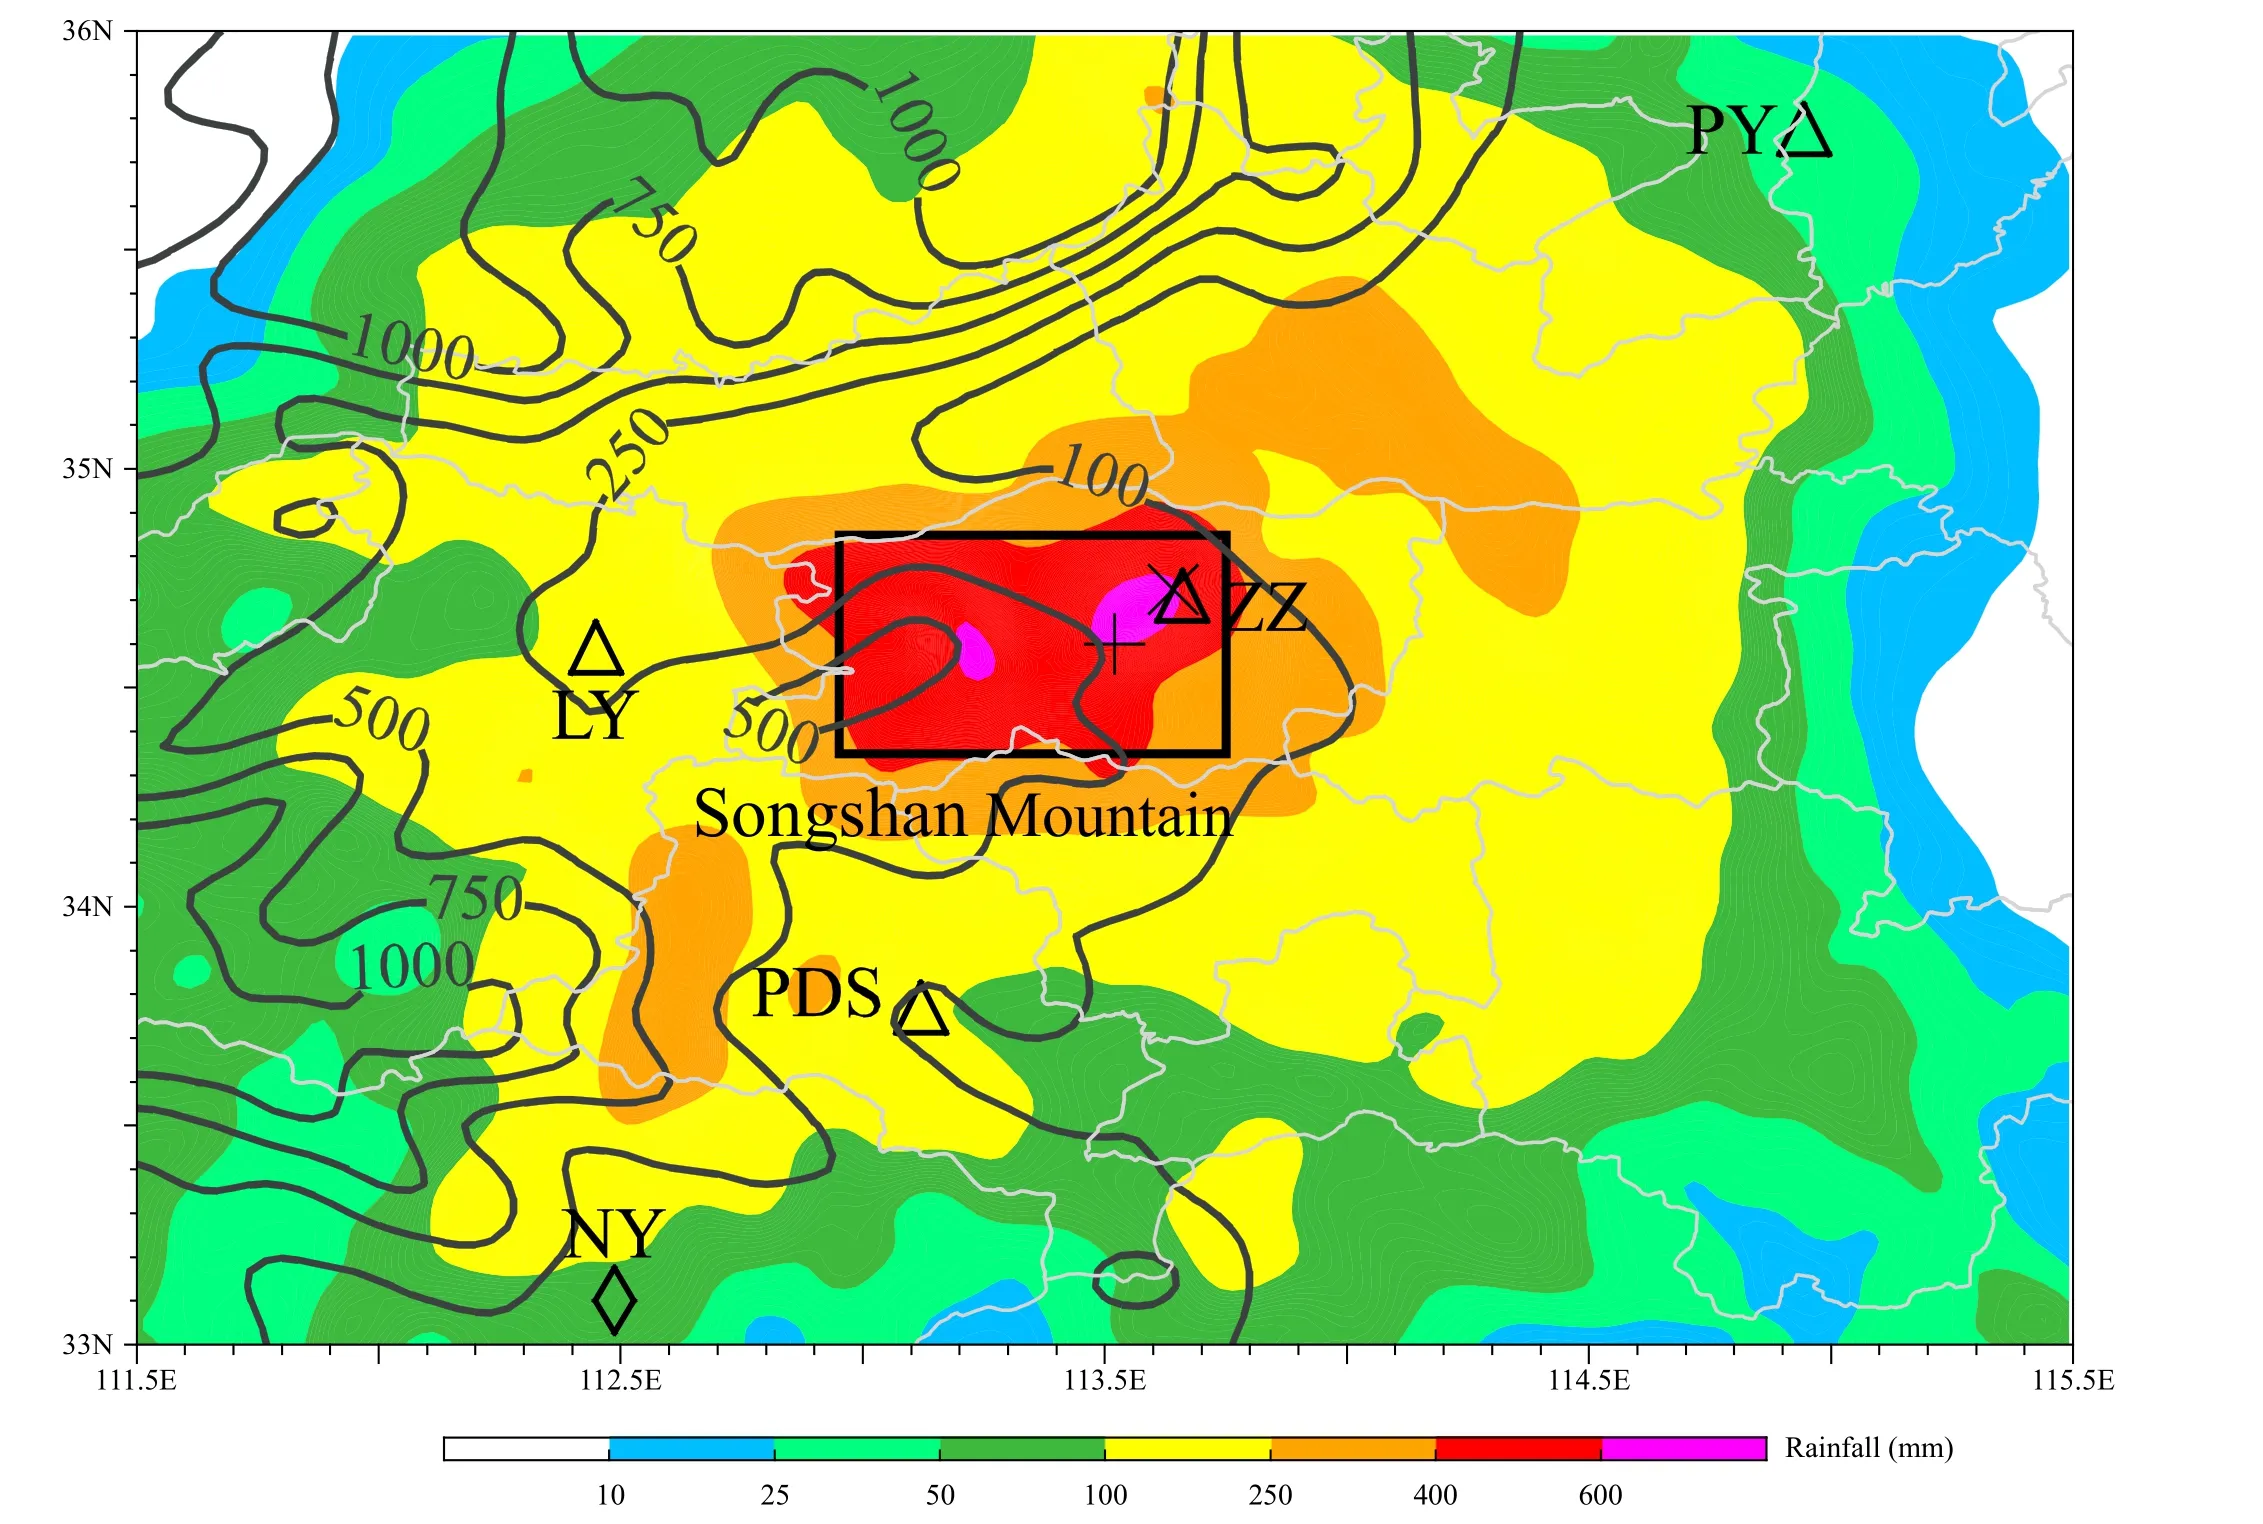
Fig. 2. Distribution of 40-h (0800 BST 19 to 0000 BST 21 July 2021) accumulated rainfall (mm; shaded) obtained from the intensive surface rain gauge observations. Black contours denote orography. The cross sign (×) and plus sign (+) denote the locations where the maximum hourly rainfall of 201.9 mm h−1 and accumulated rainfall of 818.0 mm were observed, respectively. The triangles (△) represent the locations of radar stations at Zhengzhou (ZZ), Puyang (PY), Luoyang (LY), and Pingdingshan (PDS). The rhombus (◇) sign indicates the location of the sounding station at Nanyang (NY). Note that the ZZ sounding and radar are located at the same site. The black rectangle denotes the main region with rainfall over 400 mm, and the gray lines depict borders of the prefectures in Henan Province, China (same for other figures in this paper).
Figure 2 shows the spatial distribution of 40-h observed rainfall over Zhengzhou from 0800 BST 19 to 0000 BST 21 July 2021, with a maximum amount of 818 mm at Baizhai station near Zhengzhou. A large area of Henan Province experienced total accumulated rainfall over 100 mm (see the yellow shading in Fig. 2), in which about 4000 km2registered rainfall over 400 mm (see the red shading outlined by a black box in Fig. 2). The record-breaking hourly rainfall rate of 201.9 mm h−1is observed at Zhengzhou (ZZ) meteorological station. Heavy rainfall cores (in purple) are located on the northeast side of the Songshan Mountain, over elevation of about 250–500 m.
3.2 Synoptic conditions on 19 July 2021
Figure 3 displays 500- and 850-hPa weather charts at 0800 BST 19 July 2021. At 500 hPa (Fig. 3a), the largescale circulation is dominated by coexistence of the WPSH in Northeast Asia, the Tibetan high in West China, and low pressures of Typhoon In-Fa over the East China Sea as well as Typhoon Cempaka over the South China Sea. Owing to the cyclonic flows of In-Fa and the anticyclonic circulation south of the WPSH, east to southeasterly flows prevailed over North China. Similar patterns are also seen at 850 hPa, but with east and southerly flows more dominant (Fig. 3b). Under these conditions, considerable water vapor was transported into North China, which contributed to the presence of high precipitable water (PW) of over 64 mm over this region(Fig. 3a). Water vapor flux convergence was obvious over Zhengzhou and its surrounding areas due to the convergence of east and southerly flows (Fig. 3b). Extreme downpour occurred almost in between the WPSH and the Tibetan high, and north of the two typhoons; the heavy rainfall was sort of maintained in the center of the four synoptic-scale systems, with relatively stable ambient synoptic forcings.

Fig. 3. Weather charts from the NCEP Global Forecast System Final (NCEP-FNL) analysis at 0800 BST 19 July 2021: (a) 500-hPa geopotential height (black contour; 15-gpm intervals), temperature (red contour; 2°C intervals), wind (barb; full barb denotes 4 m s−1), and precipitable water (PW; kg m−2; shaded). (b) As in (a) but at 850 hPa and with water vapor flux convergence shaded (Qc; 10−5 g kg−1 s−1).
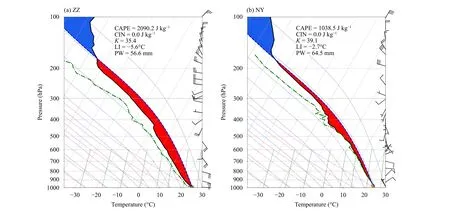
Fig. 4. Skew-T/Logp diagrams taken at (a) Zhengzhou (ZZ) and (b) Nanyang (NY) at 0800 BST 19 July 2021 (see Fig. 2 for locations). A full wind barb denotes 4 m s−1. Shadings in red and blue are for CAPE and CIN, respectively.
Figure 4 provides two upper-air sounding profiles over Zhengzhou and Nanyang stations (see Fig. 2 for their locations) at 0800 BST 19 July 2021. As is shown in Fig.2, Zhengzhou is located in the center of the extreme rainfall storm, and Nanyang is on the upstream of the storm in view of the southerly flow. Distinct features can be identified between the two profiles. Although PW of 56.6 mm at Zhengzhou was lower than PW of 64.5 mm at Nanyang, the convective available potential energy(CAPE) of 2090.2 J kg−1at Zhengzhou was more than twice that of Nanyang (1038 J kg−1). In particular, the smaller lifted index (LI = −5.6) at Zhengzhou indicated stronger instability and potentially stronger updrafts than those at Nanyang. There were no convective inhibition(CIN) and the dew-point depressions at both stations were small, suggesting that the air could be easily lifted to the lifting condensation level (LCL). Note that the large PW at Zhengzhou is close to that in the Guangzhou recording-breaking rainfall on 7 May 2017, in which hourly rainfall rates of over 184 mm were observed (Yin et al., 2020). All the features demonstrate clearly that the large-scale environmental conditions were beneficial for convective development as long as possible lifting to the LCL was given.
4. Model verification
Figure 5 presents the spatial distribution of 40-h accumulated rainfall from the WRF simulation from 0800 BST 19 to 0000 BST 21 July 2021. Compared to the observation in Fig. 2, the model in general replicates reasonably well the spatial distribution of the heavy rainfall,especially for the 250–600 mm rainfall core over Zhengzhou. The simulated extreme rainfall amount compares favorably to the observed in Zhengzhou, with only a slight location error. We may argue that these location errors are acceptable, given the fact that the model atmosphere is initialized with large-scale meteorological conditions (i.e., the NCEP-FNL analysis data) without any mesoscale data assimilation. Particularly, the model simulates a peak 40-h accumulated value of 704 mm, as compared to the observed maximum value of 818 mm.Except for errors in initial and lateral boundary conditions, the under-predicted accumulated rainfall may be caused by the cloud microphysics scheme. Despite certain deficiencies, the WRF model’s capability in reproducing the total rainfall is encouraging. In the next sections,we will inspect how the extreme rainfall core is produced over Zhengzhou. By the way, the outer two domains D01 and D02 reproduced 40-h maximum accumulated rainfalls of 548 mm and 667 mm, indicating that high-resolution (kilometer-scale) numerical weather prediction is essential for more accurate forecast of extreme rainfall. This partially explains why then operational models under-predicted the rainfall in Henan Province in July 2021.

Fig. 5. As in Fig. 2 but for the accumulated rainfall (mm; shaded) from the 40-h simulation from 0800 BST 19 to 0000 BST 21 July 2021. Contours denote topography in the model.
Figure 6 compares the time series of hourly rainfall rates between the observed and simulated at the station where the maximum hourly rainfall rate was observed or simulated. The observed peak rainfall episode occurred from 1600 to 1700 BST on 20 July with an hourly rainfall rate of 201.9 mm h−1, and the corresponding simulated peak value of 233 mm h−1took place during 1500–1600 BST 20 July 2021. That is, the simulated rainfall peak is about 1 h earlier than the observed.However, the observed timings of initiation and end of the extreme rainfall (near 1400 and 1900 BST 20 July,respectively) are well replicated. Specifically, the observed hourly rainfall rate increased from about 12.3 to 60.6 mm in 1 h (i.e., from 1500 to 1600 BST), and then to 201.9 mm in the following one hour (i.e., from 1600 to 1700 BST). Well-matched, the simulated rain rate increased from 18 mm h−1at 1400 BST to about 51 mm h−1at 1500 BST, and then to 233 mm h−1at 1600 BST 20 July 2021. Afterwards, both the observed and simulated rainfall rates exhibit similar decreasing trend, although the simulated one shows smaller rain rates in the last several hours. During the concentrated period of heavy rainfall (i.e., 1400–1900 BST 20 July), double rainfall peaks were more clearly observed in the 6-min radar rainfall observation, and the double peak mode is reproduced successfully by the WRF model, with the second peak coincident with the observed one.
Figure 7 illustrates the ability of WRF in reproducing the structure and evolution of convective cells, by comparing the simulated composite radar reflectivity, surface wind field, and temperature with those observed. In the observations (Fig. 7a), several convective cells showed up at 1130 BST 20 July along the east to north edge of the Songshan Mountain over 250–500-m altitudes.Meanwhile, an obvious coverage of trailing stratiform rainfall appeared on the north side of the dense equivalent potential temperature band (θefront) under the influence of the mid-tropospheric south-to-southwesterly flows. After 2.5 h, only two convective cells continued to develop, and others dissipated (Fig. 7b). Subsequently,the two convective cells merged around 1530 BST, and a well-organized convective cell formed over Zhengzhou at about 1630 BST (Fig. 7c). Once formed, the storm began its rapid development, with its peak radar reflectivity over 58 dBZ, attributable to the distinct northwestward expansion of the high-θetongue (Figs. 7b, c).
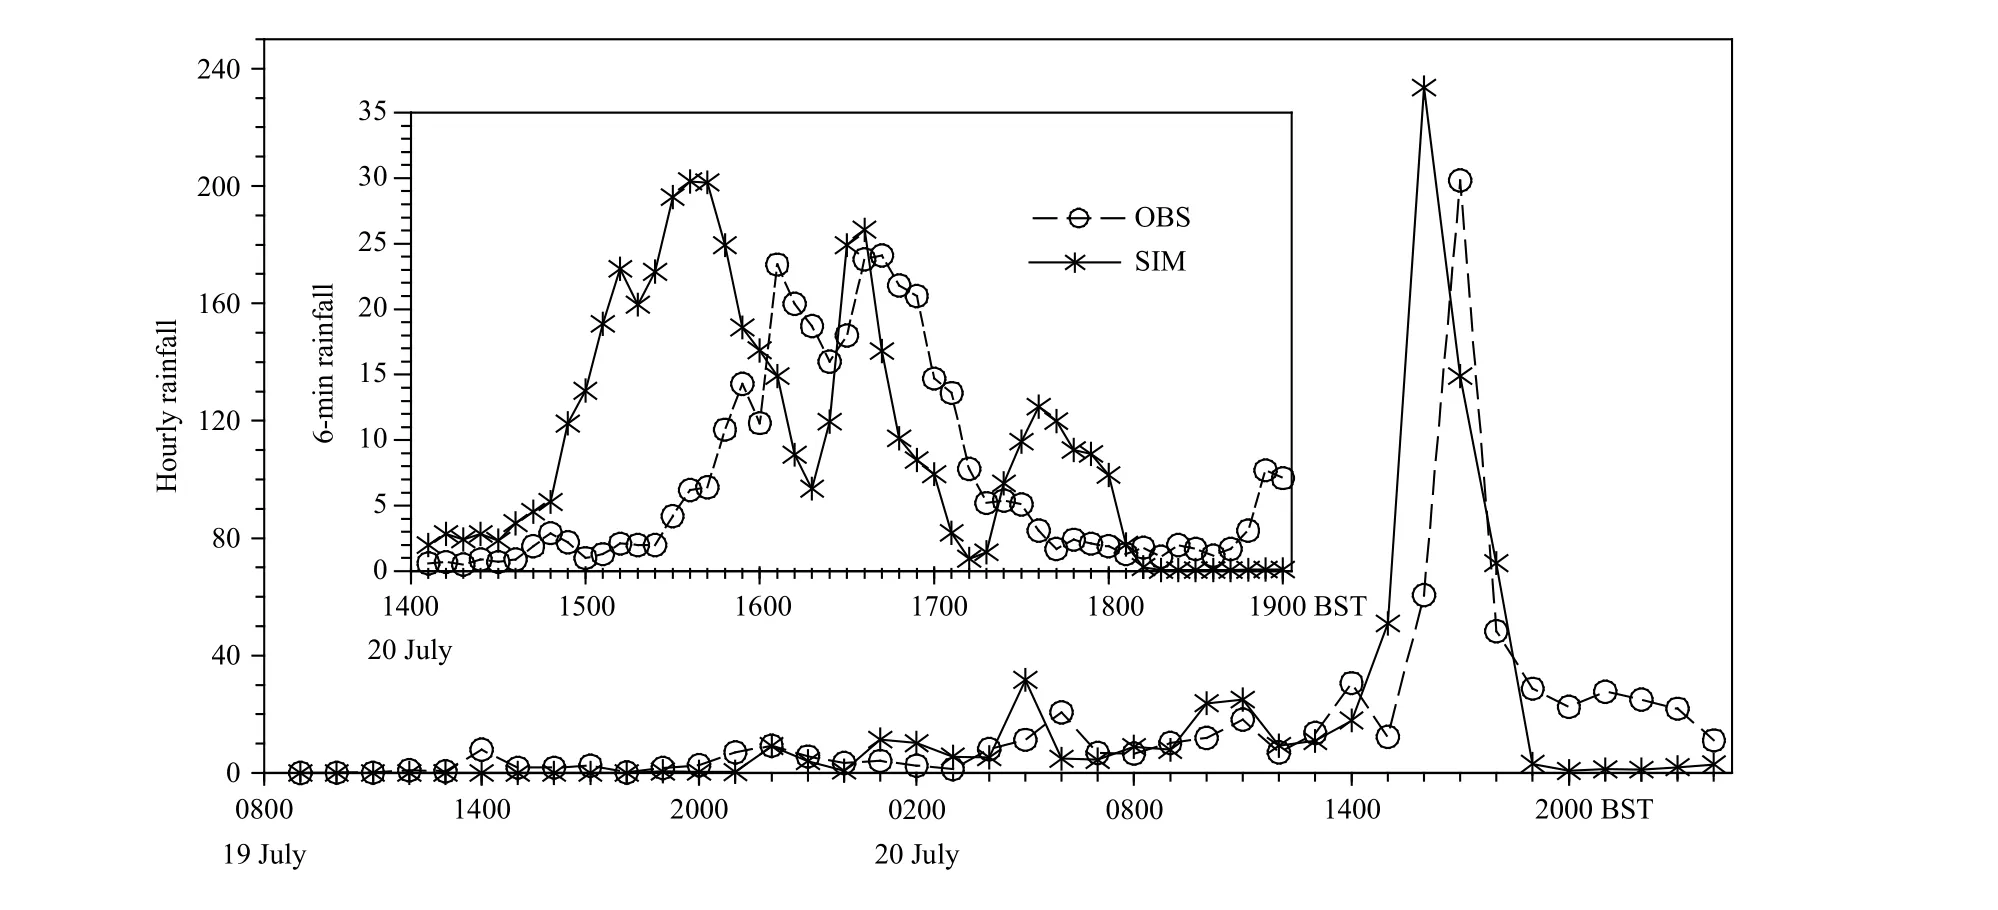
Fig. 6. Time series of the rain gauge observed (dashed curve with circles) and WRF model simulated (solid curve with stars) hourly rainfall(mm h−1) at the station/location where the maximum hourly rainfall occurred near Zhengzhou (ZZ) during 0800 BST 19 to 0000 BST 21 July 2021 (see Figs. 2, 5 for the locations). The inner panel presents temporal evolution of 6-min rainfall [mm (6 min)−1] during the extreme rainfall stage (i.e., 1400–1900 BST 20 July 2021).
It is obvious from Figs. 7e–h that the model replicates developments of the convective cells and the storm, with major features similar to the observed, such as the quasistationary convection, its north- and northeastward expansion, meso-γ-scale convection size, reflectivity intensity, and the high-θetongue ahead of the extreme-rainfall producing storm. The model also markedly replicates the growth of the cloud system with a wide coverage of stratiform rainfall on meso-β–αscale over the north–northeast of the study domain. Note that the initiation and organization of the simulated storm are about 1 h earlier than the observed, at a location a few kilometers to the southwest of the observed storm. They are in line with the timing ahead of the maximum hourly rainfall production, and the spatial error is shown in Figs. 6 and 5, respectively. Of importance is that the model replicates a southwest–northeast-oriented dense band of surfaceθewith an obvious line of convergence of the warm moist south-to-southeasterly flows of oceanic origin from the East China Sea with the cold dry north-to-northeast flows from North China.
To further validate the WRF model’s capability in replicating the extreme-rainfall producing storm, we compare the simulated vertical structures through the storm center against the observed mosaic radar products in Fig.8. Note the different times used for the comparison as the simulated result is 1 h earlier than the observed, in terms of the maximum hourly rainfall, as shown in Fig. 7. In general, the model captures reasonably well the distinct vertical structures, albeit somewhat stronger than the observed.
Given the decent consistency between the simulation and observation in timing and location of the initiation,organization, and spatial distribution of the storm, we next employ the high resolution data from the simulation over D03 to examine in detail the convective initiation and evolution, as well as the extreme rainfall generation in the following section. Special attention will be paid to the three-dimensional structure and evolution of the extreme-rainfall producing storm.
5. Evolution of convection and mechanism for extreme rainfall production
5.1 Roles of the Huang–Huai cyclone
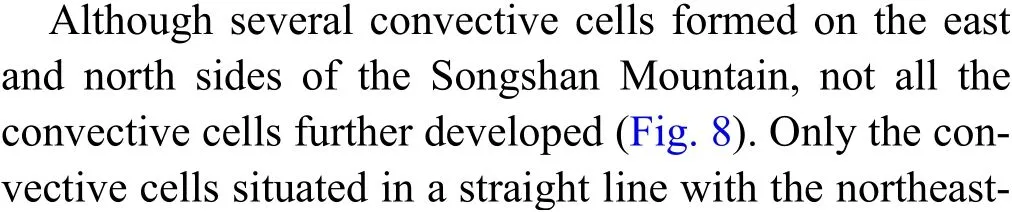
Based on the approximately realistic simulation mentioned above, we attempt to use the simulated results to investigate unobserved characteristics that might have contributed to the initiation and evolution of convection and its subsequent organization into an extreme-rainfall producing storm near Zhengzhou. Figure 9a shows the track of the Huang–Huai cyclone and corresponding hourly accumulated rainfall over 15 mm from 0930 BST 19 to 2030 BST 20 July. Here, we define the“Huang–Huai cyclone” according to the cyclonic rotations of the horizontal wind at 850 hPa, which originated in the middle and lower reaches of the Huang–Huai River basin in China with a lifetime longer than 12 h. It should be noted the Huang–Huai cyclone cannot be well recognized in terms of at least one closed contour with 2.5-hPa intervals in the sea level pressure field (see letter L in Fig. 9b). Clearly, the Huang–Huai cyclone moved northward during 0930 BST 19–0530 BST 20 July, and then it turned southwestward. Of significance is that the moving speed of the Huang–Huai cyclone decreased remarkably; it stayed at almost the same location during 1030–1530 BST. The blocking effect of the Songshan Mountain might be mainly responsible for the slowdown of the Huang–Huai cyclone.

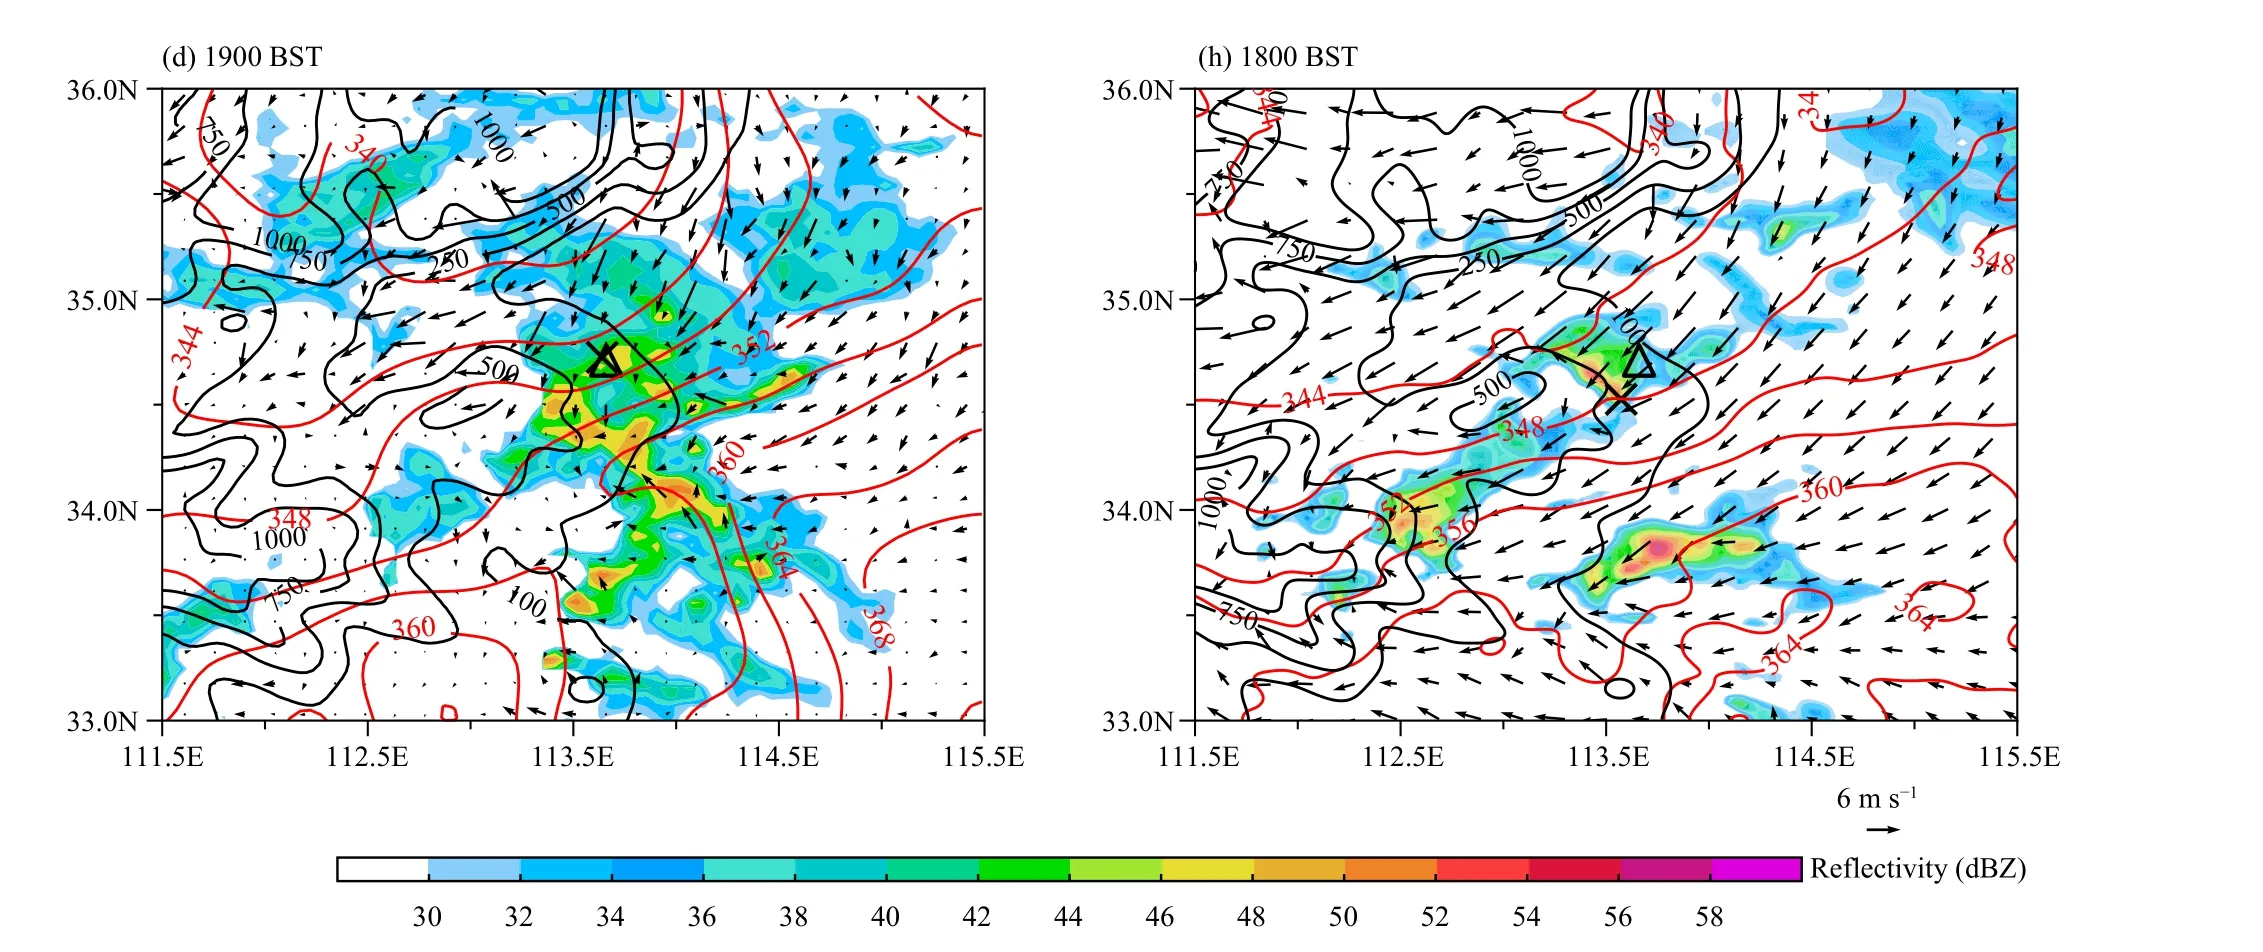
Fig. 7. Distributions of (a–d) observed and (e–h) simulated composite radar reflectivity (dBZ; shaded), surface (z = 10 m) wind (vector;m s−1), surface (z = 2 m) equivalent potential temperature (θe; red contour at 2-K intervals) during 1130 to 1900 BST 20 July 2021. Black contours denote terrain in the model. Note that the simulation is an approximate display in the sense that there exists an 1-h discrepancy between simulation and observation due to the error in the timing of simulated convective development. A reference wind vector is provided next to the reflectivity color scale. The black thick lines A1B1 and A2B2 denote locations of the vertical cross-sections used in Fig. 8. The inner black box in(g) denotes a zoomed-in area used by Fig. 12, in which there is a mesoscale-γ-scale convective system with radar reflectivity over 58 dBZ.
Figure 9b displays the simulated sea level pressure and 850-hPa horizontal wind over the innermost domain(D03) when several convective cells sprouted along the east to north edge of the Songshan Mountain. One can see that a weak cyclone was visible in the Huang–Huai region, with the cyclonic vortex center located to the southwest of Zhengzhou. Convection was triggered by the convergence of southeasterly and easterly flows over east-to-northeast of the Huang–Huai cyclone. Previous studies (e.g., Feng et al., 2001; Fu et al., 2017; Xia and Zhang, 2019) have confirmed that strong rainfalls always occur along the spiral band in the north side of the Huang–Huai cyclones due to certain synoptic-scale forcing. This characteristic can be viewed from the widespread convective clouds represented by cloud top temperature (see shadings in Fig. 9b). The presence of the weak Huang–Huai cyclone, connected with the cyclonic circulation of Typhoon In-Fa and the anticyclonic circulation south of the WPSH (cf. Fig. 3), furnished stable and abundant warm moist water vapor needed for the generation of heavy rainfall. In addition to the favorable large-scale conditions for energy supply and convective initiation, the quasi-stationary forcing of the weak Huang–Huai cyclone facilitated sustained growth of the storm at the same location. Except for quasi-stationary forcing and ample moisture supply, favorable orographic uplifting is another key factor causing the extreme heavy rainfall (Lin et al., 2001).
Actually, favorable synoptic-scale weather systems provide an ideal breeding bed for heavy rainfall, while the well-organized mesoscale convective system is the primary producer of extremely heavy rainfall (Luo and Chen, 2015; Xia and Zhang, 2019; Yin et al., 2020,2022). Regarding the “21·7” extreme rainfall over Zhengzhou, we need to pay more attention to the mesoscale convective system initiation and development and the subsequent generation of extreme rainfall under a stable moisture supply. In the next section, we will focus on the convective cell(s) that produced the extreme rainfall in Zhengzhou.
5.2 Convection initiation
To examine the convection initiation, Figs. 8d–f illustrate vertical cross-sections ofθeand in-plane flow vectors through the convective core(s) from 1030 BST to 1530 BST 20 July, during which the simulated storm initiated, grew, and then dissipated. At the initial time (i.e.,at 1030 BST), Zhengzhou was dominated by northeasterly flow at low levels (below 3 km). The warm moist air from the East China Sea, associated with the Huang–Huai cyclone, WPSH, and Typhoon In-Fa, was blocked and lifted when it was approaching the Songshan Mountain, as viewed in Fig. 8e. Another key player is the enhanced westerly flows. Figure 10 displays temporal evolution of domain-averaged horizontal wind from 10 × 10 points centered at A2(see Fig. 8e for its location). It can be seen that thev-wind strengthened at about 0000 BST 20 July, which caused an enhancement in the humidity of the air. The strengthenedv-wind led to slight changes in convective systems, although the air was further moistened in view of the difference between temperature and dew-point temperature. Most importantly, theu-wind strengthened significantly at 1000 BST 20 July, which caused strong convergence on the east and north sides of the Songshan Mountain (Fig. 11). As a result, convection was initialized ahead of the Songshan Mountain. We conclude that the Songshan Mountain plays a significant role in determining the location of the convection, and the strengthenedu-wind determines the timing of the rapid development and organization of the convection. It should be highlighted that although both the Songshan Mountain and strengthenedu-wind have important effects on the convection, the latter plays a leading and decisive role in the rapid development and organization of the convection.
5.3 Convection evolution
Except for the orographic blocking, the strong convergence in the planetary boundary layer, which was generated by the warm moist south-to-southeasterly flows of oceanic origin from the East China Sea and the cold dry north-to-northeast flows from North China, played significant roles in the convective development and maintenance of deep convection associated with the organization of the extreme-rainfall producing storm over Zhengzhou(Fig. 11). It should be noted that the strong convergence was also attributed to the enhanced southwesterly flow.One can see that the convergence band had an eastward shift, consistent with the evolution of the southwesterly flow (Fig. 11). With the high-θetongue expanding northwestward (Fig. 7g), as indicated by theθegradient, the northeasterly flows were enhanced, which was favorable for the development of the storm. Once the convective system was organized, the associated latent heat release could enhance the upward motion and the convergence of mass and moisture in the lowest layers (Yin et al.,2018). Owing to presence of little CIN (Fig. 3a), it took only about 2.5 h (by 1300 BST) for the storm to develop into a robust convective system (Figs. 8d, e). Moreover,the enhanced northeasterly flows further prompted the lifting and convergence (Fig. 8e). As a result, the warm and moist air in the planetary boundary layer was lifted to the LCL. All these processes worked together, forming a well-organized convective system (Fig. 8f).
Fig. 9. (a) Temporal evolution of the Huang–Huai cyclone (thin color circle; at 5-h intervals), the track of which is denoted by the black line connecting the circles; and the corresponding hourly rainfall (thick closed color contour; only values larger than 15 mm are shown). The color of the cyclone matches that of the rainfall at the same timing. In addition, the cyclone circles at 1030 and 1530 BST are filled in red and purple to respectively indicate the initiation and organization of the meso-γ-scale convective system. (b) Simulated sea level pressure (black contour at 1-hPa intervals), cloud top temperature (shaded; °C), and horizontal wind field (vector; m s−1) at 850 hPa over the innermost domain (i.e., D03) at 1030 BST 20 July 2021. Letter L in bold blue in (b) denotes the center of the Huang–Huai cyclone, and the box marked with white lines denotes the area of the meso-γ-scale convective system.
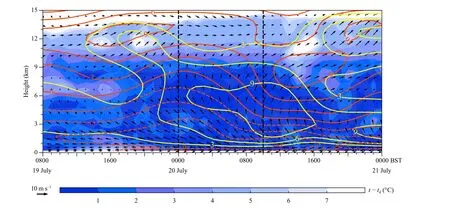
Fig. 10. Height–time evolution of the domain-averaged horizontal wind (vector; m s−1) over 10 × 10 horizontal grid points centered at A2 (see Fig. 8e for its location). Shadings denote the difference between temperature and dew-point temperature (t − td, °C). Red and yellow contours denote u- and v-wind components.
The above results indicate importance of (i) the stable southwest–northeast-oriented oceanic origin flows across Zhengzhou City in the lowest 2 km (Figs. 7–8) due to the quasi-stationary Huang–Huai cyclone, (ii) the blocking lifting of the Songshan Mountain and the southwesterly flow enhancement to facilitate the upward motion (Figs.8d–f), and (iii) the high-θetongue expanding northwestward to enhance convergence (Fig. 7). It should be noted that a sensitivity simulation without the Songshan Mountain was also performed to examine the role of the Songshan Mountain southwest of Zhengzhou in the convective initiation and subsequent production of the extreme heavy rainfall over Zhengzhou. The results show the importance of orography in blocking lifting at the east–north edge of the Songshan Mountain, which in turn facilitates convective initiation and development, and heavy rainfall generation in Zhengzhou. A detailed analysis of the role of the Songshan Mountain in the extreme rainfall event will be reported in another paper.
As the extreme rainfall continued, the high-θetongue retreated southeastward (Figs. 7g, h). Theθegradient decreased and the east to northeasterly convergence weakened, leading gradually to weakening of the storm due to the decrease in warm water vapor supply. Most importantly, new convection occurred on the tip of the high-θetongue, located south of the storm (Fig. 7g). As the newborn convection developed, a south–north oriented convective belt was established, with connection to the original storm. Shortly after, the convective region became more south–north oriented and moved rapidly eastward away from Zhengzhou. In addition, energy supply decreased due to the change of the Zhengzhou storm orientation with respect to the incoming warm moist oceanic origin air stream. As a result, the Zhengzhou storm weakened. This is confirmed by view of the deformation in the arc-shaped updraft zone in Figs. 12e, f.That is, the arc-shaped updraft zone began to split into two south–north oriented updraft bands with more stratiform rainfall occurring on the south.
5.4 Generation of the extreme rainfall over Zhengzhou
Figure 12 illustrates a zoomed-in view of the evolution of the storm over a 40 km × 30 km subdomain during the simulated heavy rainfall stage (1430–1730 BST).One can see the meso-β-scale flows surrounding the storm and the convergence of southeast to northeasterly warm, moist air with the northwest to westerly relatively cold air, and the former is more dominant ahead of the storm during this stage. Although there are a few weakening cells in the west (Fig. 12a, b), the major storm remains robust as a distinct single convective cell. It is eyecatching that there develops a wide arc-shaped (threequarters of a circle) zone of updrafts in the western,southern, and eastern parts of the convective cell, along with a wide-spread trailing heavy rainfall region, starting from 1500 BST (Figs. 12b, c). Clearly, the arc-shaped updraft distribution with large ascending areas would have lifted much moist air to the upper levels and thus generated the extremely high hourly rainfall, with as much as condensed precipitation particles falling into the same trailing region.
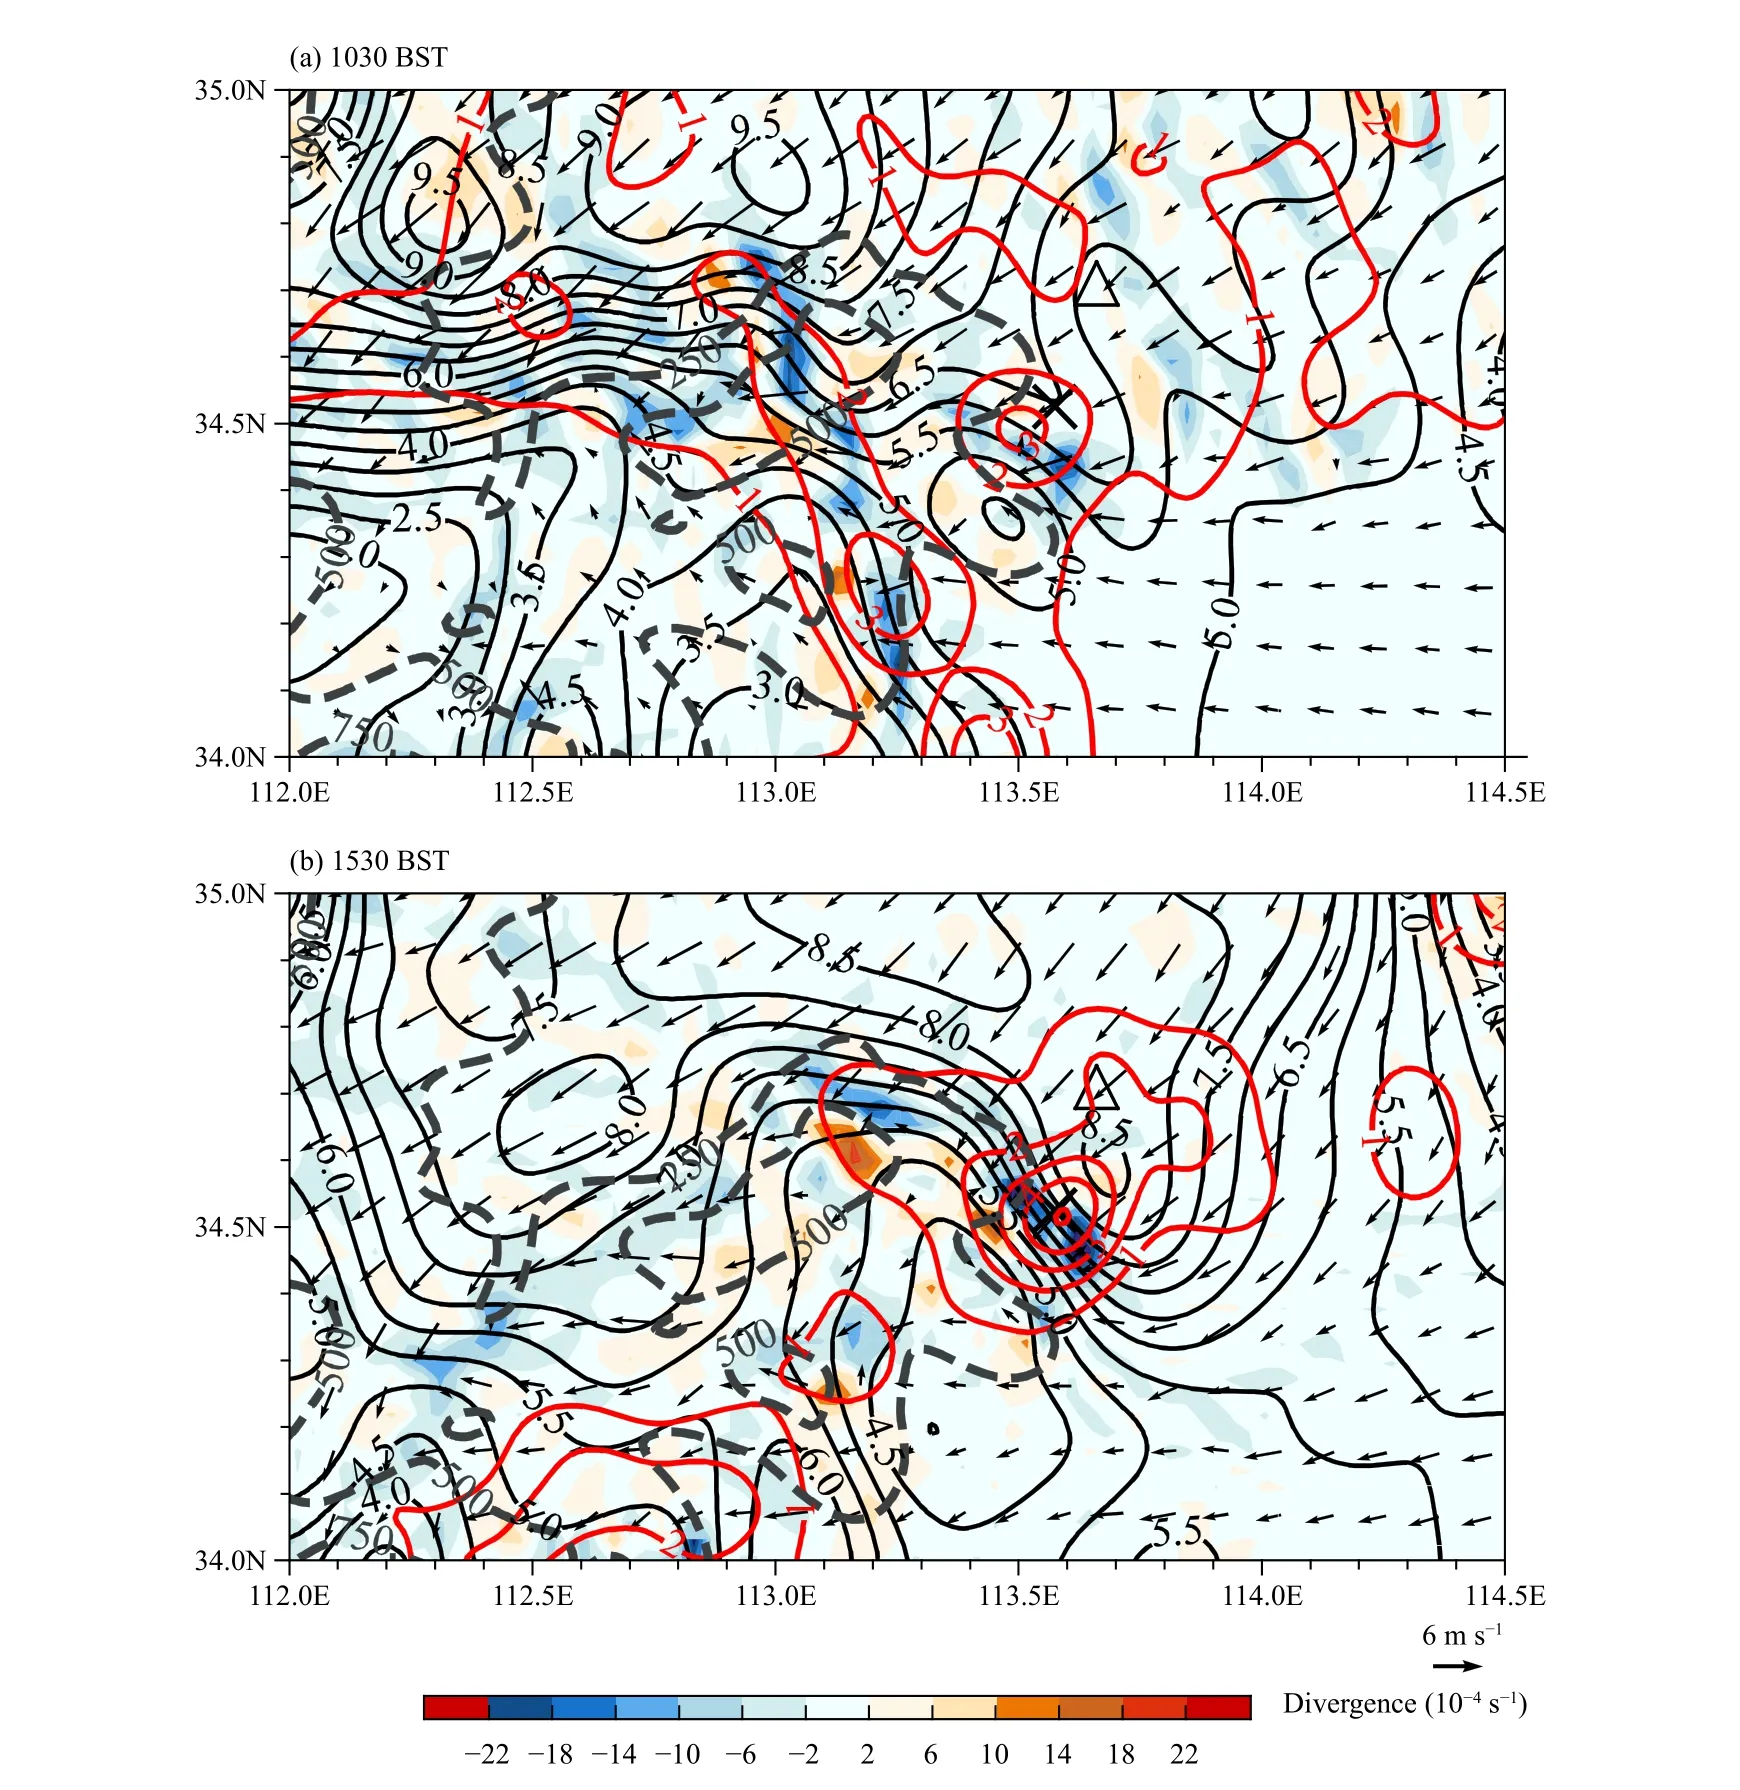
Fig. 11. Surface (z = 10 m) divergence (shaded; 10−4 s−1), horizontal wind vector and wind speed (black contour; m s−1), and column maximum updraft speed (red contour; m s−1) valid at (a) 1030 and (b) 1530 BST 20 July 2021. Thick gray dashed lines denote terrain.
The collocated rainfall region from the arc-shaped updraft zone can be viewed from three vertical cross-sections across the surface rainfall center (Fig. 13). One can see the development of northward-tilted updrafts with peak intensity of over 8 m s−1near 5-km altitude, and downward-titled high reflectivity (or heavier rainfall) underneath the updrafts, as well as a trailing stratiform rainfall region (Fig. 13a). It is notable that the downwardtitled high reflectivity is coincident with the downdrafts in the trailing region below 3 km, suggesting that the significantly developed downdrafts may result from the dragging effect of falling raindrops in the heavy rainfall region. Of interest is that the high reflectivity reached the ground, suggesting that there is little evaporation due to high relative humidity (cf. Fig. 3). Correspondingly,there is no obvious convective cold pool in the present case. The slightly northwestward-tilted updrafts across the denseθeband (θefront) have a peak intensity of over 12 m s−1near 3-km altitude, and a downward-titled high reflectivity column is obvious (Fig. 13b). Similar vertical circulation structures appear in the southwest–northeast cross-section (Fig. 13c), showing obvious northeastward-tilted ascending flow above 2 km, which produced additional rainfall over the same area.

Fig. 12. A zoomed-in view (see the big area in Figs. 7g, 9b) of the meso-γ-scale convective system produced half-hourly rainfall amount (mm;shaded), horizontal wind (m s−1; vector), and updraft greater than 1 m s−1 and downdraft less than −1 m s−1 (black contour at 3.0 m s−1 intervals)at 1.5-km altitude from the simulation over 1430–1700 BST 20 July 2021. Lines CD, EF, and GH in (c) denote the locations of the vertical crosssections used in Fig. 13.
Browning et al. (1976) depicted a detailed vertical section along a storm’s inflow, in which the trajectory of the growing particles crossing the streamlines was given. In the present case, condensed precipitation particles are transported into the same trailing region by multidirectional motion within the quasi-stationary meso-γ-scale convective system, especially in the arc-shaped updraft zone. As a result, the overlay of the precipitation from different directions could have produced the extreme hourly rainfall. The more the condensed precipitation particles are transported from multiple directions within the convective system, the stronger the rainfall is. This extrudes the important role of the arc-shaped updraft structure in the extreme rainfall production. The fact that little updrafts develop in the north of the storm is perhaps due to the incoming northerly flow in a weak (even without) lifting environment. It should be stressed that the meso-γ-scale convective system is an integrated and coordinated organization, and the extreme rainfall occurs within the same convective system. Compared to the extreme hourly rainfall event in Guangzhou analyzed by Yin et al. (2020), the arc-shaped updraft zone in the“21·7” Zhengzhou City storm shows a larger radian,which may explain the larger maximum hourly rainfall rate in the this case than that in Guangzhou City of southern China.
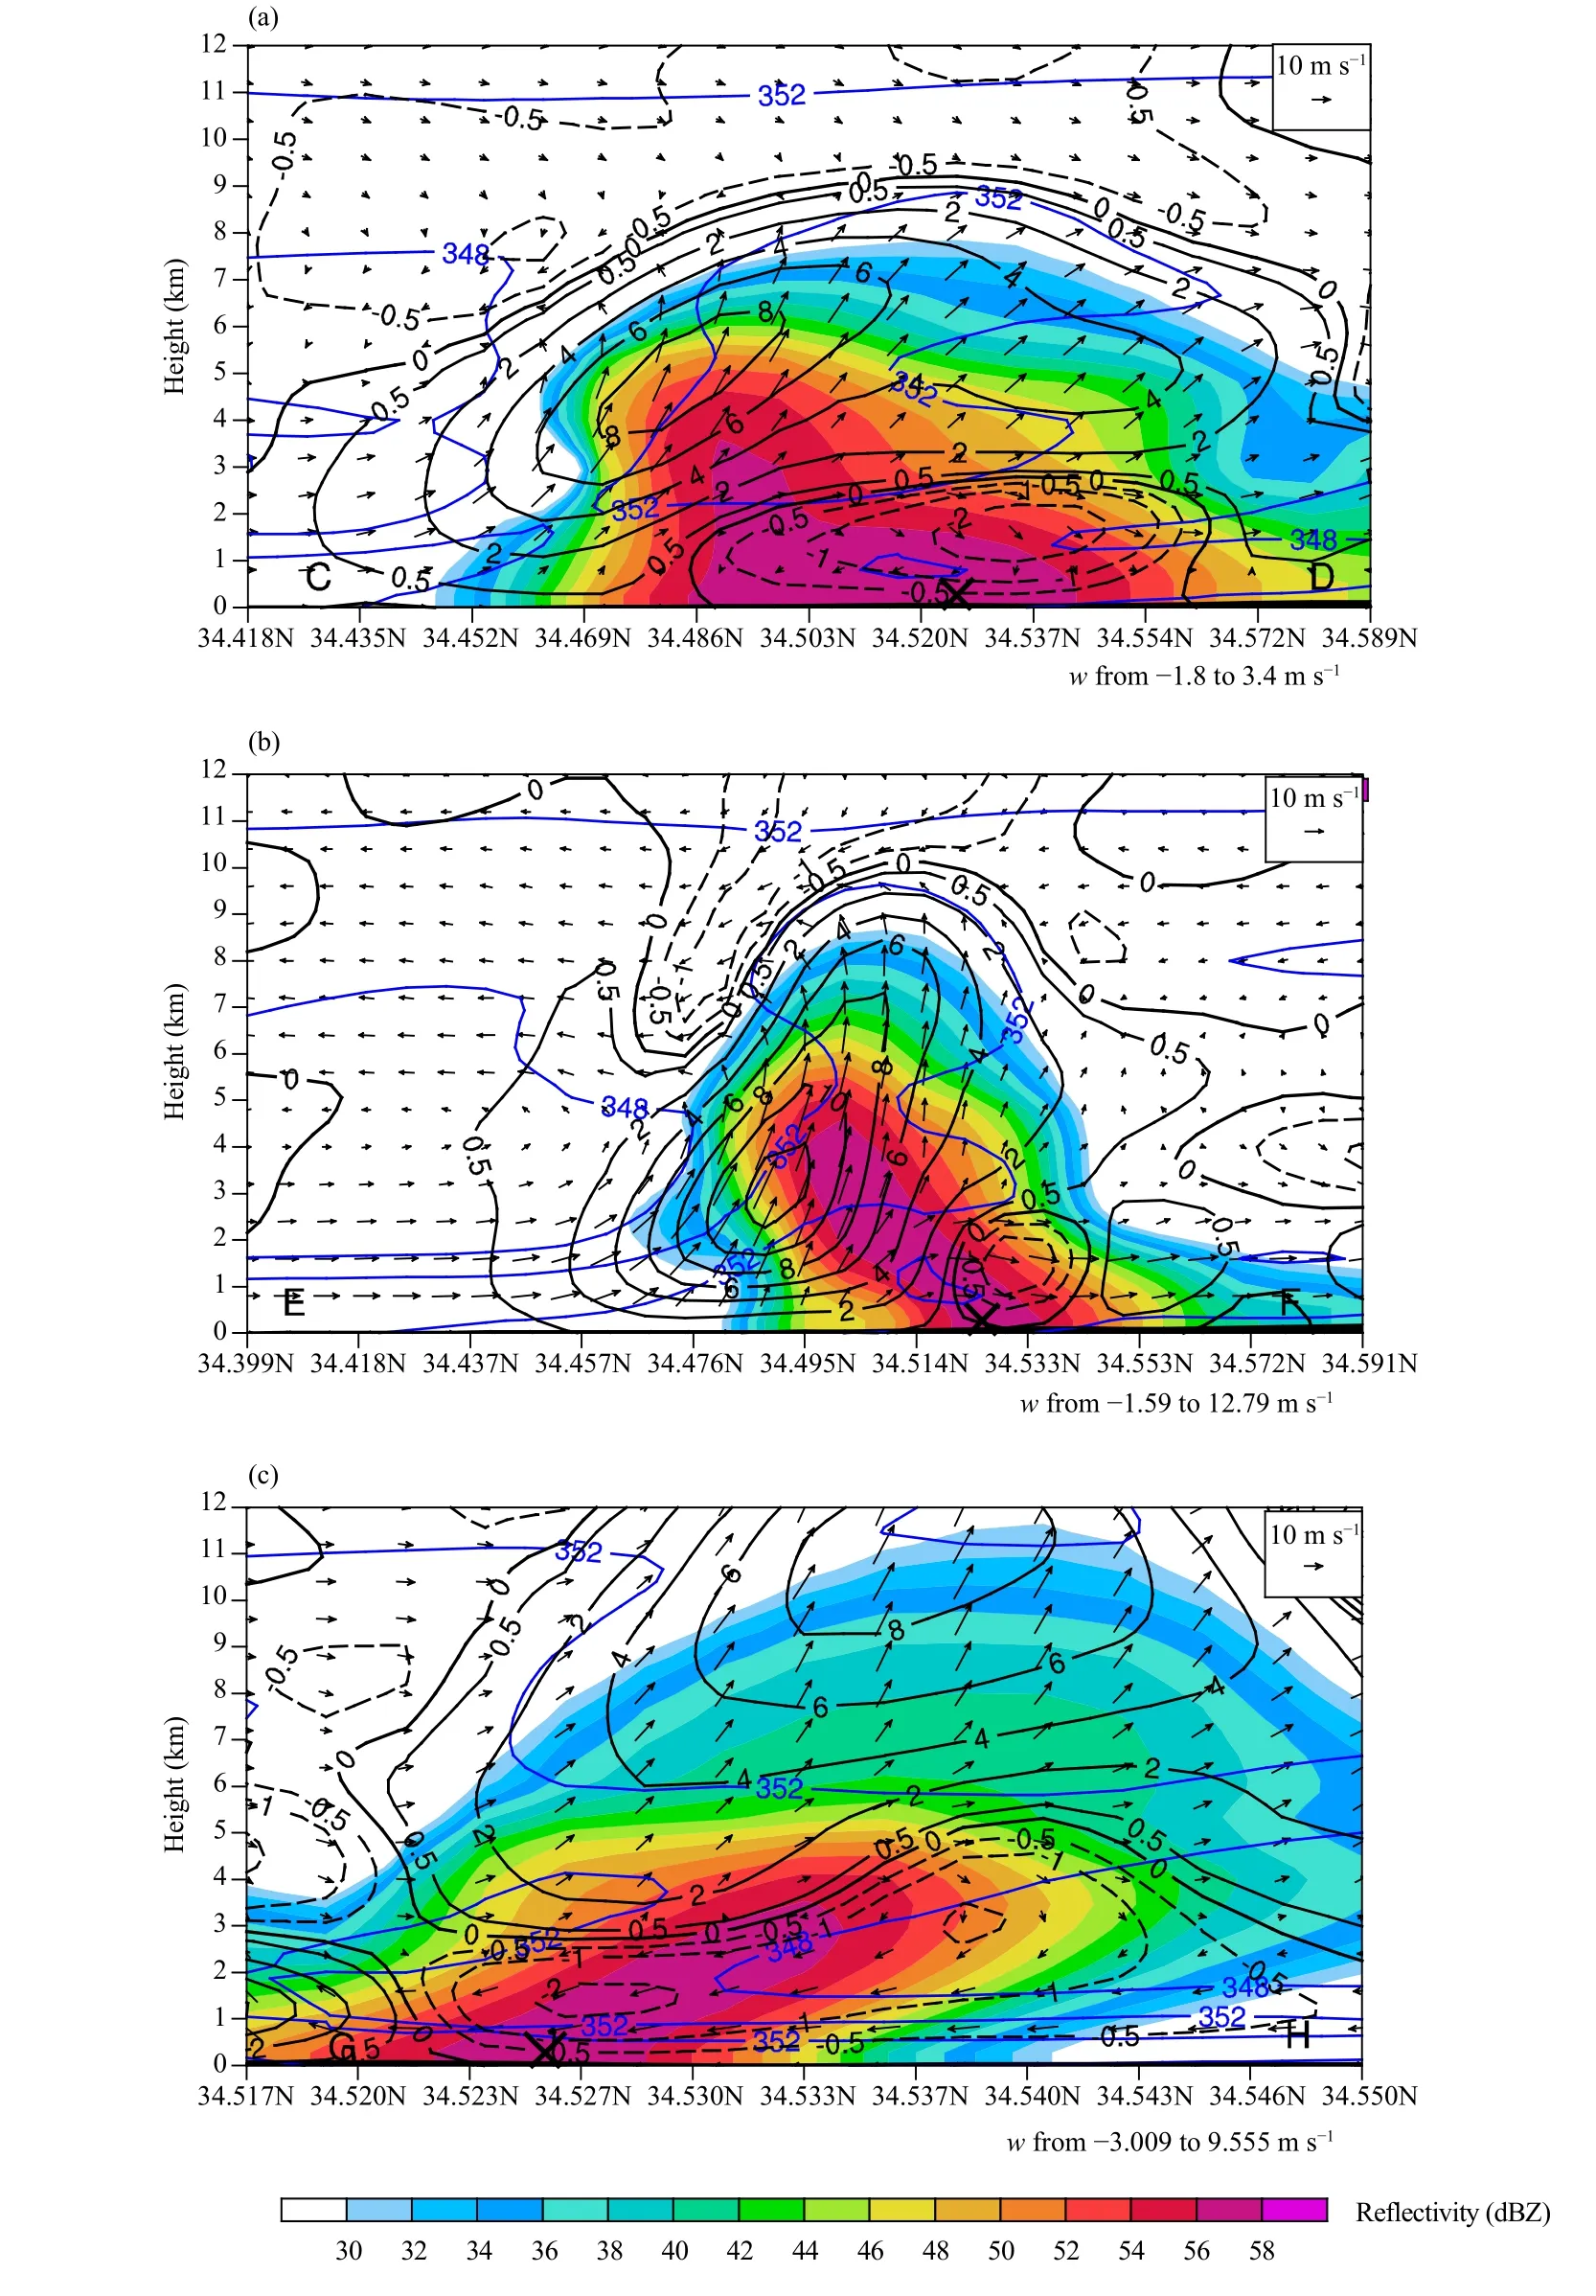
Fig. 13. Height–latitude cross-sections of the simulated radar reflectivity (dBZ; shaded), equivalent potential temperature (θe; blue contour at 4-K intervals), vertical motion (black contour; m s−1; only those smaller than −0.5 m s−1 and larger than 0.5 m s−1 are shown), and in-plane flow vectors (vertical motion amplified by a factor of 2.5) along lines (a) CD, (b) EF, and (c) GH (the lines are given in Fig. 12c).
It is of further importance to note from Fig. 12 the appearance of the quasi-stationary cyclonic rotation associated with the storm during the extreme rainfall period, although there is little evidence for formation of a compact sub vortex. Nonetheless, the arc-shaped updraft zone and the cyclonic rotation flows are tightly interconnected. Within the quasi-stationary cyclonic rotation, an arcshaped convergence zone is formed in the planetary boundary layer (Fig. 14). More specifically, obvious convergence of southwest and northeasterly flows occurs in the southeast of the meso-γ-scale convective storm. Consequently, an arc-shaped updraft zone is present. One can see that the arc-shaped convergence is exactly consistent with the arc-shaped updraft zone in the planetary boundary layer (Figs. 14b, c). Therefore, deep convective cells develop around the meso-γ-scale convective cell, like a spiral rainband. Precipitation produced from the updrafts at the same time are transported and falls into the same trailing region. The overlay of all precipitation from multiple directions within the meso-γ-scale convective cell explains the extreme peak rainfall rate of 233 mm h−1occurring over Zhengzhou from 1500 to 1600 BST 20 July.We have noticed the statistical results of Nielsen and Schumacher (2020a), who demonstrated that extreme hourly rainfalls were attendant with discrete mesoscale rotation or rotation embedded within larger organized systems. In the current study, the dynamic mechanism proposed herein can well explain why extreme hourly rainfalls are usually accompanied by meso-γ-scale rotational dynamics at the low level.
6. Summary and conclusions
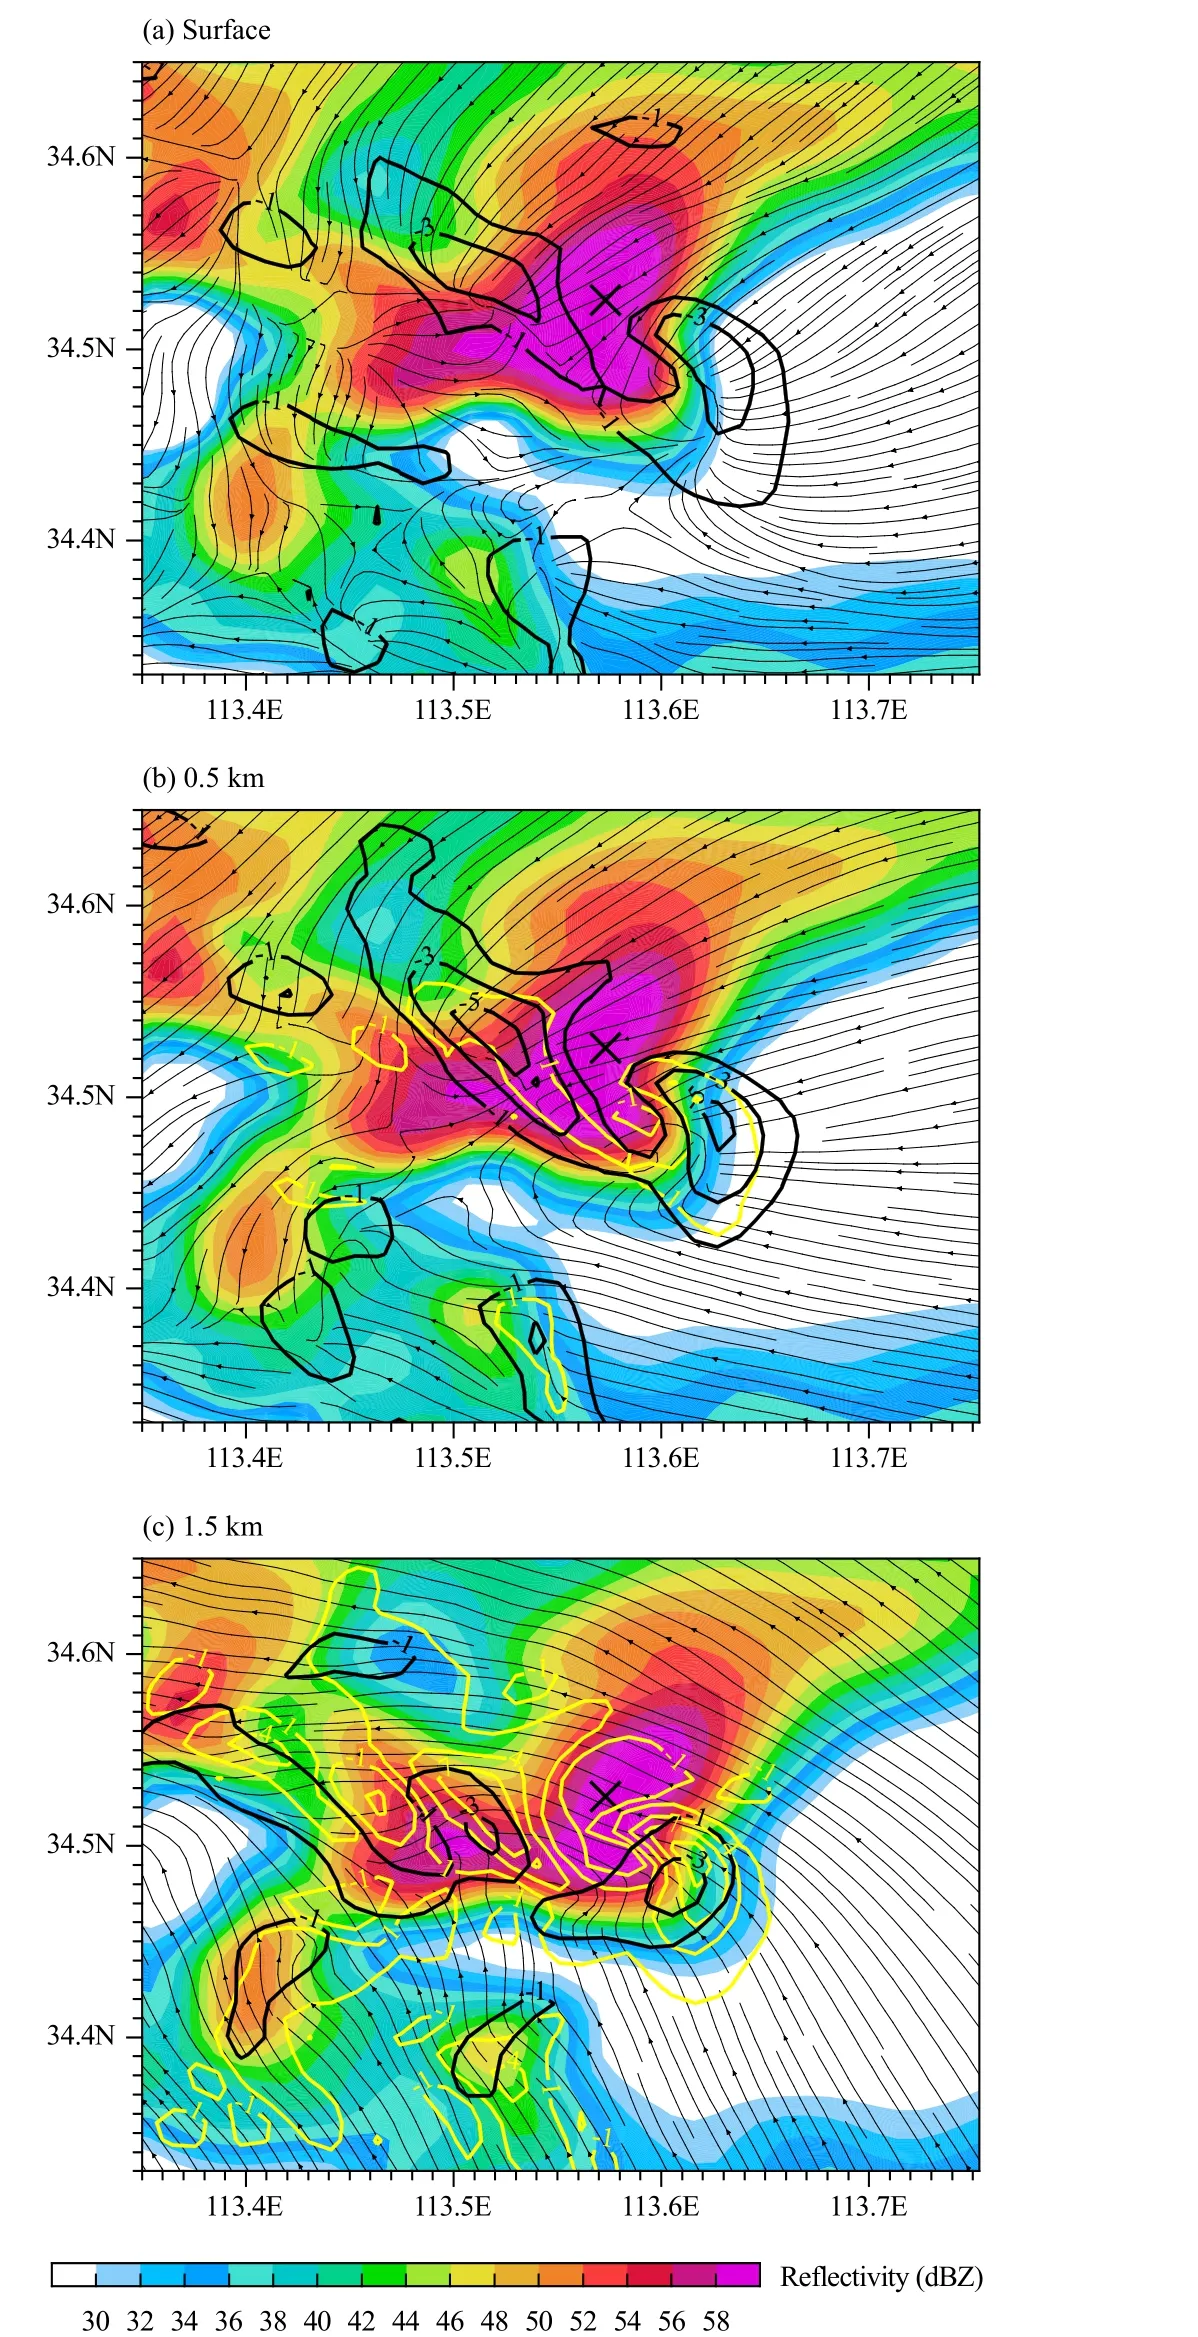
Fig. 14. Simulated radar reflectivity (dBZ; shaded), convergence(black contours at 10−3 s−1 intervals), wind streamline (thin black lines with arrows), and vertical motion (yellow contours at 3 m s−1 intervals,starting at −1 and 1 m s−1) associated with the meso-γ-scale convective system taken at (a) the surface, and (b) 0.5- and (c) 1.5-km altitudes.
In this study, we have investigated the convective initiation and subsequent extreme rainfall production over Zhengzhou City during 19–20 July 2021, based on a high resolution simulation with the WRF model. The results show that the model reproduces convective initiation on the east to north edge of the Songshan Mountain in the southwest of Zhengzhou, where obvious lifting happens due to the warm moist south-to-southeasterly flows and the blocking of the Songshan Mountain. Moreover, both the model simulation and observations show a meso-βscale storm with pronounced trailing stratiform rainfall.Of particular significance is that the model reproduces the heavy and extreme rainfall episodes. More specifically, the model reproduces the total accumulated rainfall amount of 704 mm with the maximum hourly rate of 233 mm h−1over Zhengzhou, which are close to the corresponding observed accumulated rainfall amount of 818 mm and the maximum hourly rate of 201.9 mm h−1. Of further significance is that the model reproduces an observed quasi-stationary intense meso-γ-scale convective system of 10–15 km in diameter, and there appears an arc-shaped distribution of updrafts surrounding the convective system. We propose that the convective updrafts in a three-quarter circle around the meso-γ-scale convective system are deployed in such a way that all the associated rainfall are concentrated within the same trailing region, which is responsible for the generation of extreme rainfall in Zhengzhou. Further analysis indicates that the arc-shaped updraft structure results from the arc-shaped convergence zone in the planetary boundary layer.
Figure 15 summarizes the synoptic-scale forcing and possible dynamic mechanism for the meso-γ-scale convective system and the extreme hourly rainfall production. Of particular relevance to the present extreme rainfall event is the coexistence of several remarkable synoptic and mesoscale systems interacting with local topography, which include a weak Huang–Huai cyclone, an exceptionally northward WPSH over Northeast Asia, a deep Tibetan high, and Typhoon In-Fa over the East China Sea and Typhoon Cempaka over the South China Sea. It is worth emphasizing that the quasi-stationary Huang–Huai cyclone provides an ideal synoptic-scale forcing with stable and abundant warm moist water vapor supply for the heavy rainfall, which has facilitated the sustained development of the rain storm at almost the same fixed location (Fig. 15a).
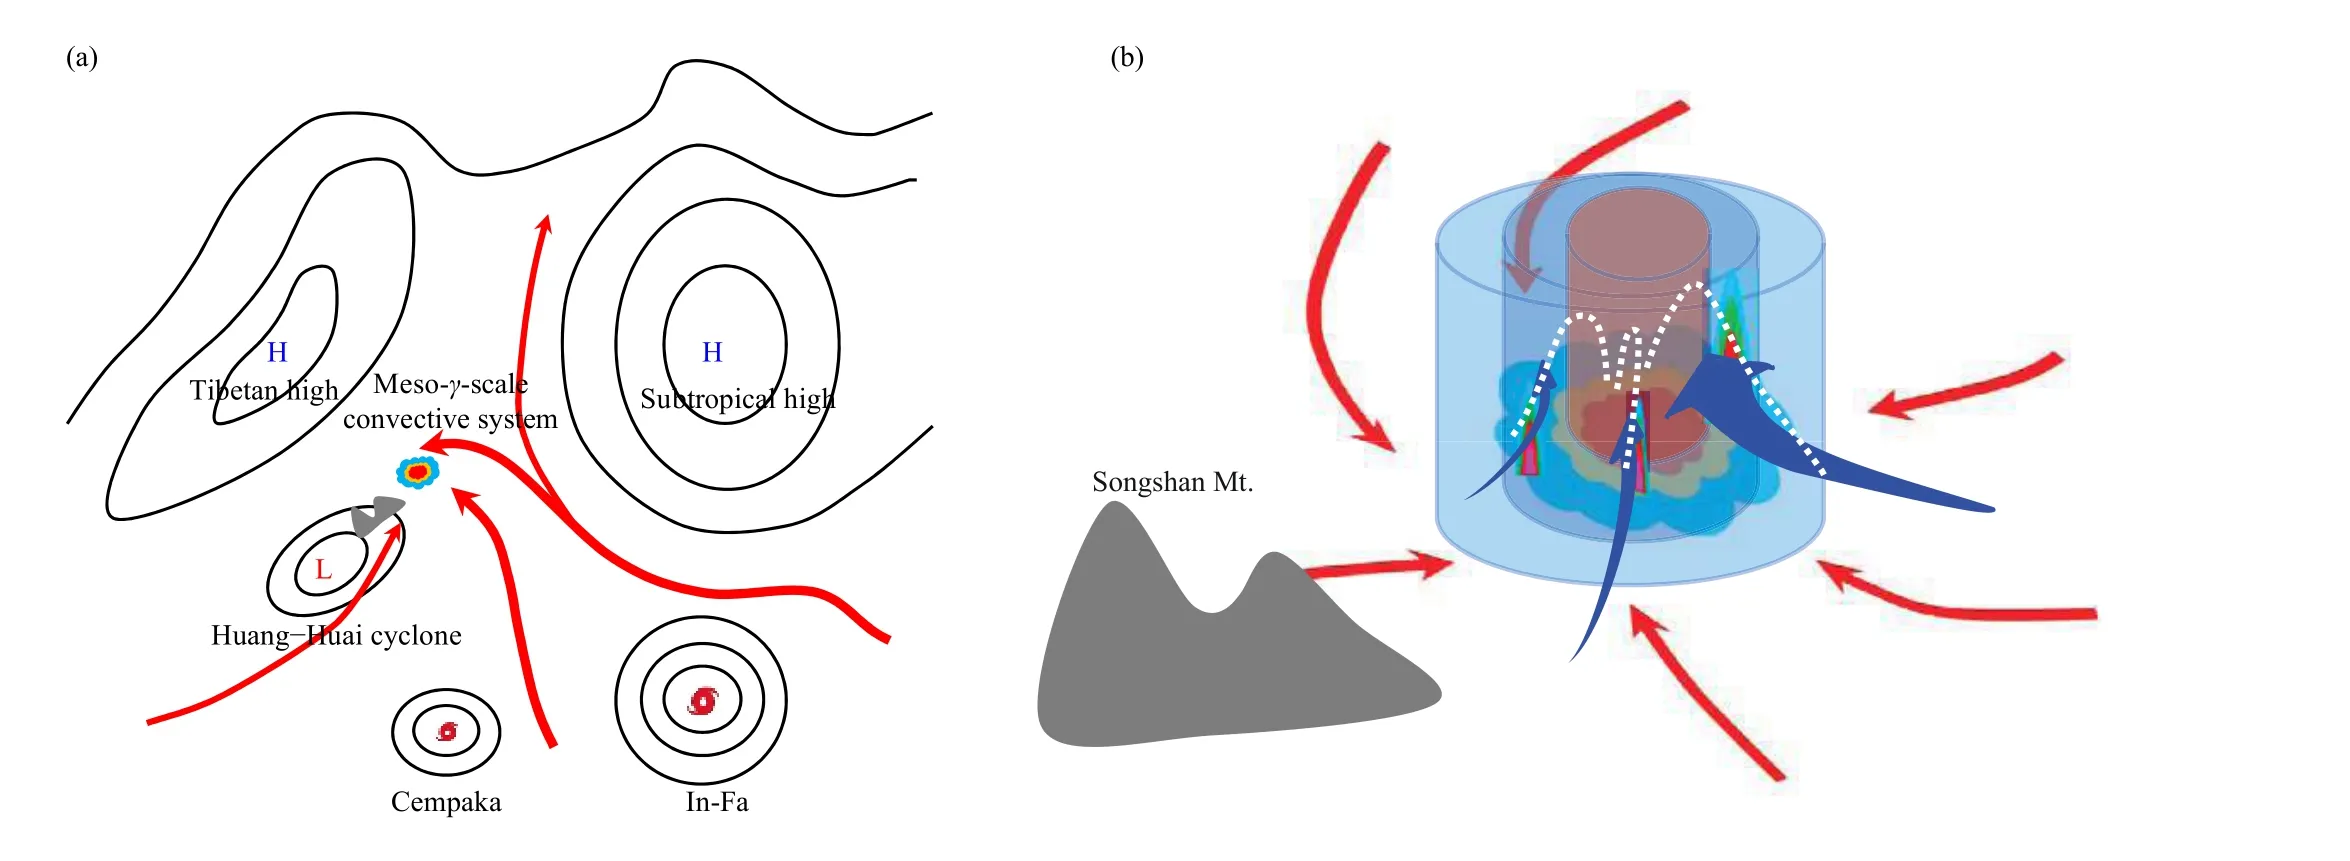
Fig. 15. Three-dimensional diagram of the mechanism for generation of the extreme rainfall associated with the meso-γ-scale convective system. (a) Co-existence of several distinct synoptic and mesoscale systems, including an abnormally northward western Pacific subtropical high, a strong Tibetan high, a Huang–Huai cyclone, Typhoon In-Fa, and Typhoon Cempaka. Thick red arrows denote horizontal wind flows in the planetary boundary layer. Colored clouds indicate the extreme-rainfall producing meso-γ-scale convective system, and the gray shadings imply the Songshan Mountain. (b) A zoomed-in view of the meso-γ-scale convective system with special emphasis on the arc-shaped updrafts. The shadings in light blue stand for the meso-γ-scale convective system and the thick red arrows denote horizontal wind flows surrounding it in the planetary boundary layer. Thick blue arrows represent the arc-shaped updrafts, and the white-dashed lines imply the precipitation being transported and falling into the same trailing region.
Under the favorable synoptic-scale weather conditions, orographic lifting of the Songshan Mountain triggered convection, and an intense quasi-stationary and well-organized meso-γ-scale convective system is formed(Fig. 15b). Of importance is that an arc-shaped convergence zone around the meso-γ-scale convective system exists in the planetary boundary layer (Fig. 14), which drives corresponding strong updrafts with similar arcshaped patterns. The updrafts feed the convective cells in the boundary layer of the quasi-stationary meso-γ-scale convective system, and precipitation produced by those deep convective cells is transported from multiple directions and falls into the same trailing region (Figs. 13,15b). The overlay of the precipitation from those deep convection cells around the meso-γ-scale convective cell has produced the extreme hourly rainfall over Zhengzhou during the 1-h period of 1500–1600 BST 20 July 2021. It should be stressed again that the meso-γ-scale convective system is an integrated and coordinated selforganization, and the extreme rainfall occurs within this same convective system. All these interlinking processes explain the record-breaking hourly rainfall and the extremely large amount of accumulated rainfall. Dynamic features similar to the present work can also be found in previous studies (e.g., Nielsen and Schumacher, 2020b;Yin et al., 2020), in which a well-organized meso-γ-scale vortex was obvious in the planetary boundary layer during extreme rainfall. These results demonstrate the significant role of the dynamic structure of the mesoscale system that affects the precipitation area and occurrence of such a high rainfall rate.
Although a reasonable dynamic mechanism for the extreme hourly rainfall has been proposed, there are still questions that need further investigation. Among those,we would like to mention three key ones: (i) what are the main cloud microphysical processes leading to such a high hourly rainfall rate of 233 mm h−1; (ii) why does the strong convective storm have no obvious well-organized cool pool near the surface during the strong rainfall episode; and (iii) can a higher horizontal resolution further improve prediction of such a small-scale precipitation system? Most importantly, more work is needed to understand in-depth the associated cloud and precipitation processes. In a forthcoming study, diagnostic and budget analyses will be launched to investigate how the cloud microphysical processes facilitate the generation of the simulated extreme rainfall hourly rate of 233 mm h−1over Zhengzhou, by examining all sources and sink terms of the microphysical processes. Nevertheless, the present results have important implications for understanding dynamic organization of severe convection and subsequent unprecedented heavy rainfall.
Acknowledgments. The authors are thankful to the Editor and three anonymous reviewers for their help improving the manuscript.
杂志排行

Journal of Meteorological Research的其它文章
- Diagnosing the Dynamic and Thermodynamic Effects for the Exceptional 2020 Summer Rainy Season in the Yangtze River Valley
- Estimation of Chlorophyll-a Concentration in Lake Taihu from Gaofen-1 Wide-Fieldof-View Data through a Machine Learning Trained Algorithm
- A Case Study on the Rapid Rain-to-Snow Transition in Late Spring 2018 over Northern China: Effects of Return Flows and Topography
- Southwesterly Water Vapor Transport Induced by Tropical Cyclones over the Bay of Bengal during the South Asian Monsoon Transition Period
- Energetics of Boreal Wintertime Blocking Highs around the Ural Mountains
- Potential Impact of Tonga Volcano Eruption on Global Mean Surface Air Temperature