Axial uniformity diagnosis of coaxial surface wave linear plasma by optical emission spectroscopy
2022-03-10WenjinZHANG张文瑾XinyuWEI卫新宇LongweiCHEN陈龙威QifuLIN林启富YimanJIANG江贻满ChengzhouLIU刘成周andJiafangSHAN单家芳
Wenjin ZHANG(张文瑾),Xinyu WEI(卫新宇),Longwei CHEN(陈龙威),Qifu LIN(林启富),Yiman JIANG(江贻满),Chengzhou LIU(刘成周), and Jiafang SHAN(单家芳)
1 Institute of Plasma Physics,Hefei Institutes of Physical Science,Chinese Academy of Sciences,Hefei 230031,People’s Republic of China
2 University of Science and Technology of China,Hefei 230026,People’s Republic of China
3 Institute of Energy,Hefei Comprehensive National Science Center,Hefei 230031,People’s Republic of China
Abstract The coaxial surface wave linear plasma with preeminent axial uniformity is developed with the 2.45 GHz microwave generator.By optical emission spectroscopy,parameters of the argon linear plasma with a length over 600 mm are diagnosed under gas pressure of 30 and 50 Pa and different microwave powers.The spectral lines of argon and Hβ(486.1 nm)atoms in excited state are observed for estimating electron excitation temperature and electron density.Spectrum bands in 305-310 nm of diatomic OH(A 2Σ+ - X2Π i)radicals are used to determine the molecule rotational temperature.Finally,the axial uniformity of electron density and electron excitation temperature are analyzed emphatically under various conditions.The results prove the distinct optimization of compensation from dual powers input,which can narrow the uniform coefficient of electron density and electron excitation temperature by around 40% and 22% respectively.With the microwave power increasing,the axial uniformity of both electron density and electron excitation temperature performs better.Nevertheless,the fluctuation of electron density along the axial direction appeared with higher gas pressure.The axial uniformity of coaxial surface wave linear plasma could be controlled by pressure and power for a better utilization in material processing.
Keywords:surface wave plasma,low temperature plasma,optical emission diagnosis
1.Introduction
Low temperature plasma is a kind of mixture with electrons,ions and neutral particles,generated by suppling enough energy from constant electric field(DC),alternating electric field(AC),radio frequency(RF)or microwave power(MW)[1].The non-equilibrium nature of the huge difference in electron temperature and gas temperature,leads to utilization with low temperature plasma in area of coating[2],etching[3],medicine[4]and gas conversion[5],etc.Recently,microwave discharge plasma is considered as an outstanding plasma source for application and fundamental research with unique characters of electrodeless discharge,flexible controlling,wide range of operating pressure and discharge volume.Many types of microwave discharge devices are designed for scientific and industrial research which can be classified with working pressure,frequency and microwave coupling methods[6].
The surface wave plasma is sustained by means of electromagnetic wave propagating along the interface between plasmadielectric media[7-11],in case the electron density is higher than the critical value which depends on the frequency of electromagnetic field(7.46×10¹⁶m-3for 2.45 GHz).The traditional surface wave discharge based on the quartz tube and waveguide,generates plasma inside the tube for gas conversion,plasma chemistry and modeling research,such as ‘Surfatron’ and ‘Surfaguide’[12-14].In order to meet the industrial requirements,the surface wave linear plasma called‘Duo-plasmaline’[15,16]has been designed with plasma extending linearly uniform,which has great potential to achieve large area plasma source by parallel arrangement.The basic principle of surface wave linear plasma is supplying microwave power simultaneously from two ends of coaxial waveguide which consists of a copper rod and a quartz tube in the vacuum chamber.Microwave power penetrates into the vacuum chamber through the quartz tube to excite working gas under low pressure,generating linear plasma along the surface of quartz tube.Plasma with density higher than the critical number plays a role of outer conductor,meanwhile the copper rod comes as an inner conductor,which leads the electromagnetic wave propagating between the interface of plasma and quartz tuberealizing surface wave discharge.The mechanism of supplying dual microwave powers and the structure of coaxial waveguide decrease the attenuation of electromagnetic wave,achieving to a high degree of axial homogeneity and stability.At present,the application experiments and numerical simulation works on the surface wave linear plasma have made great progresses.In 1997s,Petaschet al[16]first developed the linearly extended plasma source excited by the dual 2.45 GHz microwave powers at a pressure of 10 mbar.The Langmuir probe was used to measure the electron density and temperature to find the excellent axial homogeneity.Then,numerous application research on material deposition and treatment through this kind of plasma source was produced.In the work of Takatoshi Yamadaet al[17],a 2D roll-to-roll microwave plasma CVD device by several linear surface wave plasma sources for fabrication of large area graphene films was developed,realizing the controlling of film qualities by adjusting gas mixture ratio and pressure.Kromkaet al[18]achieved the growth of the diamond thin films over large area(up to 20×10 cm2)by linear antenna microwave plasma CVD process from a CH4/H2gas mixture under pressure of 0.1 mbar and 2 mbar.Liehret al[19]used two tapered metal shields located inside the two ends of quartz tube to improve the uniformity of coaxial line plasma source,and then a variety of thin films were deposited.Apart from experiments,numerical simulation is recognized as a good approach dedicated to find inner physical process of plasma source.Jicheng Zhouet al[20]built a numerical model of linear plasma with length of 1550 mm based on COMSOL software,coupling different physical field to analyze the effect of the microwave power,gas pressure and magnetic flux density.Rahimiet al[21]presented a two-dimensional(2D)plasma model through Plasimo platform based on the plasma fluid theory with the pressure in the range of 2-8 mbar.After comparing with experimental results,the good agreement on electron density and temperature was found.
In this work,the coaxial surface wave linear plasma source ignited by 2.45 GHz microwave powers with length over 600 mm under low pressure is developed,which is an extending for previous numerical simulation research[22-24].Argon plasma parameters under different discharge conditions are measured by optical emission spectroscopy,which is confirmed as a credible plasma diagnostic technology by many researchers[25-28].In section 2,the experimental device and measurement system are presented.The spectral data are collected along axial direction steady and successfully with the help of slide block and track.In section 3,the analyses of electron excitation temperature,molecule rotational temperature and electron density based on spectrum are described,including the results of axial uniformity analysis.Finally,a brief summary is given in section 4.Such results may provide a better understanding of experimental phenomena in the surface wave linear plasma,and help for figuring out the parameters of our device.
2.Discharge and measurements
2.1.Experimental setup
The schematic diagram of experimental device is shown in figure 1(a).The reaction chamber has the upper discharge region and the lower diffusion region where a substrate table for material treatment is sited.Working gas is input through two tubes with apertures sited inside the top of chamber and the vacuum system connected from the bottom.One vacuum gauge is installed with the diffusion region of chamber to record the pressure.The dominant coaxial waveguide could be considered as two parts:(1)the first part is located inside the discharge chamber,consisting of a copper rod(Φ=8 mm)and a quartz tube(Φ=26 mm)with length of 600 mm;(2)the second part is located outside of chamber in the two ends,connecting with designed specific microwave converter(TE10to TEM),in which the quartz tube is replaced by copper tube(Φ=26 mm).The chamber is filled with argon gas under low pressure,and the gas inside the quartz tube is atmospheric air.Flowing air from the rubber tube on the plunger realizes cooling of copper rod.The electromagnetic waves from one microwave generator with frequency of 2.45 GHz are equally divided into two same microwave powers through the standard microwave power splitter connecting with the device by coaxial transport line.The standard microwave coaxial line converters of 2.45 GHz are used in our system for transition from rectangular waveguide of TE10mode to coaxial line of TEM mode.Between the microwave power splitter and microwave generator,the waveguide with three tuners is adopted to adjust the wave reflection.In order to collect the optical signals emitted from plasma,the observing window of quartz plate is designed in the axial direction of discharge chamber with length of 550 mm and width of 50 mm.The position of observing window is pointed directly at quartz tube and the copper grid is introduced between the chamber and quartz plate to avoid microwave leaking.
The basic process of plasma discharge in the experimental device is as follows:electromagnetic waves are generated from 2.45 GHz microwave generator system,and divided equally into two microwave powers input by the microwave power splitter;microwave powers are launched from two ends of coaxial waveguide simultaneously and emit into the chamber through quartz tube to excite working gas producing plasma along the surface of quartz tube.The highdensity plasma forms a self-consistent coaxial transmission line with the inner copper rod to keep electromagnetic wave propagating and plasma extending.In figure 2(b),the coaxial surface wave linear plasma device and discharge phenomena are shown,in which the linear plasma shape is observed obviously.
2.2.Measurement system(OES)
The crucial components of optical measurement system are lifting platform,axial sliding track,sliding block and optical emission spectrometer,as shown in figure 2.The experimental diagnosis picture is placed in the right corner.The optical detector is fixed on the sliding block cooperating with the sliding track to realize smoothly moving in the axial direction.The position of detector could be adjusted by the lifting platform where the optical plate and sliding track are mounted.The distance between detector and quartz observe window is smaller than 5 mm which can be adjusted.The detector is connected with spectrometer by the optical fiber,delivering spectrum data to the computer in time.The spectrometer used is the Multi-Channel Spectrometers(200-1000 nm)from AvaSpec Starline family including eight channels with observed wavelength step of 100 nm for each one.The resolution of each channel is averaged to 0.09 nm which is enough to record the lines information for analysis in our work.
For investigating the axial uniformity of the plasma,in every discharge,ten positions marked from a to j are chosen to measure along the axial direction.The detector moves from right side of the observing window using the sliding block and stops around 5 s in every position for the spectrum recording.The schematic graph of measurement positions can be found in the figure 3.
Because of the surface wave discharge mechanism,strong stand wave mode[29]appears when the pressure over 50 Pa in our device.Giving the consideration to film deposition in the future,the measurement experiments in this paper are chosen with lower pressure to carry out for analysis of uniformity and plasma situation.The microwave in all experiments is continuous wave mode instead of pulse.The experiments with single microwave power input from right side are also performed in comparable.The operational parameters are presented in the table 1 as bellow.

Table 1.Operational parameters of discharge experiments.
3.Results and discussion
Collecting suitable spectrum line to deliver the information we are looking for is significant in diagnosis of optical emission spectroscopy.Figure 4 shows the full spectrum from 250 to 900 nm under four typical experimental conditions,in which the spectral lines we want are observed.This full spectrum is the concatenation of seven segments from channel 1 to 7(200-900 nm)with the same exposure time.First of all,the lines information of Ar atoms with high quality and resolution is shown.Then,the spectra of OHand Hβcome from water or hydrogen in the small concentration of air in the chamber,which can be used for molecule rotational temperature and electron density determined,respectively.In order to collect them clearly,some atomic lines of Ar with wavelength over 650 nm are saturated.By the way,the slight signal of N2spectrum band between 350 and 450 nm is also observed which is often used to investigate the molecule rotational and vibrational temperature in the plasma system.However,the analysis of N2spectrum including N2(C-B)and N2+(B-X)is more complex and dependent significantly on pressure.The argon lines at high energy level in the range of 600-700 nm almost disappear under the single power input,which may imply the lower energy absorbing comparing with dual powers discharge.
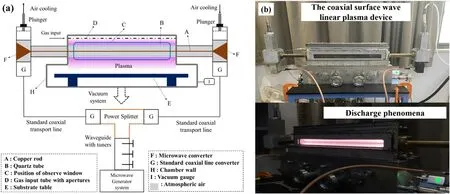
Figure 1.Schematic diagram of experimental device(a)and discharge phenomena picture(b).

Figure 2.Schematic diagram of diagnostic system.

Figure 3.Sketch map of positions in the measurements.
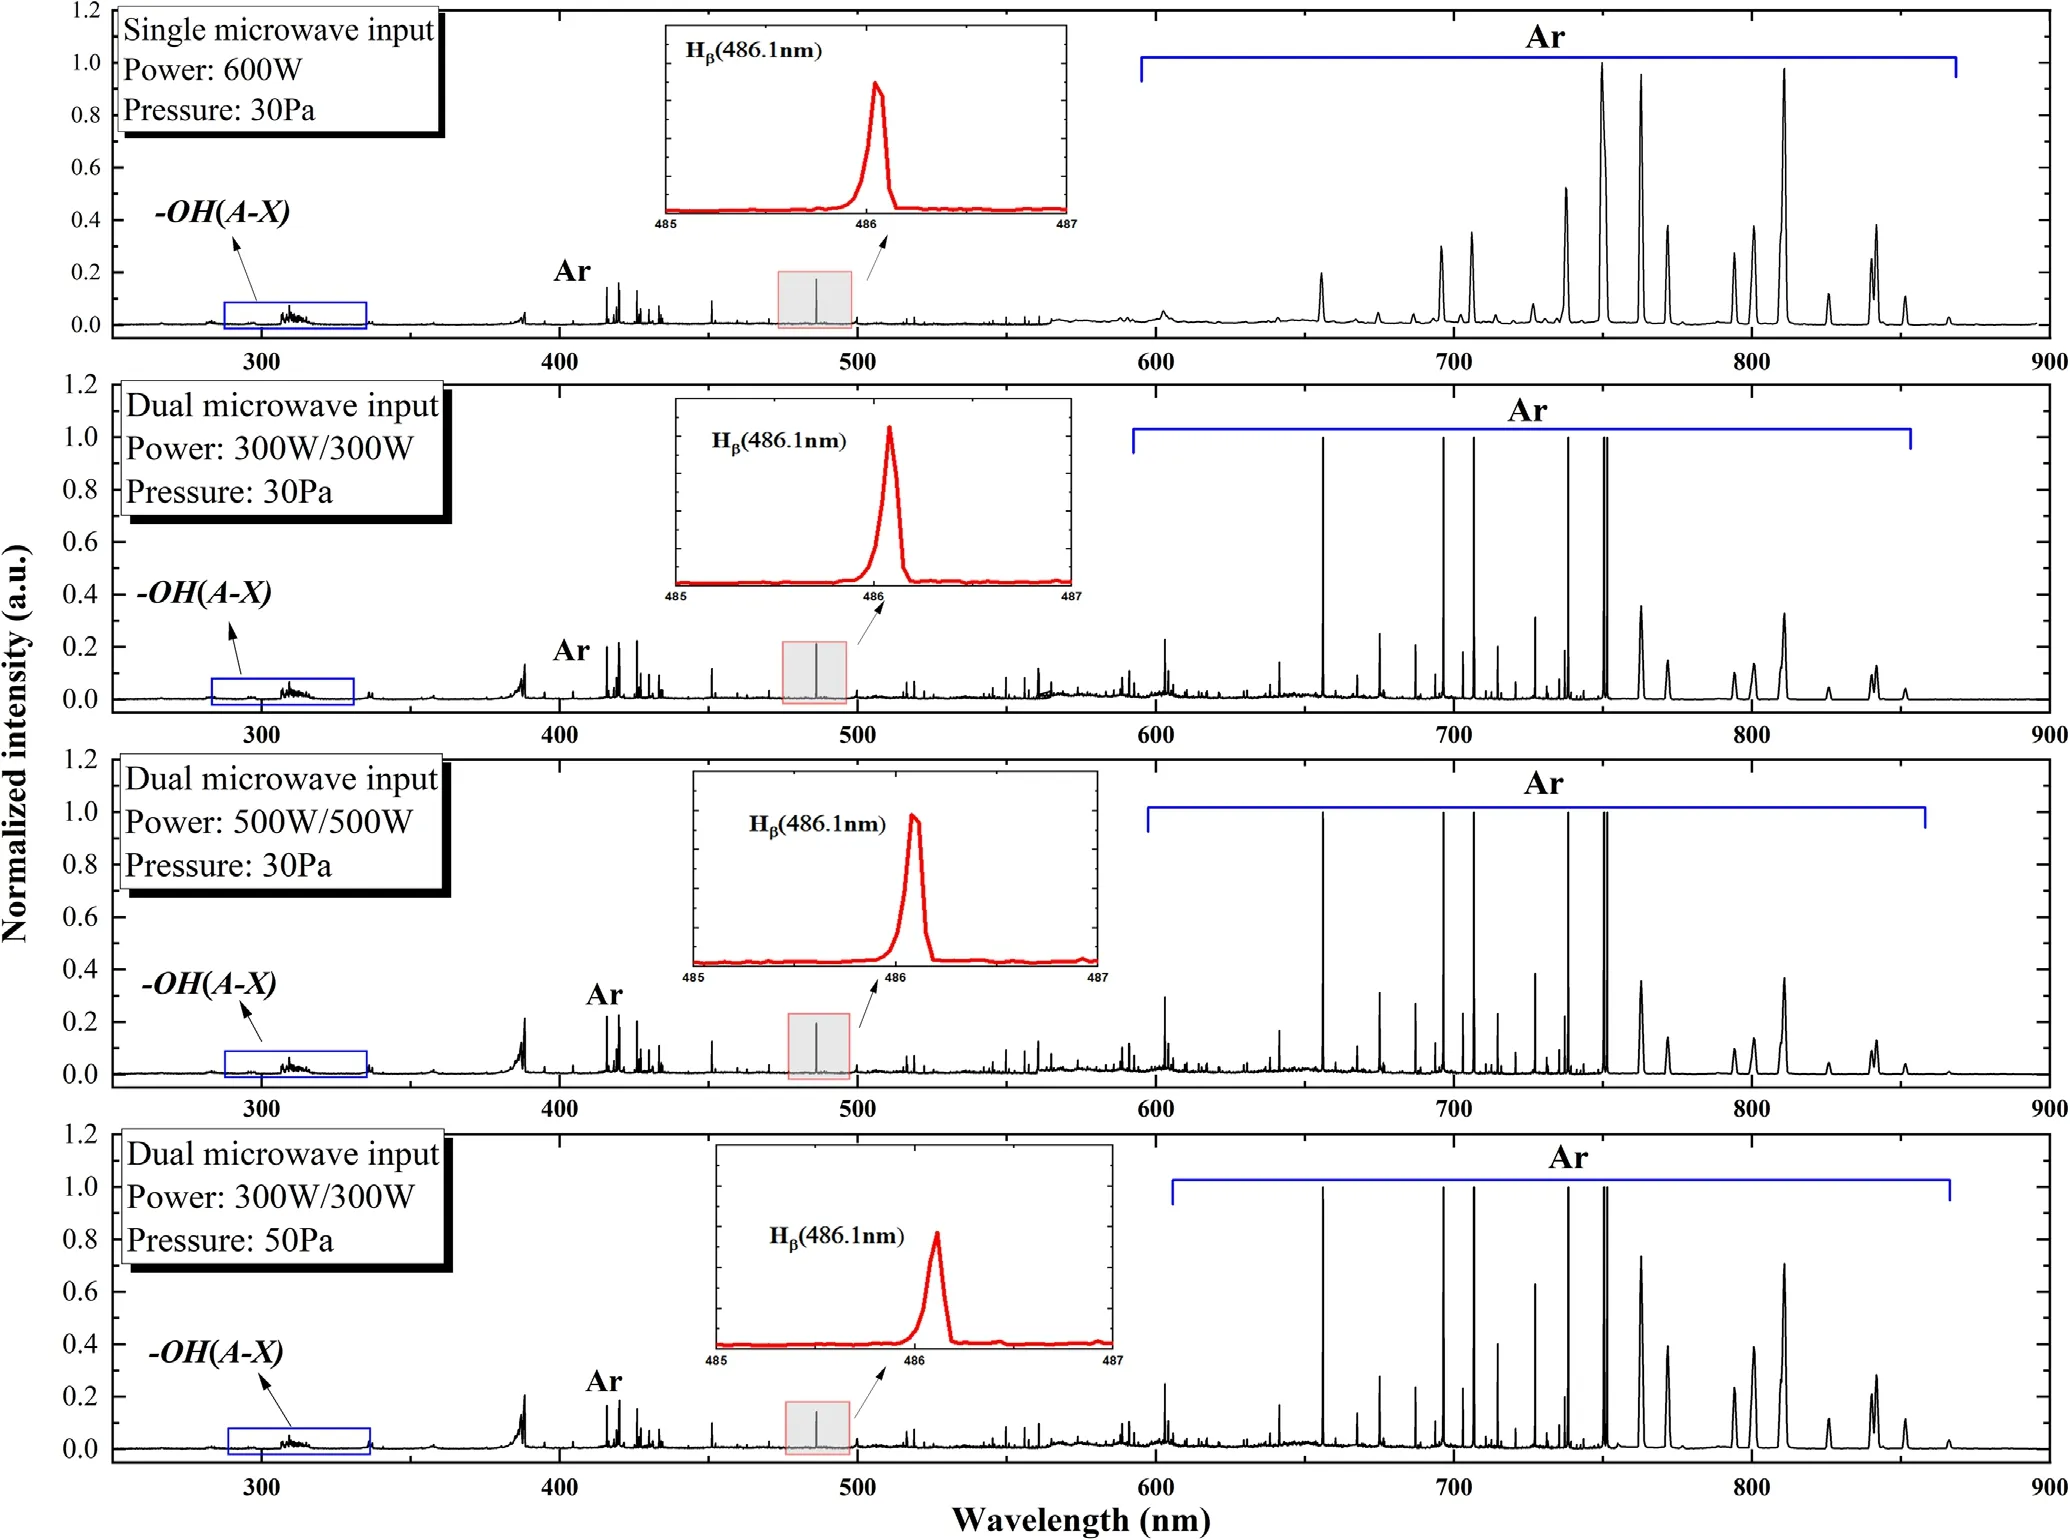
Figure 4.Spectra in the range of 250-900 nm under four conditions.

Figure 5.Boltzmann plots for the selected argon series lines at position a with(a)single microwave power input of 600 W and(b)dual microwave powers input of 300 W/300 W under 30 Pa.
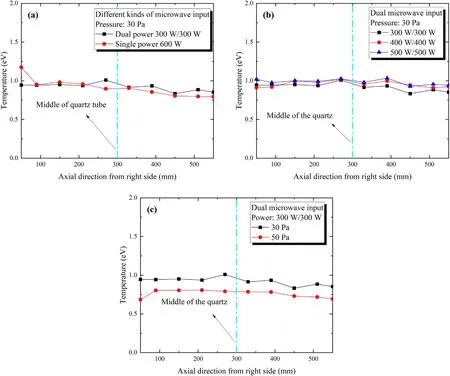
Figure 6.Axial distribution of electron excitation temperature with(a)single or dual microwave powers input,(b)different microwave power and(c)different gas pressure.
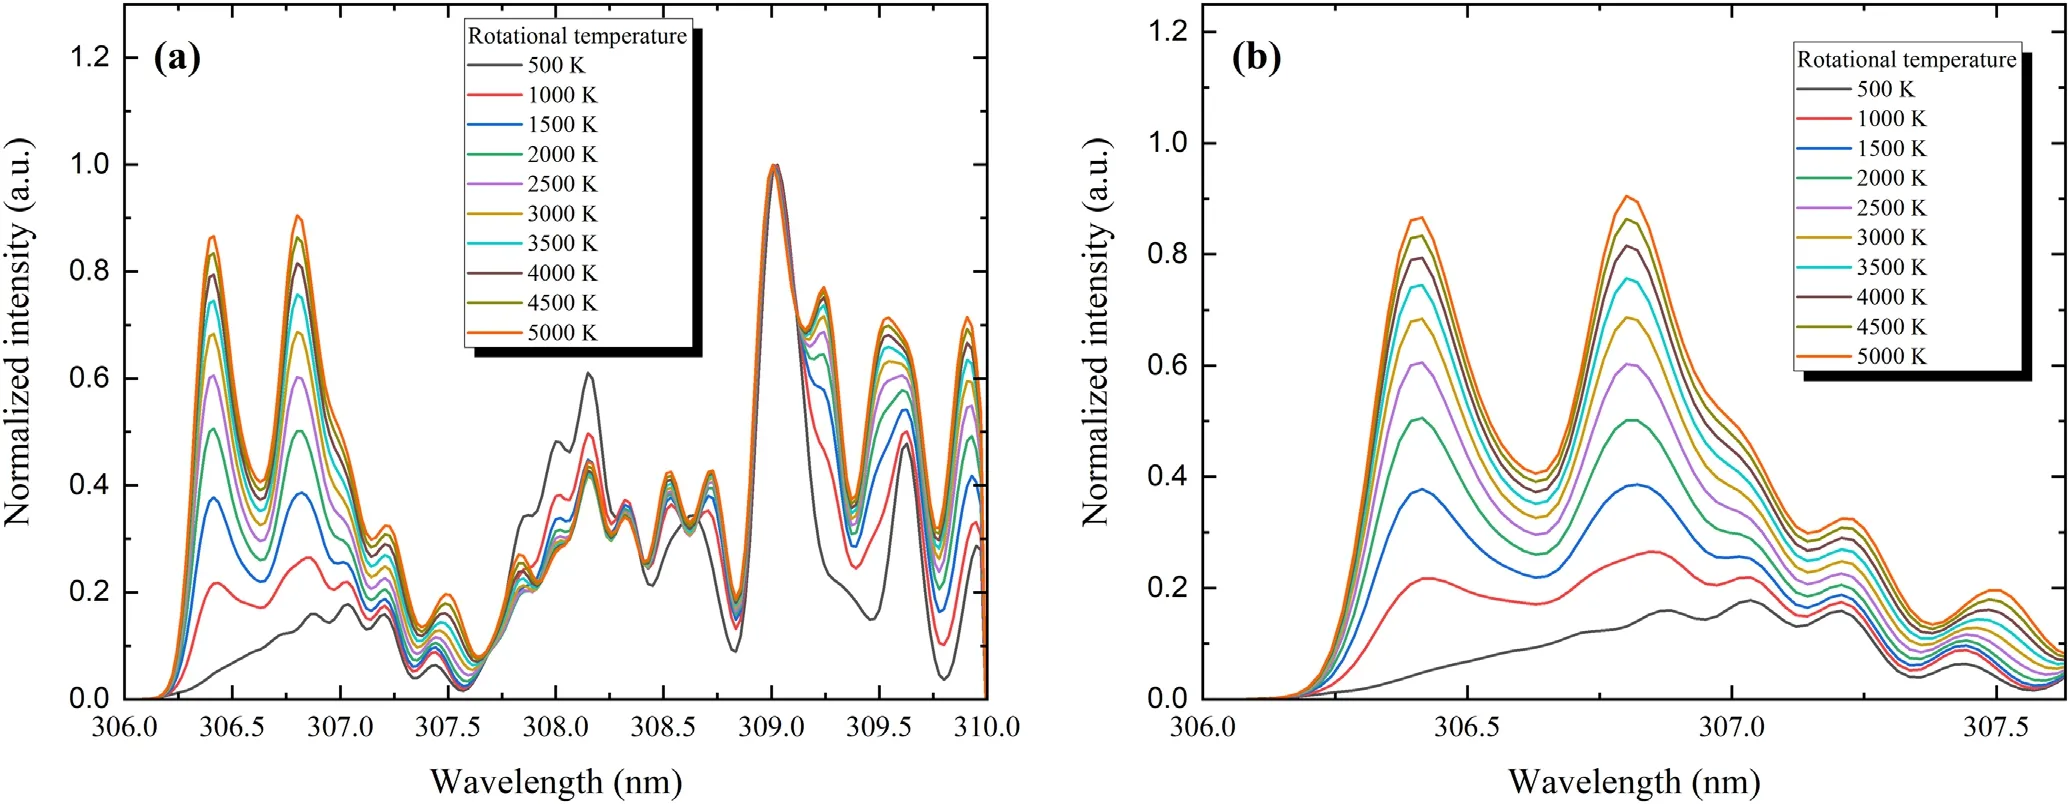
Figure 7.(a)Standard spectrum of OH(A2Σ+ - X2 Πi)band in the temperature range of 500-5000 K and(b)the enlarged graph in the wavelength of 306-307 nm.
3.1.Electron excitation temperature(Texc)
In the steady plasma discharge,the populations of particles in the upper and lower excited state obey the Boltzmann distribution in most cases.The electron excitation temperature is associated with electron energy and velocity,which can be obtained using Boltzmann plot method popularly[30,31]without a standard source for calibration.The basic point of Boltzmann plot method is the intensity of different emission lines from different excited states of same atom(argon atom in this work)and the equation(1)is the expression for using[27,32].
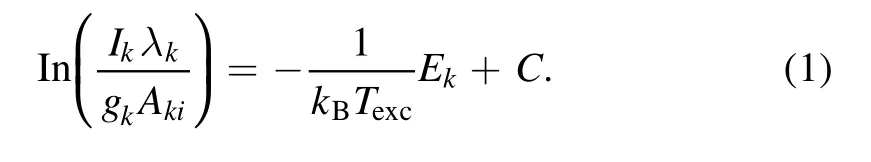
Here,Ikis the intensity of line chosen,λkis wavelength of it in nm,gkis the statistical weight of the upper excited state,Akiis the transition probability,Ekis the excitation energy,kBis the Boltzmann constantandCis a constant for all lines used.Plotting and linear fitting in the coordinatesafterwards,the electron excitation temperature can be obtained from the value of slope.In order to increase the accuracy,different energy areas should be covered.The information on the spectral lines of argon atom we selected in consideration of the sufficient resolution,clarity and intensity is presented in table 2,which are taken from the atomic database of NIST[33].
The typical Boltzmann plots are illustrated in the figures 5(a)and(b)under different types of microwave power input,and the spectrum data are both collected under pressure of 30 Pa at the position a.The linear fitting is fine enough with the correlation coefficient(r2)achieving to 0.95,which is reliable to obtain the electron excitation temperature under different experiments.The distributions of electron excitation temperature as a function of microwave power and pressure are shown in figures 6(a)-(c).Thexaxis starting from 50 mm represents for the distance from the right end position of the discharge chamber,which is described clearly in figure 3.
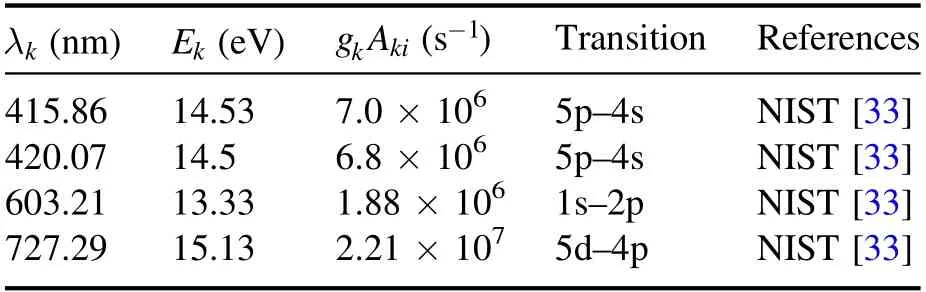
Table 2.Spectroscopic data of argon atoms series.
In figure 6(a),comparing with the results from dual microwave powers input,the excitation temperature decreased slight along the axial direction with only single microwave power launched.The feature of axial extending linear is found in the figures 6(b)and(c).The excitation temperature has improved a little with microwave power rising,because more energy is imported.Mostly,the effects on electron excitation temperature are collision frequency of electrons-neutral particles and energy absorbed per electron,which are associated with gas pressure[34].Besides,the results of electron excitation temperature obtained from optical emission spectrum are averaged value,which may be declined when the input energy is shared by large number of particles.Due to the reasons mentioned above,the electron excitation temperature will be decreased with increasing gas pressure which is presented in figure 6(c).However,according to the results in figure 6,the influence coming from microwave power and pressure is very slight on electron excitation temperature,and all of them are almost around 1.0±0.1 eV keeping consistency with the works from Hübneret alin[35].In the chapter 9 of the reference,a linear coaxial microwave is operated with argon plasma around 1 mbar and measured by Langmuir probe.The electron temperature is always about 0.8-1.5 eV with the pressure from 0.25 to 2 mbar.
3.2.OH(A2Σ+-X2Πi) rotational temperature
In most cases of the non-equilibrium plasmas,the lifetime of ground state is significantly longer than the characteristic time for collisions,which lead the rotational temperature of the ground state as usually a good representation of the gas temperature with enough time to achieve the rotational distribution thermalized[36].Due to the gas pressure in this work,the low-pressure limits collisions to occur during the lifetime of ground state whereby the electron excitation is the dominant excitation mechanism.In that case,the rotational distribution of the excite states is a mapping of the ground state,because the electron collision from the ground state is without change of rotational quantum numbers[37,38].Therefore,using rotational spectra of diatomic molecules(mostly diatomic)under excited states as a probe for gas temperature has made great success for many years,such as OH,NO[39]and N2[40].Herein,we especially note[36],in which the gas temperature from rotational lines was reviewed clearly,and the work from Gans[41]under the similar gas pressure range also proved that the method above could be adopted in this work.
The diatomic OH(A2Σ+- X2Πi)emission from 306 to 310 nm is ubiquitous because of the strong transition and the presence of water vapor in plasma reactor chamber.The information of OH(A2Σ+- X2Πi)spectroscopy is included in the Lifbase[42]database which is a software program to compare standard spectrum with experimental results for estimating the rotational temperature.In order to improve the accuracy of fitting,the sensitivity of OH spectrum is analyzed in figure 7.The OH spectrum could be decomposed into three zones[43]:the head band(λ∈[306 -307.5 nm]),the central part(λ∈[307.6 -308.8 nm])and the tail part(λ∈[308.8 -310 nm]).As the temperature increases by the step of 500 K,the head band intensity increases significantly,as shown in the enlarged graph figure 7(b).In that part,the temperature could be distinguished obviously even in the range of 100 K,which is sensitive to evaluate the degree of fitting.
Figure 8 presents a comparison of the experimental emission data(the black circle dots)with the simulated profile(red line),which shows good agreement,especially at the position of peak in the head band(306-307 nm)and the tail band in 309 nm.The experimental conditions are at pressure of 30 Pa with single microwave power input(figure 8(a))and dual microwave power input(figure 8(b)).Spectra in figure 8 are both obtained in the position iat the left side shown in figure 3.Therefore,the rotational temperature of OH radicals is lower with only single microwave power input from right side,corresponding to the weak intensity of head band in figure 8(a),comparing with dual microwave powers input case in figure 8(b).The values of temperature around 2000 K are found in our experiments,however the metal wall of outer plasma chamber is not much hotter than room temperature.That might be caused by the low thermal conductivity of the gas and large surface of chamber.

Figure 8.Comparison between simulated and experimental optical emission spectra of OH radicals.The experimental conditions are at the pressure of 30 Pa with(a)single microwave power of 600 W and(b)dual microwave powers of 300 W/300 W.

Figure 9.Axial distribution of rotational temperature with(a)single and dual microwave powers input,(b)different microwave powers and(c)different gas pressures.

Figure 10.Voigt fit of the Hβ line at the pressure of 30 Pa with(a)single microwave power of 600 W and(b)dual microwave powers of 300 W/300 W.
The distributions of OH rotational temperature under various experiments conditions are also analyzed in the figure 9.The trend of temperature appears generally axial downward from the single microwave power input side as shown in figure 9(a),and the axial uniformity of the rotational temperature is restored after launching two microwave powers simultaneously.From the figure 9(b),the gas is heated slightly by dozens of Kelvins with microwave power increasing,meanwhile the distribution shows more uniform under the higher microwave power.It is known that,the collision frequency between electrons and neutral particles increased by gas pressure will cause the promotion on temperature of ground state particles,like the microwave jet in atmospheric[31].However,in the results of figure 9(c),with the gas pressure rising,the rotational temperature seems to have no change in the axial direction with the consideration of error of measurement,that might be because electron excitation dominates mechanism in surface wave plasma under low pressure(~50 Pa)instead of collided excitation.The weak collision is also the crucial reason for surface wave linear plasma to keep uniform in the long distance.
3.3.Electron density
Electron density is a basic parameter to evaluate the situation of plasma source,whose distribution has significant effect on the quality and uniformity of the surface wave linear plasma in this work.Thus,the general fluctuation trend of plasma density is the focal point to pay attention to instead of exact value.
In our experiments,the profile of the Balmer line Hβ(486.1 nm)with broadening is observed in the spectra collected by optical emission spectrometer.The Stark broadening hydrogen Balmer series are typically applied for plasma diagnosis to determine the electron density,as Stark effect in the line shape is almost linear with the density of charged particles surrounding the emitter[44-46].The full-widths at half-maximum(FWHM)of Stark broadening of the Hβline can be used to calculate the electron density through expression as follows without considering either temperature or the perturbed masses[45]:

Actually,the experimental line shapes are the results of several plasma broadening mechanisms which are described in details in[47,48].Therefore,the Stark broadening profile has to be isolated and retrieved.The line profile of Hβline could be fitted with the Voigt function with a value of FWHM,which can be represented in the convolution of the Gaussian shape and Lorentzian shape[25]:
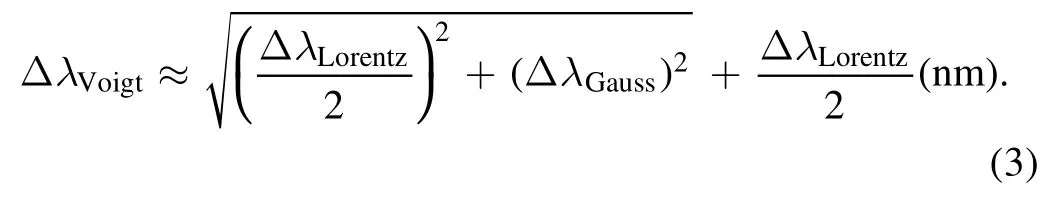
Here,the ΔλVoigt,ΔλGaussand ΔλLorentzare FWHM of Voigt shape,Gaussian shape and Lorentzian shape,respectively,and the broadening of Gaussian shape is contributed by the Doppler broadening and instruments broadening,and the relation can be expressed as:

wherein,the Doppler broadening(ΔλDoppler)is due to the thermal motion of the particles and related to the gas temperature of[25]:

λ0andMis the wavelength and relative atomic quality of emitter which is 486.1 nm and 1 of Hβin this work.Tgis the gas temperature.The instrumental broadening (ΔλInstrument)is already known for the spectrometer used in our experiments which is 0.1 nm.
Whereas the shape of Lorentzian profile is the sum of Stark broadening(ΔλStark),van der Waals broadening(Δλvanderwaals),resonance broadening(Δλresonance)and natural broadening(Δλnatural),which can be expressed as
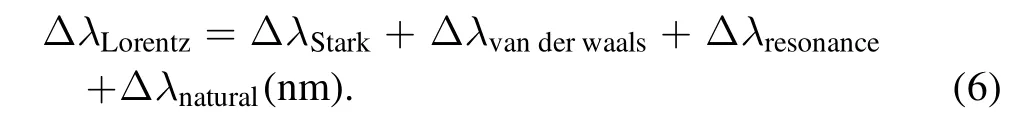
In our case,the concentration of hydrogen is much smaller than argon gas,so the resonance broadening(Δλresonance)and natural broadening(Δλnatural)can be ignored here.The van der Waals broadening(Δλvanderwaals)results from the interaction of excited atom with ground-state atom[48],which can be obtained from equation(6)as bellow:

The constant value depends on different lines and gas,which is 5.24 in our experiments.That coefficient is introduced from the table in[49],based on argon gas discharge and Hβline used to diagnose.
Therefore,in order to receive the Stark broadening(ΔλStark)for obtaining electron density through equation(2),the deconvolution of recorded Hβline could be carried out first by fitting the Voigt function using equation(3).Then,the value of Stark broadening(ΔλStark)can be isolated from the Lorentzian part using equations(6)and(7)described above.According to the low-pressure discharge,it can be considered that the excited state is solely caused by electron excitation with no collision.In that case,the following assumption can be made in our work[36]for gas temperature:(1)the ground state distribution obeys a Boltzmann function and the rotational temperature of diatomic molecule in excited state equals to gas temperature;(2)the dominant mechanism of OH radicals producing is electron impact with neutral particles,and the OH radical rotational temperature can be adopted as gas temperature(see details in section 3.2).
Figure 10 shows the recorded Hβline in position a fitted with Voigt function,and the experimental conditions are(a)single microwave power input and(b)dual microwave powers input at pressure of 30 Pa.The types of microwave power input seem to have no obvious influence on the broadening recorded in the position near microwave power source.Because of the lower pressure,the broadening of line profile is not very large but enough to obtain the electron density and analysis the axial distribution in the range of error.The profiles also appear to have slight asymmetric and shift,which might be caused by the strong difference in the motion of electron and ions under the low pressure[50,51].However,the Voigt fitting in our process is nice enough with the coefficient of determination(R2)achieving into 0.98.Using the methods demonstrated before,the distributions of electron density along the axial direction under different experiment conditions are displayed in figure 11.
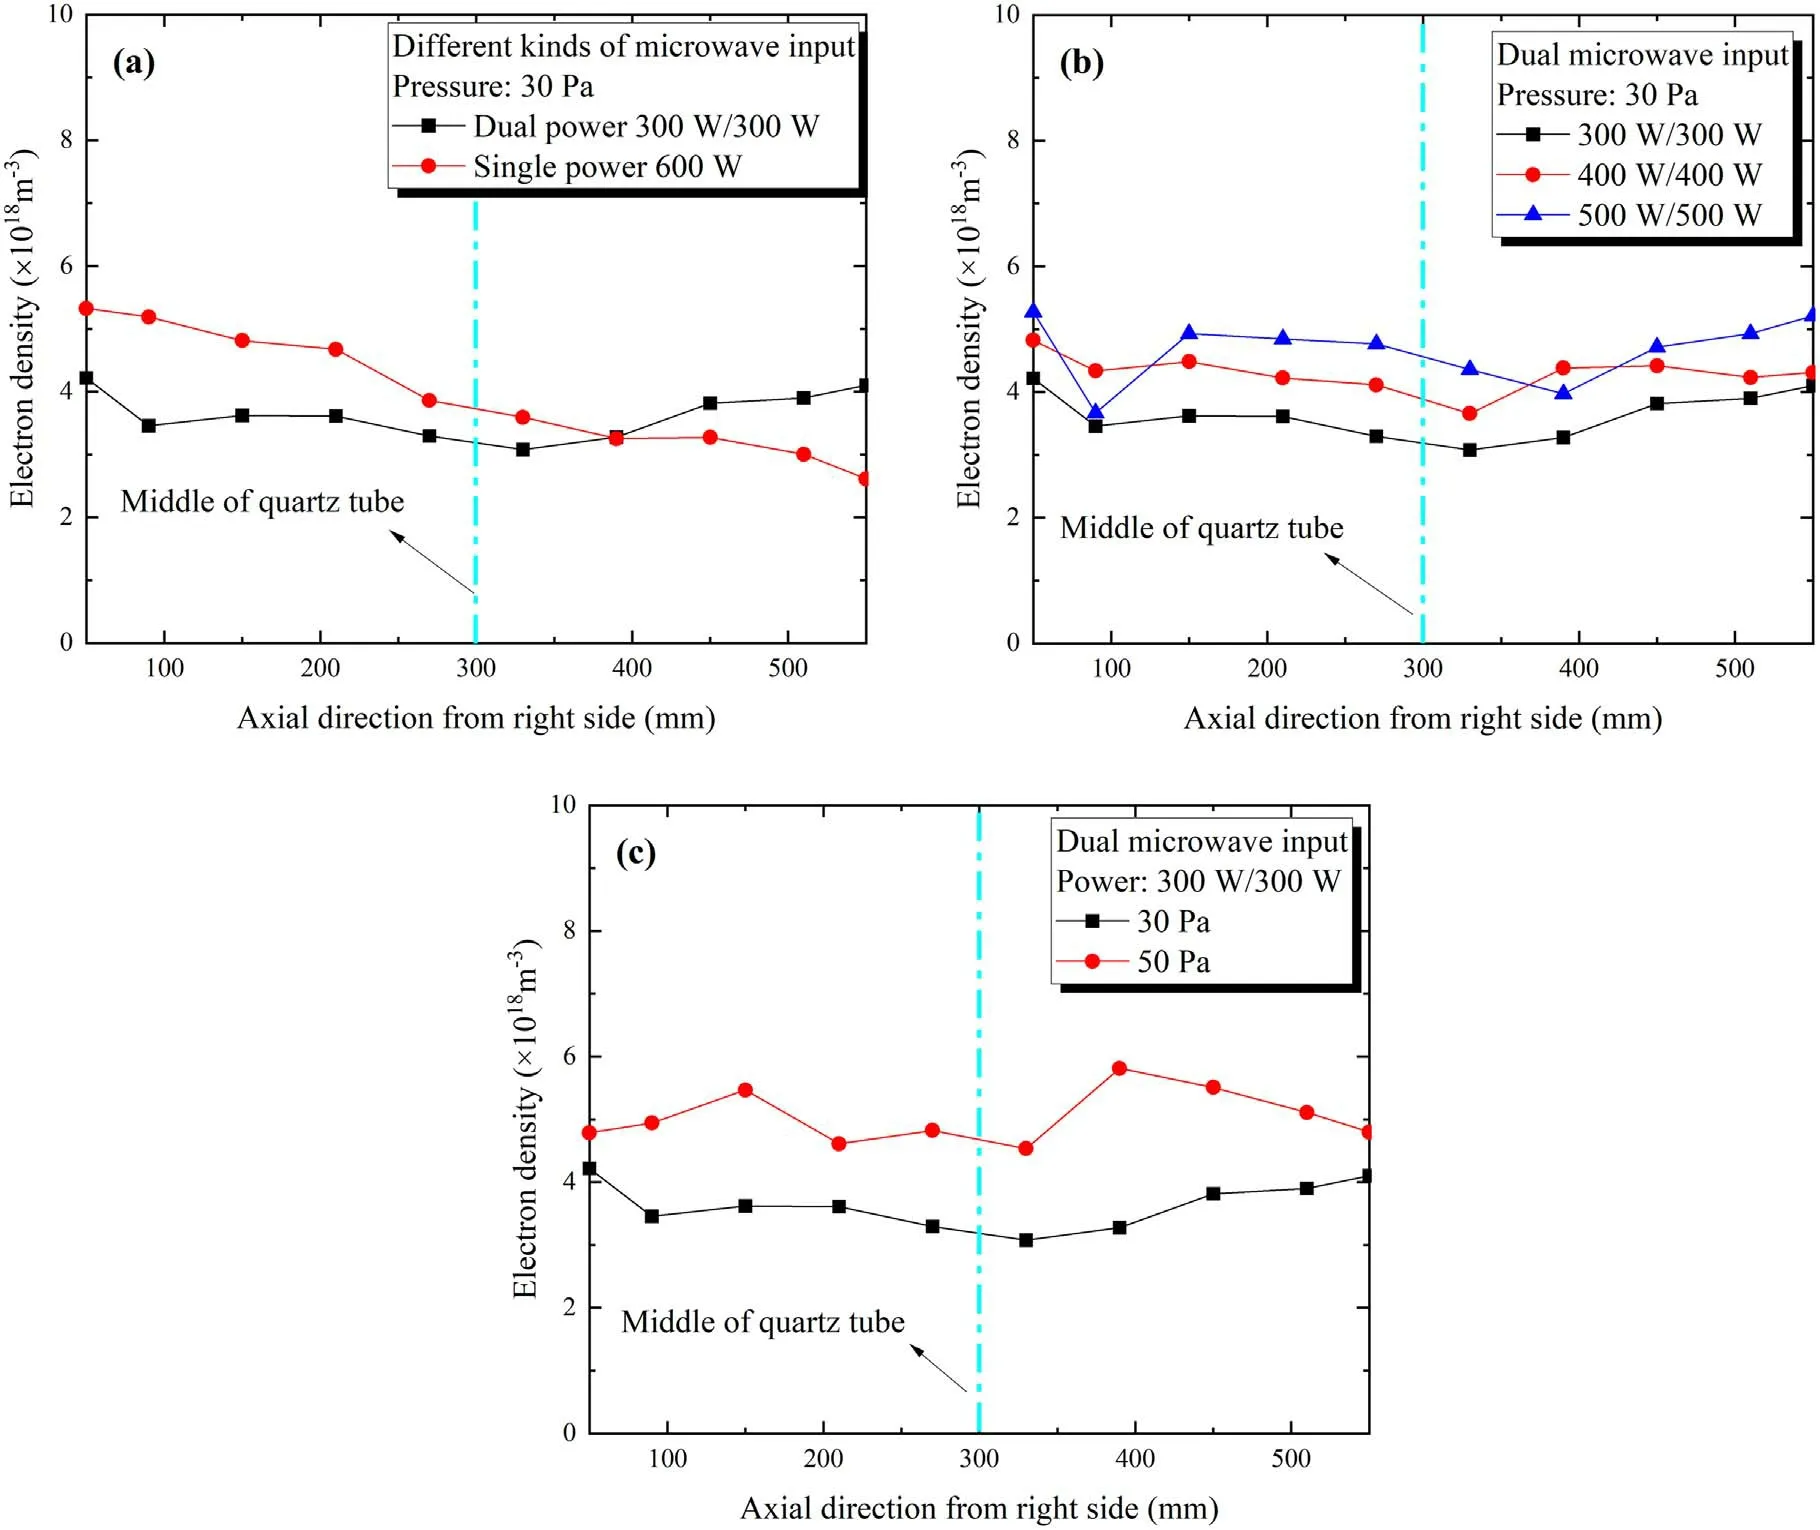
Figure 11.Axial distribution of electron density with(a)single and dual microwave powers input,(b)different microwave powers and(c)different gas pressures.
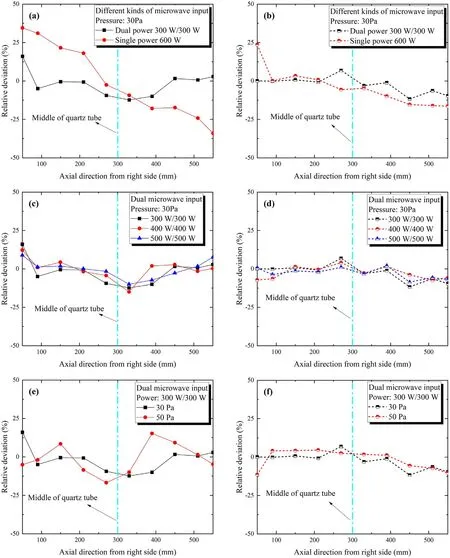
Figure 12.Relative deviation of electron density(left column)and electron excitation temperature(right column with dash line)under(a)(b)different types of microwave power input,(c)(d)different microwave powers and(e)(f)different pressure conditions.

Figure 13.The uniform coefficient of electron density(blue)and electron excitation temperature(red)under different discharge conditions.
In figure 11(a),the trend of electron density declines along axial direction with only one microwave power supplied,and reveals uniform apparently after replacing with dual microwave powers.The compensation of dual microwave powers plays significant role as before.That axial line distribution of electron density was found to have agreement with the previous numerical works in the[22-24].The twodimension and three-dimension models were built to investigate the inner physical process of the coaxial surface linear plasma.The typical plasma linear shape along the quartz tube could be found through modelling plasma discharge process.In figure 11(b),a regular change that higher microwave power generates higher electron density is present,although there seems to be one ‘bad point’ in the result of 500 W/500 W(blue line in figure 11(b)).From the distribution in figure 11(c),the electron density also rose when the gas pressure going up,which might be because a number of neutral particles are more to be excited in the reaction chamber under higher pressure.
However,the uniformity of plasma under 50 Pa shows poor performance comparing with that of pressure of 30 Pa,which will be discussed in detail next.Additionally,we compare the number of electron density with the similar work from Hüber[52]and find the comparable consistency.In their work,the coaxial linear plasma was created in low pressure argon at 0.1-3 mbar and the optical emission diagnostic was also used to measure the plasma parameters.In the results,the value of the electron density in the order of 1018m-3was observed at the pressure of 0.6 mbar with the single input power of 120 W.
3.4.Uniformity analysis
In order to satisfy with industrial application,many researchers are committed to develop large area uniform plasma source[53-56].The higher axial uniformity is one of the key features of coaxial surface wave linear plasma presented in this paper,especially the distributions of electron density and electron excitation temperature which are important for film fabrication.Therefore,in this section,the analysis of axial uniformity in these two plasma parameters is presented.
For exhibiting conveniently,the concept of relative deviation from statistics could be introduced to indicate the character of plasma homogeneity.The relative deviation is marked asφin this paper and can be described by the following equations:
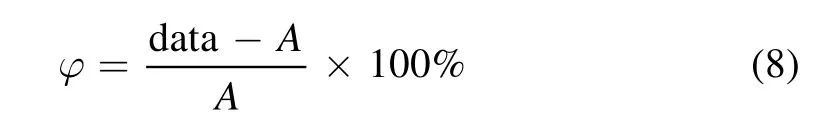
herein,‘data’ is the value of electron density or electron excitation temperature for each specified experiment point andAis the arithmetic average of these ‘data’.After calculating through equation(8)for all data on electron density and electron excitation temperature we obtained before,the distributions of relative deviation are shown in figure 12.
The distinction between behavior of plasma supplied by single microwave power and dual microwave powers is revealed in evidence in figures 12(a)and(b).The relative deviations of electron density and electron excitation temperature along the axial direction have the span almost 70%and 40% under the single microwave input,which are larger than the 25% and 20% of situation under dual microwave powers input respectively.In figures 12(c)and(d),the promotion of microwave power input narrows the range of relative deviation,no matter of electron density or electron excitation temperature.
As mentioned before,the axial uniformity performs great under low pressure on coaxial surface wave linear plasma device,and the fluctuation of electron density will be happened even in the change of 20 Pa which is shown in figure 12(e).However,the relative deviation seems to be lower in electron excitation temperature under 50 Pa.As far as my knowledge is concerned,that might be caused by decreasing mean free path between particles under higher pressure,which leads to energy transfer uniformly and quickly.
In figure 13,a short summary of uniformity analysis under four typical experimental conditions is shown as column chart.The uniform coefficient[57]is utilized for evaluating the plasma axial uniformity,which is calculated from the following equation:

here,theφmaxandφminare the maximum and minimum values of relative deviation,respectively.That means the better performance of uniformity with the lower uniform coefficient.The optimization of axial uniformity by dual microwave power supplied is proved,which depressed the uniform coefficient of electron density and electron excitation temperature in 40% and 22% respectively.With the power increased by 200 W,the uniform coefficient decreased by 10% approximately both in electron density and electron temperature.However,when the pressure grows up with 20 Pa,the uniform coefficient increased by ~4% of electron density but decreased by ~3% of electron temperature.
4.Conclusions
In conclusion,the coaxial surface wave linear plasma device with length over 600 mm supplied by 2.45 GHz microwave generator is developed.Different parameters of argon plasma are diagnosed through optical emission spectroscopy under low pressure.Boltzmann plot method with clear and highresolution spectral lines of Ar atoms is used for electron excitation temperature determination.The spectra of OH(A2Σ+- X2Πi)and the Balmer line Hβ(486.1 nm)are observed for the estimation of molecule rotational temperature and electron density.Then,the axial distributions of plasma parameters with function of microwave power and pressure are discussed.The results prove the good axial uniformity of coaxial surface wave linear plasma source under low pressure with dual microwave powers input.
Finally,the axial uniformity of electron density and electron excitation temperature is studied to find regulation.The uniform coefficient could be narrowed down around 40%and 22% in electron density and electron temperature respectively with the compensation of dual microwave powers input from two ends.The increasing of both power strength and gas pressure improves the uniform performance of electron excitation temperature by around 10% and 3%,respectively.However,the uniformity of electron density is ameliorated with microwave power rising but reduced with higher gas pressure.In general,the uniformity of coaxial surface wave linear plasma makes a good performance and could be controlled through adjusting microwave power and pressure.
Afterwards,the material treatment experiments such as carbon film deposition will be implemented through the coaxial surface wave linear plasma source platform.The work and results in this paper are helpful to determine the plasma parameters in our device and optimize the uniformity.
Acknowledgments
This work was supported by National Natural Science Foundation of China(Nos.11575252 and 11775270),and Institute of Energy of Hefei Comprehensive National Science Center,People’s Republic of China(Nos.19KZS206,21KZS201).
ORCID iDs
杂志排行

Plasma Science and Technology的其它文章
- Application of local Monte Carlo method in neutronics calculation of EAST radial neutron camera
- Effect of gas pressure on ion energy at substrate side of Ag target radio-frequency and very-high-frequency magnetron sputtering discharge
- Numerical simulation of hydrogen arcjet thruster with coupled sheath model
- An electromagnetic wave attenuation superposition structure for thin-layer plasma
- Plasma-assisted ammonia synthesis in a packed-bed dielectric barrier discharge reactor:roles of dielectric constant and thermal conductivity of packing materials
- A fast convergence fourth-order Vlasov model for Hall thruster ionization oscillation analyses