Impact of COVID- 19 infection rates on admissions for ambulatory care sensitive conditions: nationwide difference- in- difference design in Japan
2022-03-04MakotoKanekoSayuriShimizuAiOishiKiyohideFushimi
Makoto Kaneko , Sayuri Shimizu, Ai Oishi, Kiyohide Fushimi
ABSTRACT
INTRODUCTION
SARS— CoV— 2 infection (COVID— 19) has spread worldwide at the end of 2019. The WHO declared a pandemic in March 2020.1The high incidence of critically ill patients requiring intensive care during this period is associated with a significant burden on tertiary care facilities.23COVID— 19 has had an impact on primary care as well.4For example, in the Netherlands, the pandemic has changed patient behaviour by increasing the number of hospital visits for respiratory symptoms and has decreased visits for chronic conditions and face— to— face consultations,while increasing the use of telemedicine.5
The pandemic hit Japan slightly later. The first case of COVID— 19 was reported in January 2020.6The state of emergency was declared in Hokkaido, which is the northern part of Japan.6Subsequently, the state of emergency was declared in April.6The total number of COVID— 19 infections in Japan exceeded 10 000 people.6
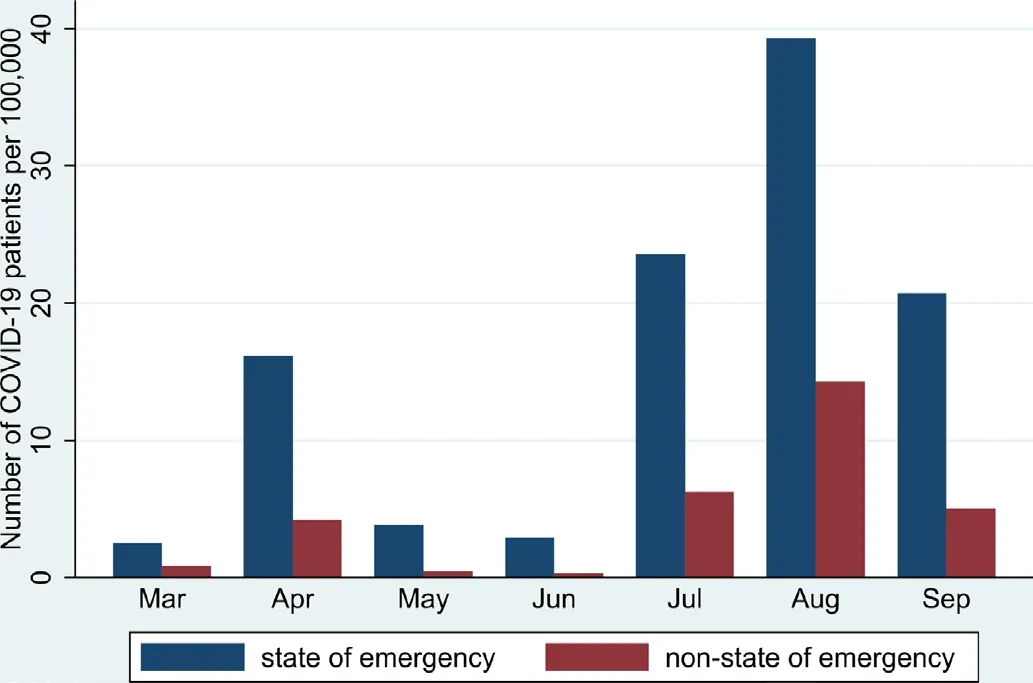
Figure 1 Number of COVID- 19 patients per 100 000 people in prefectures with the state of emergency and without the state of emergency.
Avoidable hospital admissions (admissions for ambulatory care sensitive conditions(ACSCs)) are defined as hospitalisation that is avoidable if appropriate primary care is provided.78Admissions for ACSCs have been employed as a quality indicator to assess primary care outcomes.910Even under the COVID— 19 pandemic, offering care for chronic diseases and prevention is an important aspect of primary care,5and appropriate control of admissions for ACSCs is essential to reduce the burden on secondary/tertiary care medical institutions.11The reason is that hospitals struggling with COVID— 19 can be associated with poorer outcomes for other diseases12—15due to both COVID— 19— specific factors and indirect factors.13On the other hand, increasing admission of patients with COVID— 19 might suppress the hospitalisation due to other diseases especially, mild to moderate illnesses such as admissions for ACSCs.Although a study in one state in the USA reported that the number of admissions for ACSCs decreased during the pandemic,16there is no nationwide study, especially in Asia, examining the association between admission for ACSCs and COVID— 19 infection. We hypothesised that the COVID— 19 pandemic has increased admissions for ACSCs in epidemic areas due to primary care physi—cians’ focus on patients with COVID— 19 and patients’refraining from medical care.
This study aimed to examine: (1) How the total number of admissions for ACSCs has changed between the areas with higher and lower rates of COVID— 19 infection and(2) How the number of admissions for acute ACSCs,chronic ACSCs and vaccine— preventable ACSCs has changed in Japan.
The results of the study would be useful to better under—stand how the COVID— 19 pandemic has affected primary and secondary care in terms of ACSCs. In addition,describing admissions for ACSCs is important as basic information for analysing role— sharing between primary and secondary care during the pandemic.
METHODS
Design
We conducted a retrospective, two— stage, cross— sectional study.
Setting
We extracted data from the nationwide Japanese Diag—nosis Procedure Combination (DPC) inpatient data—base1718from March 2019 to September 2019 and the same period in 2020.
Participants
Inclusion criteria
All patients aged ≥20 years who were admitted due to ACSCs during the study period were eligible for inclu—sion. We only included the same hospitals in 2019 and 2020. There were no exclusion criteria in this study.
Data source
The DPC contains data from 7 million inpatients admitted to 1173 hospitals in 2019, which represents 50% of all discharges from acute care hospitals in Japan.19Hospital data were extracted from the Survey of Medical Institu—tions data in Japan.19The data include the main problems for admission, age, sex, postal code of a patient, proce—dures and treatment during hospitalisation, and length of stay. In this study, university hospitals and hospitals in the National Hospital Organisation were not included because they did not submit data at the time of data extraction. The organisation includes 140 hospitals and 52 600 beds in Japan.20The hospitals in the organisation mainly consist of tertiary medical centres.20
Data collection tools and procedures
The data included age, sex, diagnosis codes according to the International Classification of Diseases 10th Revision(ICD— 10) and the Charlson Comorbidity Index (CCI),21and length of stay. We defined the period between March 2019 and September 2019 as before the COVID— 19 pandemic and between March 2020 and September 2020 as after the start of the COVID— 19 pandemic.
A main predictor of the study is ‘the state of emergency’or not. This is an indicator of the areas with higher infec—tion rates. In Japan, the declaration of the state of emer—gency is decided by the prime minister based on the bed occupancy rate for patients with COVID— 19, the number of patients per 100 000 people, the number of new patients,etc, in each prefecture.22Under the state of emergency,people are requested to refrain from going out and trav—elling unnecessarily, avoid social gathering and to reduce commuting by telecommuting.22Also, restaurants that serve alcoholic beverages or have karaoke are asked to cooperate with closure requests and all other restaurants are requested to cooperate in closing by 20:00 hours.22
The Japanese government declared a state of emer—gency on 7 April 2020, for seven prefectures (Saitama,Chiba, Tokyo, Kanagawa, Osaka, Hyogo and Fukuoka),and the local government of the Hokkaido prefecture,the northern part of Japan, proclaimed the same on 28 February 2020. Although the Japanese government adopted measures for the entire country of Japan from 16 April, eight prefectures remained at the centre of the pandemic. Of the 47 prefectures in Japan, the patients in the eight prefectures accounted for 72.5% of the total number of COVID— 19 patients. We described the number of COVID— 19 patients per 100 000 people in prefectures with the state of emergency and without the state of emer—gency in figure 1. Therefore, we compared data from these eight prefectures with those from other prefectures.The declaration of the state of emergency might be effec—tive in reducing the reproduction number by requesting individuals to refrain from going out.23
Measures
The outcomes of this study were the numbers of the following four types of ACSCs per 100 000 people between the COVID— 19 the areas with higher and lower rates of COVID— 19 infection: (1) acute ACSCs (where early appro—priate intervention can prevent more serious progression,eg, dehydration and gastroenteritis); (2) chronic ACSCs(where effective outpatient care can prevent exacerba—tion, eg, asthma, congestive heart failure and diabetes complications)(3) preventable ACSCs (where vaccina—tion and other interventions can prevent illness, eg,influenza and pneumococcal pneumonia: the category does not include COVID— 19)24and (4) overall ACSCs (a composite of these three ACSCs). Table 1 lists the ICD— 10 codes for the three ACSCs. Changes in the number of admissions for ACSCs in each month are described. In this study, we employed 19 ACSCs commonly used in the National Health Service in the UK.24The study excluded patients with COVID— 19 from the number of admissions for ACSCs. We employed the population in Japan and each prefecture as of 1 October 2019 and 2020 due to data availability.25
Baseline data
We described age, sex, length of hospital stay and CCI of the patients admitted during the study period due to ACSCs.1921We selected these variables based on the previous literature.1926
Statistical analysis
Continuous variables were presented as mean, SD,median and IQR. Categorical variables were presented as numbers and percentages. We employed a difference—in— differences design to compare the number ofhospital admissions due to ACSCs between March 2019 and September 2019 (prepandemic) and March 2020 and September 2020 (during the pandemic).192627As mentioned above, we compared prefectures under the state of emergency with prefectures not under the state of emergency. Also, as a subgroup analysis, we conducted a difference— in— difference analysis to compare the number of admissions for ACSCs each month in 2019 and 2020.All statistical analyses were conducted using StataCorp.2017. Stata Statistical Software: Release 15., StataCorp. We conducted a difference— in— difference analysis by creating an interaction between time (2019 and 2020) and expo—sure (the state of emergency).28

Table 1 ACSCs in this study: based on the National health service in the UK
RESULTS
The total number of ACSC admissions was 464 560 (276 530 in 2019 and 188 030 in 2020). Of the total number of admissions for ACSCs, the number of acute ACSCs was 143 074 (83 196 in 2019 and 59 878 in 2020), chronic ACSC admissions were 262 596 (153 495 in 2019 and 109 101 in 2020) and vaccine preventable ACSC admis—sions were 58 890 (39 839 in 2019 and 19 051 in 2020).In 2020, 74 959 ACSC admissions occurred in prefectures under the declared state of emergency. The total number of admissions for COVID— 19 was 19 173 (male/female:11 128/8045) and the median age was 59 (IQR 39—78) years.Table 2 shows the characteristics of the participants.
Table 3 describes the changes in the number of ACSC admissions per 100 000 people before and during the COVID— 19 pandemic. In prefectures under the state of emergency, the change in the number of admissions for ACSCs was not statistically significant: 7.50 (95% CI-87.02 to 102.01, p=0.873). Regarding acute, chronic and preventable ACSCs, the differences in the number of admissions were not significant: 2.57 (95% CI -38.54 to 43.69, p=0.901), 0.56 (95% CI -47.73 to 48.85, p=0.982),and 4.14 (95% CI -113.09 to 21.37), respectively.
Figure 2A-D shows the change in the number of admis—sions for ACSCs each month from March to September in 2019 and 2020.

Table 2 Characteristics of a cumulative total of the patients who were admitted due to ambulatory care sensitive conditions before and during COVID- 19 pandemic in the prefectures declared a state of emergency and other areas
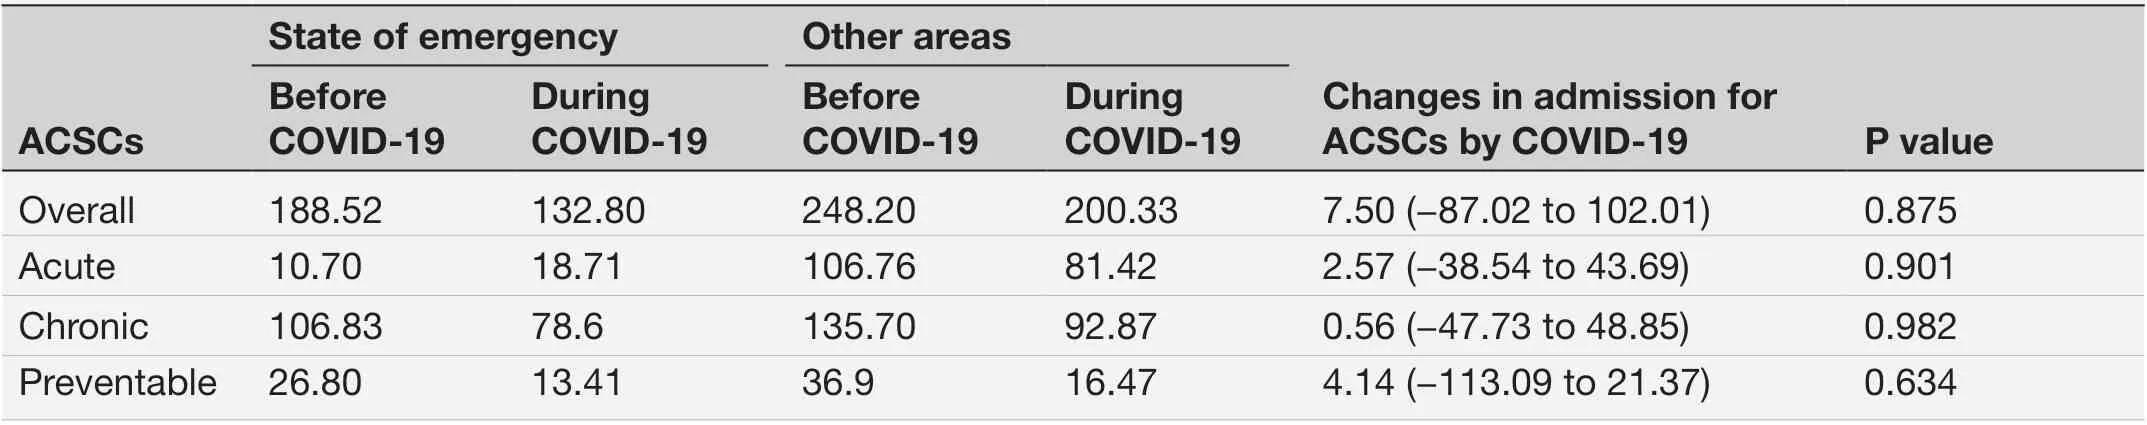
Table 3 Difference- in- differences analyses for changes in admissions for ambulatory care sensitive conditions (ACSCs) per 100 000 people in the prefectures declared a state of emergency and other areas
DISCUSSION
This is a nationwide survey that describes admissions for ACSCs. A reduction in admissions for ACSCs due to the COVID— 19 pandemic was not statistically signif—icant between the areas with higher and lower rates of COVID— 19 infection .
The results differed from our hypotheses. A possible reason may be the changes in individual lifestyle habits in both the areas with higher and lower rates of COVID— 19 infection, such as wearing masks or washing hands, which can reduce or limit the number of acute and preventable ACSCs. In Japan, admissions for asthma also decreased, and one mechanism responsible for this change was the adoption of these personal level hygiene measures.29In addition, ‘staying home’ to avoid contacting people affected by COVID— 192930could be associated with a lack of significant changes in admis—sions for ACSCs all over Japan. Regarding preventable ACSCs, admission for influenza decreased in 2020 in Japan.31This could be associated with a reduction in preventable ACSCs in Japan. Second, regarding chronic ACSCs, a healthy lifestyle, even during the stay— home period, may have contributed to preventing an increase in the number of ACSC admissions. A small study in Japan reported that patients with diabetes had main—tained or improved their dietary habits.32In addition,patients might have avoided visiting hospitals to reduce the burden on medical institutions or to avoid contact with people with COVID— 19530and thus might have implemented self— care. These changes might have occurred in both the areas with higher and lower rates of COVID— 19 infection. Third, the Japanese govern—ment has provided hotels to non— critical patients with COVID— 19 to prevent surges in hospital admissions.30This strategy might have been helpful in maintaining the quality of care in small— sized to medium— sized hospi—tals. Fourth, the impact of the pandemic on ACSC admissions might take a longer time. Thus, we must continuously evaluate the number of admissions for ACSCs.

Figure 2 (A) Difference- in- differences analyses for changes in admissions for all ambulatory care sensitive conditions (ACSCs)per 100 000 people each month in the prefectures declared a state of emergency and other areas. (B) Difference- in- differences analyses for changes in admissions for acute ACSCs per 100 000 people each month in the prefectures declared a state of emergency and other areas. (C) Difference- in- differences analyses for changes in admissions for chronic ACSCs per 100 000 people each month in the prefectures declared a state of emergency and other areas. (D): Difference- in- differences analyses for changes in admissions for preventable ACSCs per 100 000 people each month in the prefectures declared a state of emergency and other areas.
The clinical implications of the study are that COVID— 19 affects not only the areas with higher infec—tion rates but also the areas with lower rates. Previous research has reported reductions in non— ACSC and ACSC hospitalisations during the COVID— 19 pandemic.In addition, this study demonstrated that COVID— 19 might influence healthcare use, even in the areas with lower infection rates. These results might be affected by multiple factors, such as changes in individual life—style, healthcare— seeking behaviour and health policy.In the areas with higher and lower rates of COVID— 19 infection, primary care providers need to adjust to the change in healthcare use.
To the best of our knowledge, this is the first nation—wide study to describe the impact of COVID— 19 on ACSCs in the areas with higher and lower rates of COVID— 19 infection. This study demonstrated the comprehensive status of ACSCs during the COVID— 19 pandemic.
This study had some limitations. First, the definition of ACSCs in the study was developed in the UK24and its validity in Japan remains unclear.19There is currently no Japanese definition of ACSCs. As previous studies in Japan have employed the UK definition,192433we used the same definition in this study. Second, this study did not include information on the socioeconomic status of patients, as admissions for ACSCs have been associated with lower socioeconomic status.8Since our dataset did not contain this information, our results need to be interpreted carefully. In addition, the lack of difference in admissions for ACSCs might be explained by the fear of exposure from going to the hospital.34To overcome this limitation, we need to consider the number of out— of—hospital mortalities due to ACSCs. However, there is no database to count the number of ACSCs in out— of— hospital settings in Japan. Lastly, because the study did not include university hospitals and hospitals of the National Hospital Organisation, we could not determine the status of admis—sions for ACSCs in these hospitals. The status in these tertiary care hospitals might change differently compared with community hospitals.
CONCLUSION
This study revealed the number of hospital admissions for total and acute/chronic/preventable ACSCs before and during the COVID— 19 pandemic in Japan. Although admissions for ACSCs decreased during the COVID— 19 pandemic, there was no significant change between the areas with higher and lower rates of COVID— 19 infection.This implies that the COVID— 19 pandemic affects the areas with higher infection rates and the areas with lower rates. Individual lifestyle habits, a patient’s healthcare—seeking behaviour, and health policies may affect the results.
TwitterMakoto Kaneko @makoto_knk
AcknowledgementsWe would like to thank Editage ( www. editage. com) for English language editing.
ContributorsMK designed the study and participated in the implementation,data collection, data analysis, and writing of the manuscript. MK also served as the guarantor. SS, AO and KF contributed to the design of the study and critically reviewed the manuscript. MK analysed the data. All authors had full access to the data and take responsibility for the integrity and accuracy of the analyses and all authors have read and approved the manuscript.
FundingThis study was supported by a grant from the 2020-2021 Research Development Fund of Yokohama City University.
Competing interestsNone declared.
Patient consent for publicationNot applicable.
Ethics approvalThe study protocol was performed in accordance with the Declaration of Helsinki, reviewed and approved by the ethics committee of the Tokyo Medical and Dental University (approval number: M2000- 78- 16). Informed consent was waived by the ethics committee of the Tokyo Medical and Dental University due to the anonymous nature of the data.
Provenance and peer reviewNot commissioned; externally peer reviewed.
Data availability statementData are available on reasonable request. The datasets used and/or analyzed during the current study are available from the corresponding author on reasonable request.
Open accessThis is an open access article distributed in accordance with the Creative Commons Attribution Non Commercial (CC BY- NC 4.0) license, which permits others to distribute, remix, adapt, build upon this work non- commercially,and license their derivative works on different terms, provided the original work is properly cited, appropriate credit is given, any changes made indicated, and the use is non- commercial. See: http://creativecommons.org/licenses/by-nc/4.0/.
ORCID iDMakoto Kaneko http://orcid.org/0000-0002-4581-8274