Determination of the full-field stress and displacement using photoelasticity and sampling moiré method in a 3D-printed model
2022-03-04ZhangyuRenQiZhangYangJuHuiminXie
Zhangyu Ren, Qi Zhang, Yang Ju, Huimin Xie
a School of Emergency Management and Safety Engineering, China University of Mining and Technology at Beijing, Beijing 100083, China
b State Key Laboratory of Coal Resources and Safe Mining, China University of Mining and Technology at Beijing, Beijing 100083, China
c Qiantang Science and Technology Innovation Center, Zhejiang 310018, China
d School of Aerospace Engineering, Tsinghua University, Beijing 100084, China
Keywords:Stress fields Displacement fields Photoelasticity Sampling moiré method 3D printing technique
ABSTRACT The quantitative characterization of the full-field stress and displacement is significant for analyzing the failure and instability of engineering materials. Various optical measurement techniques such as photoelasticity, moiré and digital image correlation methods have been developed to achieve this goal. However,these methods are difficult to incorporate to determine the stress and displacement fields simultaneously because the tested models must contain particles and grating for displacement measurement; however,these elements will disturb the light passing through the tested models using photoelasticity. In this study, by combining photoelasticity and the sampling moiré method, we developed a method to determine the stress and displacement fields simultaneously in a three-dimensional (3D)-printed photoelastic model with orthogonal grating. Then, the full-field stress was determined by analyzing 10 photoelastic patterns, and the displacement fields were calculated using the sampling moiré method. The results indicate that the developed method can simultaneously determine the stress and displacement fields.
Quantitatively characterizing the full-field stress and displacement in engineering materials is of vital significance for solving various engineering problems where the stress and deformation distributions govern the failure and instability of the materials. For instance, the long-term stability and safety of underground constructions, such as the channel linking England and France and Japan’s Seikan Tunnel, rely on the knowledge of fullfield stress and deformation distributions in the surrounding rock masses [1,2]. The evaluation and prediction of the safety and service life of metal constructions, such as the blades of aircraft engines and rocket shells, also require a complete understanding of the stress and deformation distributions around their interior defects [3,4]. Furthermore, the optimal design of photoelectric components, which involves reducing the interference of stressinduced birefringence in optical fibers, depends on the residual stress, which is affected by the internal displacement distribution of the materials [5,6].
Various experimental mechanical methods have been developed to determine full-field stress and displacement, such as photoelasticity, moiré, and digital image correlation techniques [7]. Based on the interference fringe caused by the temporary birefringence of transparent materials, photoelasticity can determine the full-field stress in the tested models [8–12]. Moiré techniques, including geometric moiré, moiré interference, and sampling moiré methods,have been developed to measure displacement fields by analyzing moiré patterns [13–16]. For digital image correlation, the fullfield displacement can be calculated by tracking the space position change of speckles [17–20]. Photoelasticity has been proposed to measure the stress fields, and moiré and digital image correlation techniques have been developed to determine the displacement fields [7]; however, with the development of experimental mechanics, the stress and displacement fields need to be obtained simultaneously—for instance, the evaluation of constitutive parameters based on the measured stress and strain fields [21,22], the evaluation of some mechanics models [23], and the characterization of failure and instability by energy evolution [24].

Fig. 1. Experimental arrangements of photoelasticity and the 10 images captured under different arrangements, (a) experimental arrangement of the four-step phase-shifting method, (b) experimental arrangement of the six-step phase-shifting method, (c) four color images captured in the four-step phase-shifting method, (d) six monochromatic images captured in the six-step phase-shifting method.
However, hardly any methods can simultaneously and directly measure the stress and displacement fields, and combining these methods to achieve this goal is difficult [7]. This is because moiré and digital image correlation techniques require the prefabrication of gratings and speckles in the tested models, and the displacement can be determined [25,26]. However, photoelasticity requires the tested models to remain transparent so that polarized light can be passed [27,28]. The prefabricated gratings and particles disturb the polarized light passing through the tested models, and the photoelastic fringe affects the recognition of the particles and gratings, which makes the simultaneous measurement of stress and displacement fields incorporating photoelasticity and other displacement measurement techniques difficult.
In this study, a method combining photoelasticity and sampling moiré techniques was proposed to determine the stress and displacement fields simultaneously, where a nonopaque orthogonal grating was printed on the model surface through a threedimensional (3D) printing technique using a transparent magenta material, and the other part was printed with transparent photoelastic materials. Based on the phase-shifting and unwrapping techniques, the full-field stress was calculated by processing 10 different photoelastic patterns with different polariscope arrangements, and the displacement fields were determined by analyzing the sampling moiré patterns of the grating images before and after deformation, which were captured under a circular polariscope without the analyzer. The effectiveness of the developed method was verified using a square model with three holes, and the results indicate that the method can simultaneously determine the stress and displacement fields.
Photoelasticity was used to determine the full-field stress. For photoelastic fringes under a circular polariscope for a dark field,the pattern directly presents the stress distribution, and the denser the fringes, the higher is the stress. To export the stress fields quantitatively, phase-shifting and unwrapping techniques were first employed to determine the isoclinic and isochromatic phasesbased on 10 images under plane and circular polariscopes. The arrangements of the plane polariscope and circular polariscope are shown in Fig. 1a and 1b, where the marked angles are listed in Tables 1 and 2. The equations in Tables 1 and 2 indicate that the light passed through the analyzer and was captured by a digital camera. A circular ring (external diameter = 50 mm, internal diameter = 20 mm, and thickness = 8 mm) under a compressive load of 1500 N was selected to present 10 photoelastic images under these arrangements. Figure 1c and 1d show four color images and six monochromatic images. Notably, white light was used in the plane polariscope to capture color images, and monochromatic light with a wavelength of 589.3 nm was used in the circular polariscope to capture the six monochromatic images.
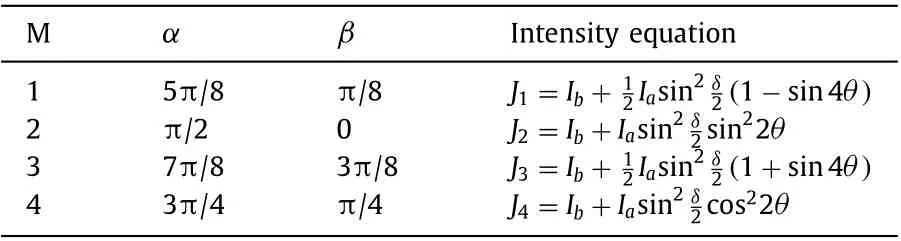
Table 1 Intensity equations of the four color images.

Table 2 Intensity equations of the circular polariscope.
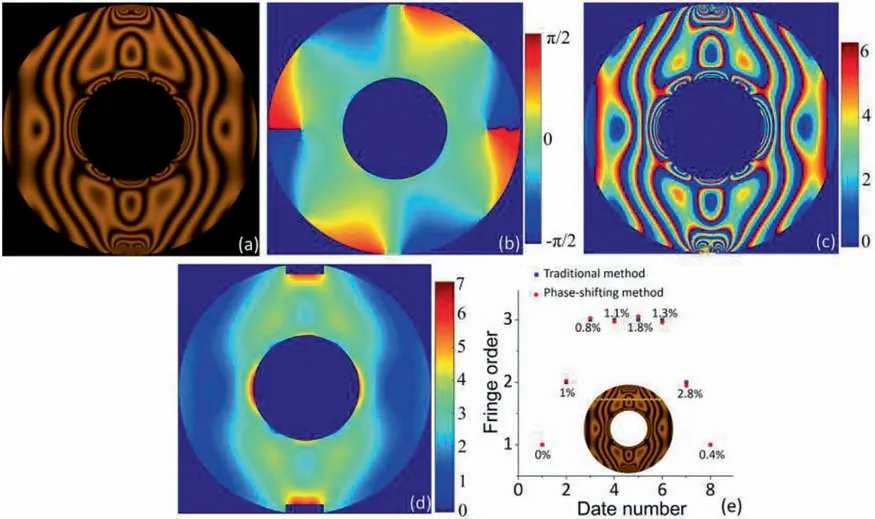
Fig. 2. Calculated results of a diametrical compressive circular ring, (a) photoelastic pattern under circular polariscope for a dark field, (b) isoclinic phase, (c) wrapped isochromatic phase, (d) unwrapped isochromatic phase, (e) errors in the points along the marked yellow line in the circular ring. Note that the error e= , where NTM and NPSN are the fringe orders calculated using the traditional method, where the darkest fringes are the integral orders, and the phase-shifting method, respectively.

Fig. 3. Flowchart to calculate the displacement field using the sampling moiré method, (a) grating image and the light intensity along the red line, (b) sampling points with different start points, (c) extended points by spline interpolating, (d) moiré caused by sampling and interpolating, (e) wrapped phase calculated using the moirés in Fig. 3d,(f) unwrapped phase of Fig. 3e [14].
For photoelasticity, the isoclinic and isochromatic phase fields are critical for calculating stress fields. The following steps were performed to determine the full-field isoclinic and isochromatic phases. First, based on the four-step color phase-shifting method and the light intensities of the four color images in Table 1 [29],we calculated the wrapped isoclinic phase in the interval [0, π/4]using
Then, the continuous isoclinic phase in the interval (-π/2, π/2](see Fig. 2b) can be calculated using the isoclinic phase in the intervals [0, π/2] and (-π/4, π/4], exported from the interval[0, π/4] [29]. Subsequently, based on the six-step phase-shifting method and the light intensities of the six monochromatic images inTable 2 [11,30], the wrapped isochromatic phase can be obtained as:

Fig. 4. Fabrication of the experimental model, (a) designed digital model, (b) enlargement of the local grating in the digital model, (c) enlargement of the local grating in the 3D-printed model, (d) 3D-printed model, (e) local enlargement of the cross profile.

Fig. 5. Experimental equipment including photoelastic arrangements and servo loading facility.
whereθ′is the calculated isoclinic phase in the interval (-π/2,π/2)]. Finally, we introduced the quality-guide unwrapping method to unwrap the wrapped isochromatic phase to determine the continuous isochromatic phase [31]. Figure 2c and 2d show the wrapped isochromatic phase and fringe orders in the circular ring.The uniform distribution of the wrapped isochromatic phase and photoelastic fringe (see Fig. 2a) indicates the effectiveness of the phase-shifting method in determining the fringe orders. In our previous study [32], an error was defined to test the effectiveness of the calculated fringe orders. Fig. 2e shows the fringe orders calculated using the traditional method, where the darkest fringes are the integral orders, and the phase-shifting method. The low error in the points along the yellow line marked in the circular ring indicates that the methods used to determine fringe orders have good accuracy. The effectiveness and accuracy of the method that combines the phase-shifting and unwrapping techniques to determine the isoclinic and isochromatic phases have also been demonstrated[11,30].
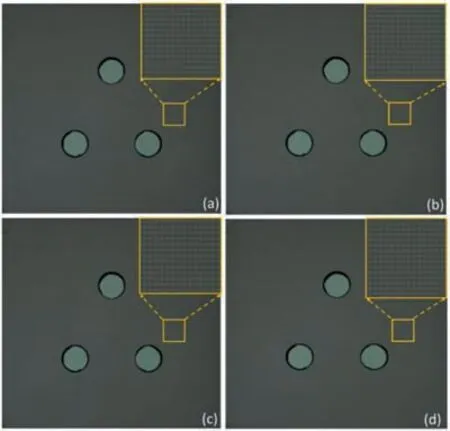
Fig. 6. Grating images of the tested model, (a) and (b) grating images before and after loading under 5 kN, (c) and (d) grating images before and after loading under 7 kN. Note that the resolution of these figures is 25.45 μm/pixel.
For photoelasticity, the distribution of the fringe orders is equivalent to the principal stress difference, and based on the photoelastic stress-optic law and elastic theory, the full-field principal stress difference and shear stress can be directly determined by isoclinic and isochromatic phases, which will be described later.The sampling moiré method has been widely used in displacement measurements, and its theory has been described in detail in previous literatures [15,16,34,35]. Figure 3 presents a flowchart of the displacement calculation using this method. First, a grating image with pitchpgwas captured, where the deformation was modulated, as shown in Fig. 3a. The light intensity along the red line can be expressed as [34]:
whereIbandIaare the background intensity and the amplitude of the grating intensity, respectively.pg, ϕ0, andϕgare the grating pitch, initial phase, and grating phase, respectively. Subsequently,the obtained grating image was sampled using a uniform sampling pitchps(see Fig. 3b), and several arrays of sampling points with different starting points were obtained, such as the red and blue points in Fig. 3b. These thinned-out sampling points were then extended to the size of the initial grating image using spline interpolation, as shown by the red and blue lines in Fig. 3c. The moiré patterns were generated based on different sampling images (see Fig. 3d), where the moiré spacingpmcan be calculated by [34]:
wherepgandpsare the grating and sampling pitches, respectively.Several sampling moiré patterns were generated based on the uniform shifted phase of 2π/psand their intensities can be expressed as [34]:
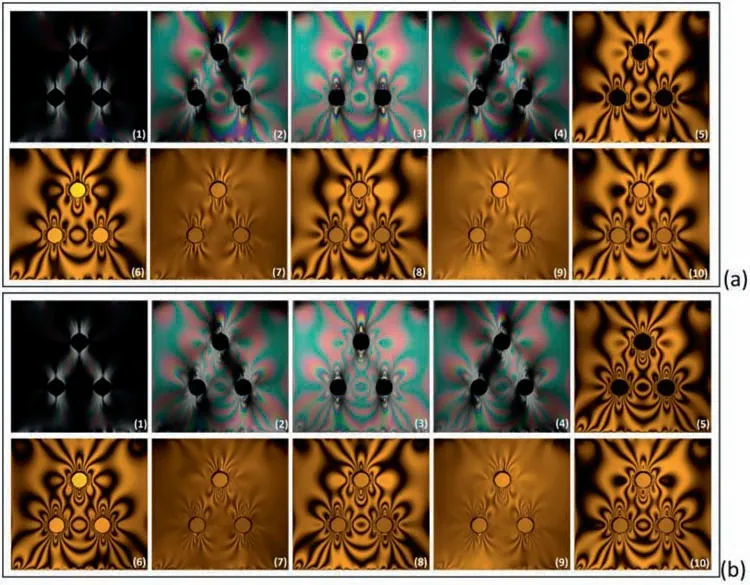
Fig. 7. Four color and six monochromatic photoelastic images captured according to Tables 1 and 2.
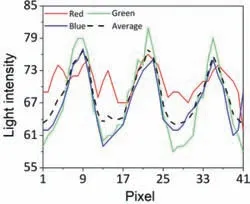
Fig. 8. Comparison of light intensities in the red, green, and blue channels and their average.
whereIm(y, i) andϕmare the intensities of theith sampling moiré pattern and the initial phase of the sampling moiré pattern, respectively. Based on multiple phase-shifting techniques, the wrapped phase field (in the interval [0, 2π]) of the sampling moiré pattern can be calculated by [34]:
The wrapped phase field can be unwrapped using various phase-unwrapping methods [31]. Thus, the continuous phase distribution of the sampling moiré patterns can be calculated. The phase difference of the grating patterns before and after deformation must be determined to calculate the displacement field modulated in the grating patterns. Based on the principle of sampling moiré [16], the phase difference of the grating patterns before and after deformation is equal to the phase difference of the corresponding sampling moiré patterns. The relationship between the displacement and phase difference can be expressed as [14]:
whereϕ’gandϕ’mare the grating phase and sampling moiré phase, respectively, after the deformation. To determine the displacement fields along two orthogonal directions, the above process must be repeated in these two directions. Notably, for real gratings in experiments, the intensity captured by the camera is similar to a square wave that needs to be filtered before sampling.The sampling moiré method is a mature technique for measuring displacement fields, and its accuracy has been adequately verified in previous studies [16,34,36].
The tested model must simultaneously satisfy the measured preconditions to combine the photoelastic and sampling moiré methods to measure the stress and displacement fields. For instance, for photoelasticity, the materials of the tested models need to have a temporary birefringence effect and transparency; for the sampling moiré method, apparent and measurable grating lines need to be observed. If the gratings cover the photoelastic fringes or if the photoelastic fringes disturb the gratings, the stress and displacement fields cannot be determined simultaneously. In our previous study, a transparent resin material with a temporary birefringence effect was introduced to fabricate photoelastic models using 3D printing techniques [8,10,12]. This process overcame the difficulties of complex model fabrication through traditional photoelasticity.
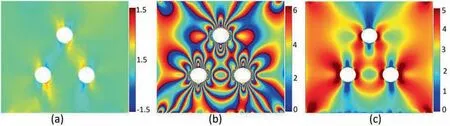
Fig. 9. Calculated results of the photoelastic fringe in the tested model under a compressive load of 7 kN, (a) isoclinic phase, (b) wrapped isochromatic phase, (c) fringe orders.
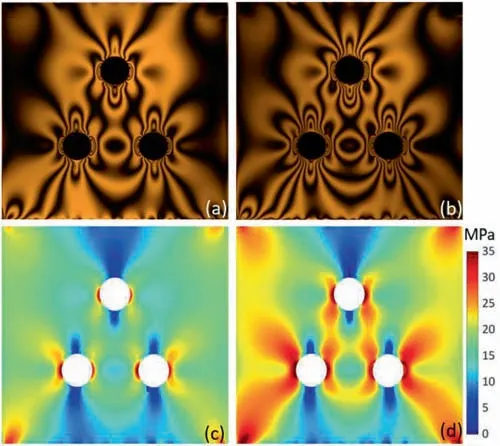
Fig. 10. Photoelastic fringes (a, b) and principal stress difference distributions (c, d)in the tested model under the compressive loads of 5 and 7 kN.
Two transparent resin materials were used to print the model.The first was the material used in our previous study, VeroClear RGD 810 (Stratasys Ltd., USA), and the second was VeroMagentaV(Stratasys Ltd., USA). The basic chemical compositions of these materials were uniform, and magenta dye was added to the second material. Note that the addition of magenta dye to the printed materials reduced the transmission of light, but it had little influence on the photoelasticity. To ensure that the tested models were simultaneously applicable for photoelasticity and the sampling moiré method, the tested model was divided into a basement, which was printed with VeroClear RGD 810, and a surface film, which was printed with VeroMagentaV. The gratings were embedded in the model surface, which was flat; thus, the propagation direction of the light was not influenced by the surface shape of the tested models.
A square plate (50 × 50 × 8 mm3) containing three holes(diameterΦ= 5 mm) was selected as the experimental model because it quantitatively characterizes the full-field stress and displacement in the models, including holes, and is significant for analyzing and predicting the instability and failure of materials,such as the damage and failure caused by high-concentration stress around film holes in the blades of turbines and gas turbines.Figure 4a shows the digital model, and Fig. 4b shows the enlargement of the local surface grating where the black points were printed with VeroMagentaV and the gray parts were printed with VeroClear RGD 810. The 3D printer used was an Objet J750 (Stratasys Ltd., USA) with a printed resolution of 42 × 84 × 27 μm, where the highest resolution was along the direction of the thickness increase. The grating pitch was designed to be 336 μm along horizontal and vertical directions with a thickness of 513 μm, which can be printed with the selected 3D printer. Figure 4d shows the printed model, and Fig. 4c shows a local enlargement of the printed model where the grating can be observed. Figure 4e shows a local enlargement of the cross profile along the thickness direction, where the thickness of the magenta surface grating can be distinguished. Note that the magenta grating material will reduce the intensity of the light passing through, whereas, based on the phase-shifting techniques, the intensity of the background and transmission lights will be eliminated in the calculation. In addition, the mechanical and optical properties of the two printed materials were similar (https://www.stratasys.com/contentassets/7cc62a485ea14e50883513224bc12e79/mds_pj_vero-for-j55_0421a.pdf?v=4a1891), and the thickness of the surface grating was small compared with that of the model. Thus, the influence of the magenta surface grating on the photoelastic fringe is ignored.

Fig. 11. Principal stress difference distributions in the tested model (a) along a vertical line and (b) along a horizontal line. The lines are shown in the additional principal stress difference contours as dark lines.
Figure 5 shows the experimental equipment used in our test,which includes the photoelastic arrangements and the loading facility. The photoelastic arrangements include a polarizer, first and second quarter-wave plates, an analyzer, a white and monochromatic light source, and a charge-coupled device camera. Compressive loads of 5 and 7 kN were selected as the tested loads to observe the photoelastic patterns. First, the analyzer was removed,which indicates that the interference condition was not satisfied;thus, no photoelastic fringes were formed in the tested model, and the grating image before loading (see Fig. 6a) was captured under white light. Subsequently, the load was applied to the top surface of the tested model and slowly increased to 5 kN. The grating image of the model under a load of 5 kN was captured (Fig. 6b). Then,the analyzer was set up again to capture the 10 photoelastic images described in this letter,as shown in Fig. 7a. By repeating the above process, the grating images and photoelastic patterns under a compressive load of 7 kN can be captured (see Figs. 6c, 6d and 7b). Finally, all the images, including ten photoelastic images for the determination of stress fields and two grating images for the calculation of displacement fields, were captured.

Fig. 12. (a, b) Shear stress distributions in the tested model under the compressive loads of 5 and 7 kN, (c, d) shear stress distributions along the vertical and horizontal lines. The lines are shown in the additional shear stress contours as dark lines.

Fig. 13. Calculated flowchart of the displacement fields.
Grating images were captured using a color camera under a white light source. The light intensities in the red, green, and blue channels captured by the color camera in an arbitrary local zone are shown in Fig. 8, to obtain a higher-quality grating. The periodicity of the light intensity in the red channel is not apparent, which is detrimental to the accuracy of the sampling moiré method. In contrast, the periodicity of the light intensities in the green and blue channels is stable, which makes them suitable for the sampling moiré method. Finally, the grating in the green channel was selected as our measured grating because of its higher contrast in light intensity.
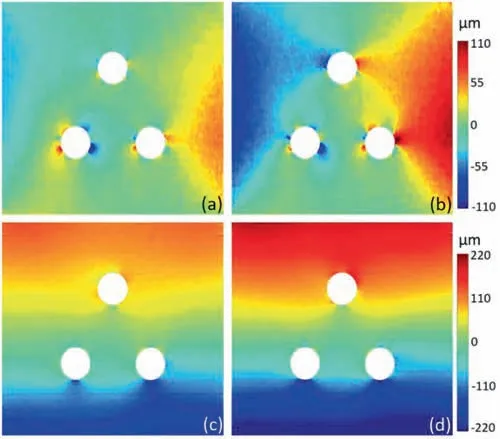
Fig. 14. (a, b) Displacement fields in the horizontal direction in the tested model under the compressive loads of 5 and 7 kN, (c, d) displacement fields in the vertical direction in the tested model under the compressive loads of 5 and 7 kN.
Based on the photoelasticity method and the photoelastic images in Fig. 7a and 7b, the full-field fringe orders in the threehole model can be determined. Figure 9 shows the calculated isoclinic phase, wrapped isochromatic phase, and fringe orders,which provide important information for the determination of stress fields. Figure 10a and 10b show the photoelastic pattern under a dark field obtained with a circular polariscope, where the darkest fringes indicate the integral-order fringe and the brightest fringes represent the half-integral-order fringe. This photoelastic pattern directly indicates the distribution of the principal stress difference; the denser the fringes, the higher is the stress. Based on the photoelastic stress-optic law [33], the distribution of the principal stress difference can be directly determined by the fringe orders or isochromatic phase, and the principal stress difference can be expressed as:
whereσ1andσ2are the first and second principal stresses, respectively,σx, σy, andτxyare the stress components;n, δ, d, andfare the fringe orders, isochromatic phase, model thickness, and material stress fringe value, respectively. Here, the material stress fringe value was 36.1 N/mm/fringe. Figure 10c and 10d present the distribution of the principal stress difference in the three-hole model, where the high-stress-concentrated zones around the holes can be quantitatively characterized. To illustrate the stress distribution, the principal stress difference along the vertical and horizontal lines is shown in Fig. 11, which demonstrates the evolution of the principal stress difference with the compressive load.
According to elastic theory, the shear stress componentτxycan be calculated by:whereθ’is the isoclinic phase. Therefore, the shear stress component can be directly determined using the photoelastic method.Figure 12a and 12b show the shear stress field, which indicates that zones with high-concentration shear stress are formed between the holes. Figure 12c and 12d show the shear stress distributions along the vertical and horizontal lines, which indicates that the increment of the shear stress along the selected lines is smaller than the increment of the principal stress difference. In other words, the principal stress difference was the primary factor that dominated the failure of the tested model. Notably, based on stress separation techniques, the full-field stress componentsσxandσycan be determined, but this requires additional experiments or numerical calculations [37]. These stress components are not directly extended by photoelasticity; therefore, we did not calculate the stress components.

Fig. 15. Displacement distributions in the tested model (a) along a vertical line and (b) along a horizontal line. The lines are shown in the additional displacement contours as dark lines.

Fig. 16. (a, b) Shear strain fields and (c, d) comparison of shear stress and shear strain along a horizontal line in the tested model under the compressive loads of 5 and 7 kN.
The displacement fields were calculated using the sampling moiré method, and the horizontal displacement phase in a local grating near the top and right holes in the tested model was selected to represent the calculation process, as shown in Fig. 13.First, the referenced and deformed images of the orthogonal grating were obtained, where the grating pitch was approximately 13 pixels. Then, the single-lined gratings in the horizontal direction were obtained using the mean filtering technique with a window of 7 × 1 pixels, as shown by the single-lined grating in Fig. 13. Subsequently, the sampling moiré patterns were determined by sampling with a uniform space of 13 pixels and interpolating using cubic spline interpolation. It has been verified that the accuracy will be high when filtering with a window of approximately half the size of the grating pitch and the sampling space is approximately the grating pitch [16]. According to Eq. (6),13 phase-shifting moiré patterns of the referenced and deformed images were determined by the ordered shifting of one pixel in the horizontal direction, as shown in Fig. 13. Subsequently, based on the phase-shifting technique, the wrapped moiré phases before and after deformation were calculated using Eq. (6). Then,the unwrapped moiré phase (see the moiré phase in Fig. 13) was calculated using the unwrapping methods. Finally, the displacement field in the horizontal direction (Fig. 13) was calculated using Eq. (7). Following the same steps, the displacement field in the vertical direction was calculated by processing the gratings before and after deformation, which were rotated 90° clockwise. The displacement field can then be rotated 90° anticlockwise to the origin position. Briefly, following these steps, the displacement fields in the vertical and horizontal directions were quantitatively determined.
Figure 14 shows the displacement fields in the horizontal and vertical directions. This indicates that the full-field displacement under different compressive loads can be determined effectively.Because of the Poisson effect and the symmetric hole structure,the displacement field in the horizontal direction is approximately symmetric, and the axis of symmetry is the middle line. However,the displacement was oriented to the left for most zones on the left of the middle line, and the displacement was oriented to the right for most zones on the right. In the vertical direction, the displacement in the zone close to the middle line was set as the reference zone displacement field, and the downward direction was set as the positive direction of the vertical displacement. The displacements in the horizontal and vertical directions along certain lines are curved in Fig. 15 to demonstrate the evolution of the displacement fields. The holes significantly influence the fluctuation of the displacement distribution, and the displacement increment with the compression load can be observed.
To compare the stress and displacement fields calculated using the photoelasticity and sampling moiré methods, the shear strain field was calculated using the least square method based on the horizontal and vertical displacement fields. Figure 16a and 16b show the shear strain field in the tested model under the loads of 5 kN and 7 kN, respectively, and the distributions are similar with respect to the shear stress field. The shear stress and shear strain along a horizontal line are shown in Fig. 16c and 16d, respectively,and their uniform distributions confirmed the effectiveness of the measured stress and displacement fields.
A full-field measurement method combining photoelasticity and the sampling moiré method was developed to determine the stress and displacement fields simultaneously. The effectiveness of the method was verified by measuring the stress and displacement fields in a square model with three holes. The detailed conclusions are as follows.
(1) A high-resolution 3D printer was used to fabricate the tested model with three holes and a nonopaque orthogonal grating on the model surface using different printing materials. The nonopaque grating will have no influence on the stress field calculation using photoelasticity, and the photoelastic experimental arrangements after removing the analyzer will have no influence on the capturing of the grating images, which ensures the simultaneous measurement of stress and displacement fields.
(2) The stress and displacement fields were simultaneously determined by incorporating the photoelasticity and sampling moiré methods. Based on the phase-shifting and unwrapping techniques, the stress fields were calculated by processing 10 photoelastic patterns under different polariscope arrangements,and the displacement fields were determined by processing the sampling moiré patterns. The stress and displacement fields in a square plate with three holes were calculated, and the shear stress and strain along a horizontal line were presented to verify the effectiveness of the developed method.
Although the stress and displacement fields were determined using the developed method, some difficulties still need to be overcome. For instance, how can high-precision strain fields be calculated based on the displacements calculated using the sampling moiré method? The current study focuses on determining the stress and displacement fields under quasi-static loads. Our future work will focus on how to measure the stress and displacement fields under dynamic loads, and we have already conducted the initial experiments.
Declaration of Competing Interest
The authors declare that they have no known competing financial interests or personal relationships that could have appeared to influence the work reported in this paper.
Acknowledgments
The authors sincerely acknowledge financial support from the National Natural Science Foundation of China (Nos. 52004137,52121003, 51727807, 12032013 and 11972209) and Fundamental Research Funds for the Central Universities (No. 2022XJAQ01).
杂志排行

Theoretical & Applied Mechanics Letters的其它文章
- Generalized boundary dilatation flux on a flexible wall
- Fourier neural operator approach to large eddy simulation of three-dimensional turbulence
- Elastoplastic constitutive modeling under the complex loading driven by GRU and small-amount data
- Numerical simulation of laser ultrasonic detection of the surface microdefects on laser powder bed fusion additive manufactured 316L stainless steel
- Sedimentation motion of sand particles in moving water (I): The resistance on a small sphere moving in non-uniform flow☆,☆☆
- Predicting solutions of the Lotka-Volterra equation using hybrid deep network