Soil phosphorus fractions and their availability over natural succession from clear-cut of a mixed broadleaved and Korean pine forest in northeast China
2022-02-26PengYuXinZhangHuiyanGuJianpingPanXiangweiChen
Peng Yu · Xin Zhang,2 · Huiyan Gu · Jianping Pan · Xiangwei Chen
Abstract To assess phosphorus (P) status of forest soil under naturally restored vegetation, P fractions in the 10-cm soil layer were quantified at different successional stages on the clear-cut site of mixed broadleaved and Korean pine forest.Four communities of shrub, softwood broad-leaved forest, softwood and hardwood broad-leaved forest, and hardwood broad-leaved forest represented different successional stages.A soil sample from a primary broad-leaved and Korean pine stand was the control.A sequential P fractionation scheme extracted empirically defined pools of P and path analysis used to partition the direct and indirect contribution of soil P fractions to available P.The results show that available P increased significantly with long-term succession, while both sodium bicarbonate-extractable P (NaHCO3-P) and sodium hydroxide-extractable P (NaOHP) fractions were reduced in early successional stages and increased in late stages.Compared to the primary forest, concentrations of P fractions in the four stages significantly decreased except for HCl-P, indicating that soil P supplements over the long-term did not return to primary forest levels.The results of related analysis also showed that NaHCO3-Pi levels were significantly related to available phosphorus.According to the path analysis coeffi-cient, NaHCO3-Pi exhibited the highest effect on available P among eight P fractions; the indirect effects of other P fractions via NaHCO3-Pi were larger than those with other P fractions.Overall, this study suggests that soil P bioavailability gradually improved during natural vegetation restoration on clear-cut sites mainly through the increase of NaHCO3-P, where phosphorous is immediately available, and subsequently available phosphorus NaOH-P.
Keywords Vegetation succession · Available phosphorus · Phosphorus fractions · Correlation analysis · Path analysis
Introduction
Phosphorus (P) is one of the limiting nutrients for plant growth and soil is the major source of P in forest ecosystems (Missong et al.2018).Due to changes of plant species composition and coverage, revegetation of degraded lands has a profound impact on soil functions and quality, including litter input and root architecture (Guo et al.2018), thereby resulting in different levels of P availability.Different phosphorous forms vary considerably in their availability to plants (Zhang et al.2020), and quantifying the effects of plants on P fractions may provide a better understanding of soil P bioavailability and cycling (Fu et al.2020).However, few studies that have focused on the relation between soil P and vegetative changes in forest ecosystems (Garay et al.2018), especially how vegetation restoration may affect soil P dynamics which in turn affects P bioavailability for plant uptake.
The mixed-broadleaved and Korean pine (Pinus koraiensisSieb.et Zucc.) forests (MBKPF) represent the climax vegetation type of the eastern mountains of northeast China (Shi et al.2016).However, due to intensive timber extraction, often by clear-cutting, these forests have decreased dramatically since the 1900s (Feng et al.2007; Yu et al.2019).However, considerable efforts have been made recently to restore and protect these forests (Sun et al.2016).Afforestation is the principal way of site restoration; most tree species are coniferous such asP.koraiensis,Larix gmelinii(Rupr.) Kuzen,Pinus sylvestrisvar.mongolica, andPicea asperataMast..In addition, a series of major thinnings and regeneration in these forests are effective management measures and key to improve resource benefits, adjust forest structure, and improve forest quality.Temperature, light, water, air, and heat can be redistributed to changes in physical, chemical, and microbial characteristics of soils during the vegetation restoration process (Wang et al.2018).To date, considerable research has been carried out on functional plant trait composition (Gong et al.2020), rhizospheric and heterotrophic respiration (Shi et al.2015), overstorey leaf area index estimation (Qi et al.2014), and tree diversity changes (Jin et al.2007) related to restoration of Korean pine.Less attention has been paid to soil phosphorous dynamics under natural vegetation restoration in the long-term perspective.
To address this, soil P fractions were quantified under different stages of natural succession from clear-cutting through the “space-for-time” substitution.The objectives of this study were: (1) to examine the changes in phosphorous levels and availability during successional stages; and, (2) to assess the contributions of phosphorous fractions using path analysis.
Materials and methods
Study site
Liangshui National Nature Reserve (40°15′-50°20′ N and 126°-135°30′ E) in Heilongjiang Province is the location of the study.The total area of the reserve is 12133 ha, with 1.88 million m3growing stock and an average canopy cover of 98%.The mixed broadleaved-Korean pine forest as a primary forest accounts for 63.7% and 77.4% of the forested area and standing tree volume in the whole reserve, respectively, and has not been disturbed for more than 150 years.Dominant vegetation is temperate coniferous and broadleaved mixed forests established by the combined effects of community successions.Populus davidianaandBetula platyphyllaSuk.are the major softwood broad-leaved species;Fraxinus mandshuricaRupr.,Juglans mandshuricaMaxim.,Phellodendron amurenseRupr.,Tilia amurensisRupr.andAcer monoMaxim.are the major hardwood broad-leaved species (Shi et al.2016).The typical climate istemperate continental monsoon with-0.3 °C mean annual temperature, 676 mm precipitation (10-20% derived from snowfall), and 100-120 d frost-free period (Han et al.2020).According to Chinese soil classification, the soil is darkbrown forest soil, equivalent to Humaquepts or Cryoboralfs in the US soil classification system (Soil Survey Staff 1999).
The primary forests in the region were felled at a large scale since 1950s.The natural vegetation restoration was then conducted on cutting areas without any management.These mixed-broadleaved and Korean pine forests begin with pioneer species such asP.davidiana,Quercus mongolicaFisch,B.platyphyllaandL.gmelinii, then succeeds to broadleaved species such asP.amurense,Quercus mongolica,Betula costata,A.mono,T.amurensis,J.mandshurica,Ulmus davidianaPlanch.var.japonica(Rehd.) Nakai, andF.mandshurica.Communities will reach a relatively static stage dominated by Korean pine 250-300 years old (Chen and Li 2004).
Due to the long succession periods, “space-for-time” substitution was selected to study soil P fractions under different stages of succession from clear-cutting.“Space-for-time” substitution is a method to understand the impact of forest conversion on ecosystem characteristics and processes.The community types which formed in different locations with the same site conditions and at different successional stages were selected to replace the community types formed in the same location and experienced different periods.The study areas were divided into four natural successional stages: shrub (S) in the initial phase, and then softwood broadleaved species (F1), softwood and hardwood broad-leaved species (F2), hardwood broad-leaved species (F3) at the last stage, according to the proportion of pioneer species andP.koraiensis.Primary broad-leaved Korean pine forest (Fp) was considered the control (CK).Pioneer species are species which first colonize site with strong regeneration and competitiveness (Li 2019).They are ecological measures, represented byB.platyphyllaandP.davidianawith vegetation succession from the clear-cut of mixed broadleaved and Korean pine forest.The percentage of dominant species is determined according to the ratio of tree volume of each species to the standing volume in the area.The shrub (S) stage developed about 10 years after the original forest was clearcut in 2007, andCorylus mandshuricaMaxim.is the dominant species.The F1stage of softwood species is approximately 22 years old and has developed from the shrub stage after the original forest was cleared cut in 1995 and the dominant species are 60%B.platyphylla, 30% ofP.davidiana, and the balanceF.mandshurica.The F2stage, a mix of softwoods and hardwoods, is approximately 45 years old and developed from an F1stage after the original forest was clearcut in 1972, and the dominant species are 40%F.mandshurica, 30%B.platyphylla, 10%P.koraiensis, 10%P.amurense, and a few individuals ofUlmus japonica.The F3stage, which is all hardwood species, is about 60 years old and has developed from the F2stage after the original forest was clear cut in 1957.The dominant species are 50%F.mandshurica, 20%P.koraiensis, 20%P.amurense, 10%B.platyphylla, and a few individuals ofB.costata.The Fpor primary stage has been undisturbed for more than 150 years and the dominant species are 60%P.koraiensis, 20%B.costata, 10%Acer momoMaxim, and a few individuals ofB.platyphylla,U.davidianaPlanch.var.japonica(Rehd.) Nakai, andP.davidiana.During succession processes, each stage mainly relies on natural regeneration without management measures.
Soil sampling
The study began in June 2017.The horizontal distance between sites was within 500 m, and all sites were on the same site conditions, including slope and micro topography.Three 600 m2(30 m × 20 m) plots were established in each successional stage, and the horizontal distance between plots was kept to 100 m.Species with diameter at breast height (DBH) > 1 cm were counted and height and DBH measured (He et al.2013).Slope aspect and slope gradient, altitude, canopy coverage were recorded (He et al.2013).In each plot, a five-point sampling method (Yang and Chen 2016) was used to collect soil samples using an auger at a depth of 10 cm.Each successional stage sites contained 15 samples, for a total of 60 soil samples.Soil sampled from the same successional stage was mixed in equal amounts into one composite sample, air-dried at room temperature, sieved through a 2-mm, for chemical properties and P fraction analysis.
Soil sampling analysis
Phosphorus fractions
The Hedley et al.(1982) sequential fractionation method, as modified by Tiessen and Moir (1993), was used to fractionate soil P.This method uses a sequence of increasingly strong extractants that removed labile inorganic phosphorus (Pi) and organic phosphorus (Po) forms first, and then stable P forms (Sui et al.1999).A 1-g sample of each soil was placed into a 50-mL centrifuge plastic tube and extracted with the following extractants in sequential order: (1) 30 mL deionized water to extract fairly labile Pi(mobile P) that is directly exchangeable with the soil solution; (2) 30 mL 0.5 mol L-1sodium bicarbonate (NaHCO3, pH 8.5) which extracts relatively labile Piand Poabsorbed onto soil surfaces, plus a small amount of microbial P; (3) 30 mL 0.1 mol L-1sodium hydroxide (NaOH) to extract amorphous and some crystalline Fe and Al phosphates, as well as P strongly bound by chemisorption to Fe and Al compounds; and, (4) 30 mL 1 mol L-1hydrochloric acid (HCl), which extracts relatively insoluble Ca-P minerals including apatite, Al-P and Fe-P in more weathered soils.After every addition of extractant, samples were placed in a reciprocal shaker for 16 h, and the extracts then centrifuged to separate the supernatant, followed by filtration through Whatman 42 filter paper for P analysis.Finally, soil residues were digested using concentrated sulfuric acid (H2SO4) and 30% hydrogen peroxide (H2O2) to extract more chemically stable Poforms and relatively insoluble Piforms (Residual-P).Total P in NaHCO3, NaOH, and HCl extracts was determined after digesting aliquots with H2SO4-H2O2.Organic P in these extracts was calculated as the difference between total P and inorganic P.The inorganic and residual P concentration in all extracts was quantified by the blue molybdate-ascorbic acid method (Murphy and Riley 1962).
Therefore, eight phosphorous fractions were designated as H2O-Pi, NaHCO3-P (NaHCO3-Pi, NaHCO3-Po), NaOH-P (NaOH-Pi, NaOH-Po), HCl-P (HCl-Pi, HCl-Po), and Res-P.The total amount of P was calculated as the sum of these eight P fractions.Total inorganic P (Pi) was calculated as the sum of P in H2O-Pi, NaHCO3-Pi, NaOH-Pi, and HCl-Pifractions.Total organic P (Po) was defined as the sum of P in NaHCO3-Po, NaOH-Po, and HCl-Pofractions (Wang et al.2006; Guan et al.2013).The experiments were repeated for three times.
Other soil characteristics
Soil organic carbon (SOC) was measured using dry combustion by an elemental analyzer (Multi EA 400), and a conversion factor of 1.724 was used to calculate soil organic matter (SOM) (Chen 2005).After digestion with H2SO4+ HClO4, total P (Pt) was determined by the ascorbic acid-molybdophosphate blue method.Available P was extracted with 0.03 mol L-1NH4F-0.025 mol L-1HCl and measured.The P activation coefficient (PAC) is the ratio of available P to total P, which represents the degree of difficulty with which transformations between total P and available P occurs (Wu et al.2017).Soil pH was measured by the electrometric method using a suspension in deionized water (soil: water ratio of 1:2.5, w/v) (Han et al.2018).
Statistical analysis
One-way ANOVA were performed to examine the significance of differences in soil P fractions among different successional stages atP=0.05 level.Pearson correlation evaluated the relationships between P indicators and SOM.Path analysis partitioned the direct and indirect contribution of individual soil P fractions to available P (Hashimoto et al.2012; Tiecher et al.2018), which is a soil index that estimates P availability to plants.Despite only an index, available P has a strong relationship with P availability.An uncorrelated residue (Pe) that represents the unexplained part of an observed variable in the path model was calculated for both path analyses using Eq.1:
where,R2is the coefficient of determination of the multiple regression equation between available P and soil P fractions.All statistical analyses were performed using SPSS19.0.
Results
Total soil P and available P
Both concentrations of total P (Pt) and available P at all four successional stages were significantly lower than those at the Fp(primary) stage (Table 1).Comparing the different successional stages, total P (Pt) concentrations in the soils decreased in the early stages of succession (S, F1), and then increased by the late successional stages (F2, F3), and showed significant differences between different successional stages (P< 0.05).Ptwas significantly lower in the F1(softwoods) stage than in all other successional stages (P< 0.05).Available P levels increased with succession, but significantly increased in the late successional stages (F2, F3).
The P activation coefficient (PAC) is an important indicator of soil fertility, and a high coefficient indicates that more P will be available to promote plant growth.PAC was also significantly lower at any successional stage than at the Fpstage, indicating that less P with natural succession would be available to promote plant growth than that in the primary forest.With natural succession, PAC significantly increased in the early stages of succession (S, F1) (Table 2), and then tended stabilize in late successional stages (F2, F3).
P fractionation
Inorganic P fractions
All concentrations of H2O-Pi, NaHCO3-Piand NaOH-Pifractions in the four stages were significantly lower than those in the Fpprimary stage (Table 3) (P< 0.05).HCl-Piconcentrations in both F2and F3stages were significantly higher by 70.6% and 110.3% (P< 0.05), respectively, which could reach the level of the primary forest under long-term succession.With succession, concentrations of H2O-Piand HCl-Piincreased, while levels of NaHCO3-Piand NaOH-Pidecreased first and then increased, and were significantly lowest in the F1(softwoods) stage.
Total Piaccounted for 13.5-21.6% of the total P (Table 3).Among Pifractions, HCl-Pivalues, which represent P associated with Ca, had the lowest percentage of 0.4-1.2% of the total amount of P, followed by the more labile Pipool of H2O-Piand NaHCO3-Pi).NaOH-Piconcentration was the highest among the Pifractions, representing 7.0-12.2% of the total P.
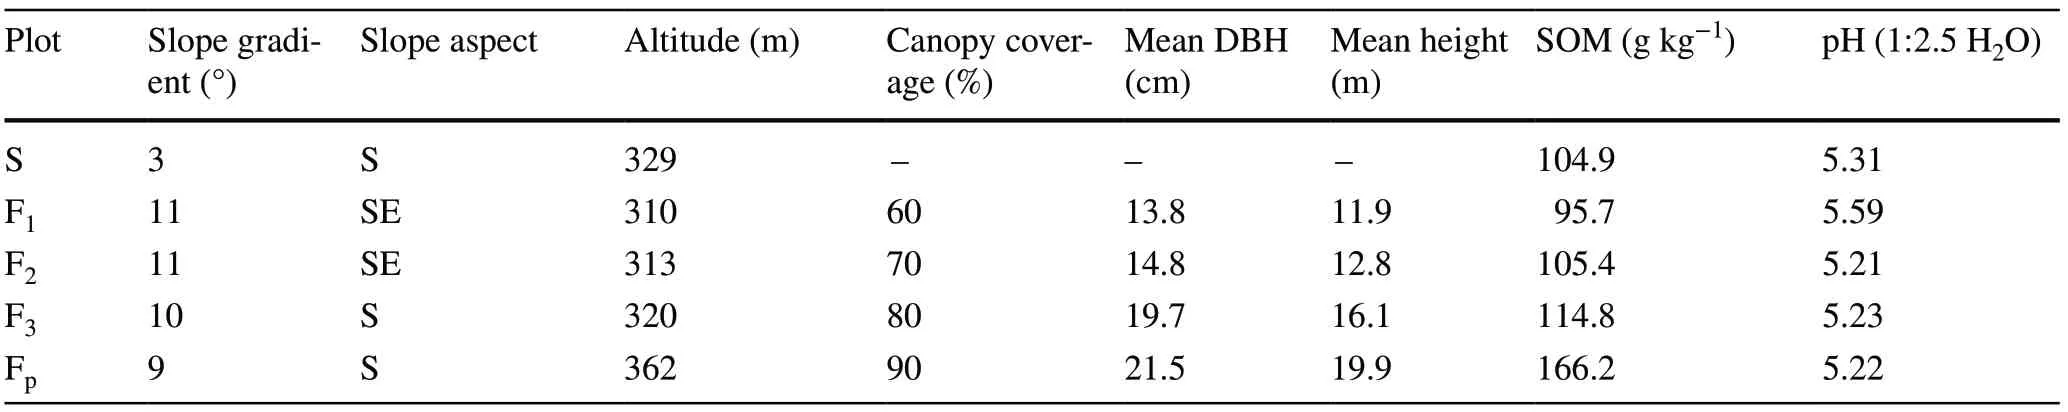
Table 1 Stand characteristics and basic soil properties at different successional stages
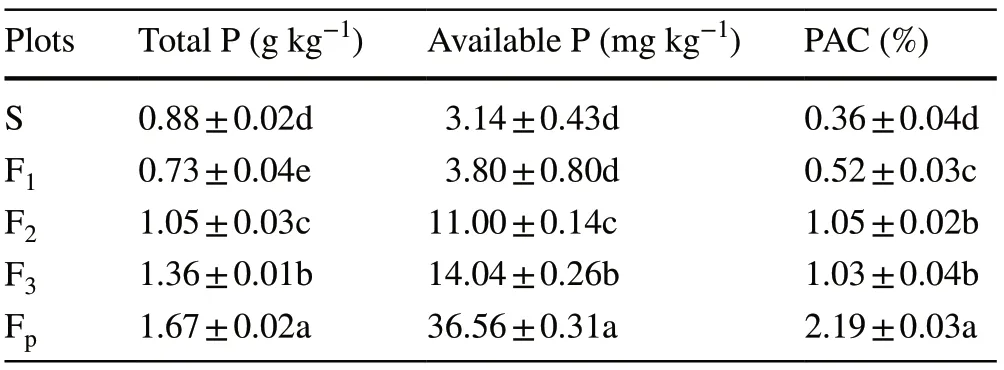
Table 2 Total soil and available P at different successional stages

Table 3 Soil P fraction at different successional stages (mg kg)Inorganic fractions(mg kg-1)Organic fractions(mg kg-1)Res-P (mg kg-1) Pi (mg kg-1)Po (mg kg-1)H2O-Pi NaHCO3-Pi NaOH-Pi HCl-Pi NaHCO3-Po NaOH-Po HCl-Po 7.25 ± 1.38d 45.21 ± 2.00d 96.31 ± 1.77c 3.80 ± 0.30e 131.53 ± 4.54b 370.85 ± 3.62d 38.33 ± 0.51ab 189.74 ± 20.01e 152.57 ± 2.53d 542.63 ± 5.04d 9.67 ± 1.32d 31.81 ± 3.79e 50.24 ± 3.75e 4.34 ± 1.50d 99.08 ± 8.72c 239.81 ± 9.06e 31.52 ± 6.63c 247.18 ± 16.52c 96.05 ± 5.61e 370.42 ± 16.41e 20.78 ± 2.57c 53.20 ± 2.06c 81.89 ± 7.60d 11.28 ± 0.90b 106.04 ± 1.70c 443.19 ± 14.72c 45.90 ± 7.32a 213.50 ± 14.79d 167.13 ± 7.61c 595.12 ± 24.99c 25.89 ± 2.87b 67.26 ± 0.94b 122.35 ± 2.99b 13.90 ± 0.38a 104.88 ± 3.27c 502.00 ± 24.33b 35.95 ± 3.50bc 317.33 ± 4.34b 229.39 ± 5.59b 642.83 ± 23.08b 31.68 ± 0.61a 107.17 ± 0.65a 189.39 ± 4.70a 6.61 ± 0.21c 199.03 ± 25.95a 613.09 ± 18.01a 37.33 ± 0.59abc 365.75 ± 3.36a 334.85 ± 5.05a 849.46 ± 21.28a-1 Values are means ± standard deviation.Different letters within a column indicate significantly different at P < 0.05 Plots SF1 F2 F3 Fp
Organic P fractions
Pofractions of NaHCO3-Poand NaOH-Poin each stage of succession were significantly lower than those at the Fpstage (Table 3).For HCl-Po, there was no significant difference between each successional stage and the Fpstage (P> 0.05).With succession, NaHCO3-Polevels at the S (shrub) stage were higher than at any other succession stage.NaOH-Poconcentrations showed a decreasing trend between the S and F1stages, and then increased significantly (P< 0.05).HCl-Polevels fluctuated and in the F2stage were higher than in all other successional stages.
Poconcentration accounted for 51.9-61.2% of the total P and first decreased, then increased with succession, and was the lowest in the F1stage (Table 3).In addition, there were significant differences between successional stages (P< 0.05).However, the Poconcentration in all stages was significantly lower than in the primary stage (P< 0.05).Among organic phosphorous fractions, NaOH-Poconcentration was the highest and accounted for 33.6-5.4% of the total P, followed by NaHCO3-Po.HCl-Poconcentration was the lowest among the Pofractions.
Res-P fraction.
The Res-P represented between 21.5% and 34.9% of the total P.It was significantly higher in each successional stage compared to the shrub stage (P< 0.05), and higher in the F2stage (softwoods and hardwoods) than the other stages.
Relationships between different P fractions.
Significant correlations were found between different P fractions except for HCl-P and Res-P (Table 4), and the highest correlation was between NaHCO3-Piand NaOH-Pi.In addition, available P was significantly correlated with P fractions (P< 0.05) except for HCl-P, and NaHCO3-Pishowed the highest correlation.This could indicate that any change in individual P fractions would cause a fluctuation in available P.SOM was also significantly correlated with various P fractions (P< 0.05) except for HCl-P.
Relative contribution of each P fraction to available P
NaHCO3-Pi, NaOH-Piand NaOH-Powere retained through variable culling, indicating that they were the more significant fractions affecting available P (Table 5).NaHCO3-Pihad the highest direct effect on available P (P< 0.05) among the eight P fractions.For NaOH-Pi, the correlation between NaOH-Piand available P was mostly partitioned to the indirect effect by NaHCO3-Pi.Similar to NaOH-Pi, NaOH-Poeffect was also through NaHCO3-Piand played the most crucial direct and indirect role on P availability.
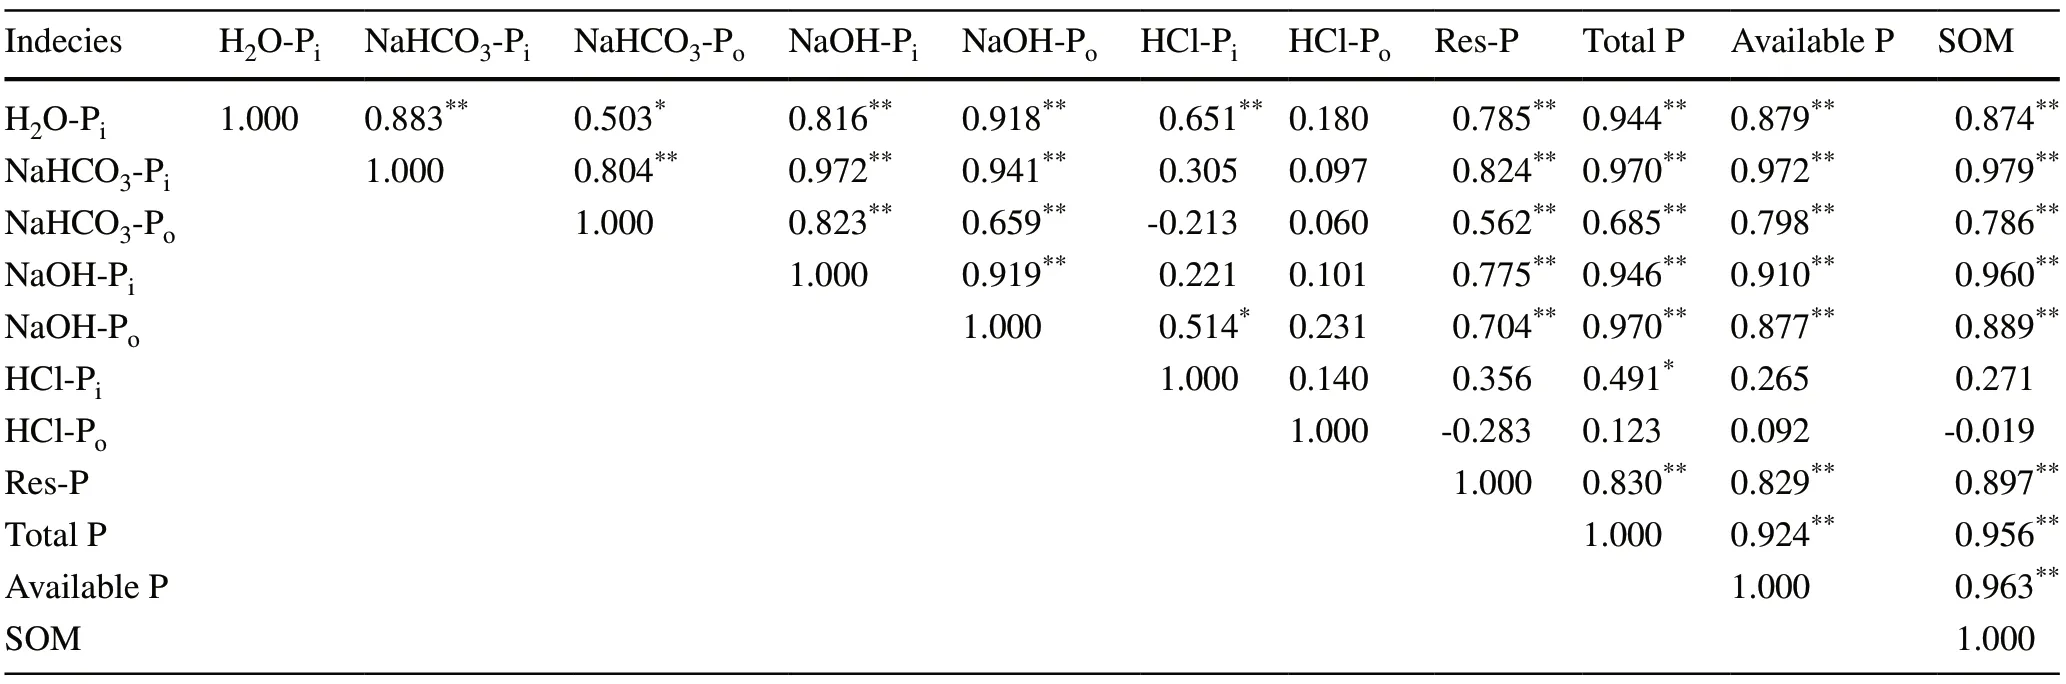
Table 4 Relation between P indicators and SOM
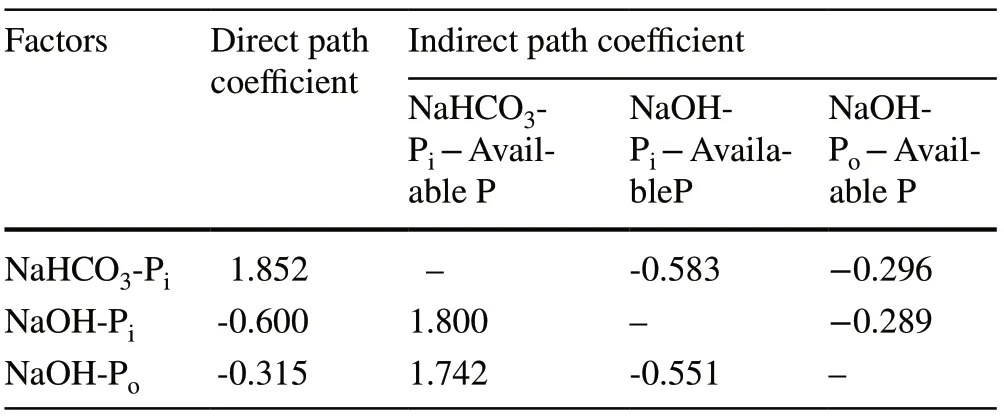
Table 5 Path coefficient of soil P fractions on available P
Discussion
Total phosphorous decreased initially in early successional stages, and increased in later stages (Table 2).Zhang et al.(2016) also reported similar findings for three tropical forests at different stages of succession in the Dinghushan Biosphere Reserve.Lower total P in F1stage could be due to plant uptake: the soft broad-leaved forest (F1) would take up more P than shrubs (S) (Tang et al.2011).As successional stages progressed, levels of total P increased because leaf and root biomass added to the soil to increase organic matter (Prakash et al.2018).
Available P represents short-term availability and is dependent on soil P fractions (Chen et al.2016).This study also found that available P was related to P fractions (Table 4), confirming that they contributed to the available P.Due to different availabilities of each P fraction, significant differences existed for their contribution to available P.The fractions of NaHCO3-Pi, NaOH-Piand NaOH-Powere the more significant affecting available P in this study.These three P fractions first decreased in early successional stages (S, F1), and then increased in later stages (Table 2).These changes in P fractions could be attributed to uptake by vegetation (Zhang et al.2016).Due to their fast-growing characteristics, nutrient uptake by pioneer species was significant, lowering P fraction levels in the early successional stages (Li et al.2007).Another possible mechanism underlying the increase in the NaOH-Pofraction might be the higher input of litter in late succession to increase input of SOM (Maranguit et al.2017).In addition, pH in early successional stages were higher than in late stages (Table 1), and a decline in pH may lead toan increase in the P bounding to aluminum/iron minerals (Zhang et al.2016).NaOH-Polevels were more than 64.7% of the total organic phosphorus and the most important source of soil organic phosphorus.With natural succession, the litter contributed to a large accumulation of soluble organic phosphorus on the soil surface under the leaching action of rainfall, and was quickly fixed by Fe and Al ions so that the content of NaOH-Pogradually increased (Smith et al.1998).Overall, the P fractions of NaHCO3-Pi, NaOH-Piand NaOH-Powere a potential source of P under natural vegetation restoration in the clear-cutting site.
Total Poincreased with natural succession, which could be mainly due to the accumulation of more soil organic matter (Table 1).Soil organic matter can contain substantial quantities of P, resulting in organic phosphorous accumulation (Zhang et al.2016).This is supported by the fact that both total soil Poand SOM reduced first in the shrub and softwood stages (S, F1), and then increased in late successional stages.
Conclusion
NaOH-Poof soil P speciation was dominant from natural succession on the clear-cut site of mixed broadleaved and Korean pine forest, acting as store of organic phosphorous and the main source of labile phosphorous in successional stages.Compared to earlier successional stages, P fractions were greater in the late successional stages, especially in the F3(hardwoods) stage.The positive relationships between P fractions and soil organic matter suggests that organic matter helps maintain high levels of P fractions during succession.Path analysis revealed that NaHCO3-Pi, NaOH-Piand NaOH-Pocontributed to available P through both direct and indirect effects, acting as the more effective source of phosphorous, which contributed to available phosphorus to improve bioavailability.
杂志排行
Journal of Forestry Research的其它文章
- A novel NIRS modelling method with OPLS-SPA and MIX-PLS for timber evaluation
- The dissemination of relevant information on wildlife utilization and its connection with the illegal trade in wildlife
- Endangered lowland oak forest steppe remnants keep unique bird species richness in Central Hungary
- The distribution patterns and temporal dynamics of carabid beetles (Coleoptera: Carabidae) in the forests of Jiaohe, Jilin Province, China
- The disease resistance potential of Trichoderma asperellum T-Pa2 isolated from Phellodendron amurense rhizosphere soil
- Genotype-environment interaction in Cordia trichotoma (Vell.) Arráb.Ex Steud.progenies in two different soil conditions