Genotype-environment interaction in Cordia trichotoma (Vell.) Arráb.Ex Steud.progenies in two different soil conditions
2022-02-26WanderleydosSantosBrunoMarchettideSouzaDanieleFernandaZulianGilbertoTerraRibeiroAlvesJoBoscoVasconcellosGomesrioLuizTeixeiradeMoraesValderAparecidadeSousaAnandaVirginiadeAguiar
Wanderley dos Santos · Bruno Marchetti de Souza · Daniele Fernanda Zulian · Gilberto Terra Ribeiro Alves · João Bosco Vasconcellos Gomes · Mário Luiz Teixeira de Moraes · Valderês Aparecida de Sousa · Ananda Virginia de Aguiar
Abstract Investment in silvicultural techniques is noticeably lacking, especially in breeding programs for non-conventional wood species.Studying genotype × environment interaction (G × E) is essential to the development of breeding programs.Thus, this study aimed to estimate genetic diversity of and the effects of G × E interaction on two progeny tests of Cordia trichotoma, including the estimation of genetic gain and genetic diversity after selection.For the experiment, 30 progenies of C.trichotoma were tested at two sites with differing soil textures.Diameter at breast height (1.30 m above soil surface, dbh-cm), total height, diameter at 30 cm from the soil, first branch height, and survival were all monitored for four years.Statistical deviance, best linear unbiased estimator, and harmonic mean of relative performance of genetic values (MHPRVG) were all calculated to predict breeding values, estimate genetic parameters, and analyze deviance.All quantifeid traits varied significantly among progenies by soil type, with greatest variation recorded for genetic variability.Heritability of the progenies led to predictions of genetic gain, ranging from 7.73 to 15.45%, for dbh at four years of age.The calculated decrease in genetic diversity after selection showed that this parameter should be monitored in subsequent breeding cycles.G × E was low for all tests.The best-performing progenies proved most stable and best adapted to the different environmental conditions tested.
Keywords Effective population number · Native species · Productivity · Stability and adaptability · Tree improvement
Introduction
Native species are less used for logging purposes when compared to exotic species in most countries.In Brazil, the market for planted trees accounts for 91% of the whole wood produced for industrial purposes, and the remaining 9% comes from legally managed native forests (Ibá 2015).Even native species with promising economic potential, such asCordia trichotoma, are marginally competitive in current timber markets.Investment in conventional timber species and participatory breeding programs for non-conventional timber species are noticeably lacking.The expansion of plantations for non-conventional timber species has been limited by the lack of information on management and forestry technology.The planting of these species in Brazil is discouraged by the scarcity of silvicultural information about native species, such as origin of seed, seed and seedling production, plant population density, planting conditions (shadow or light), growth rates, arrangement of species, management activities (thinning, pruning, and cutting cycle length), pest control, and wood characteristics (Rolim et al.2019).
The establishment of experimental trials with adequate environmental controls is one of the first steps to evaluate the production and genetic potential of tree species.Such trials can increase the feasibility of introducing more competitive genotypes to the planting systems.Cordia trichotoma(Vell.) Arrabida, known as “louro pardo”, is a Brazilian native species used in forest plantations for both silvopastoral and agroforestry systems.It is used in single-species commercial plantations as well.The economic potential ofC.trichotomais reflected in its potential total height of 35 m and potential girth of 100 cm of dbh (Brack and Grings 2011).However, this species is not planted on a large scale owing to the scarcity of seed and seedlings of high genetic quality and the lack of silvicultural techniques.In order to increase the productivity of individuals of this species, investment in breeding programs should be made.Genetic and phenotypic characterizations are extremely important to decide which seed donors will contribute to the next generation of improved plants.From progeny tests, it is possible to evaluate genetic parameters essential to guide successive selection cycles in breeding programs (Wricke and Weber 2010).
Progeny trials are used to assess potential future economic benefit of a given species.Results of trials enable accurate characterization of genetic diversity of breeding populations and inform selection of individuals or strains yielding superior performance.When genetic diversity is properly utilized in a population, it allows both genetic conservation and genetic gain in future generations (Tambarussi et al.2018).
In a breeding program, the base population should show genetic variability and average values for the target traits to be improved (Negreiros et al.2013).Controlled crossing of strains can yield genetic combinations that result in higher productivity.This can result from heterosis, or insertion of new genotypes or backcrosses to recover superior genotypes (Manfio et al.2012).Some variables can influence estimates of genetic parameters and, hence, genetic gain in a population.Genotype × environment interaction (G × E) is one such variable.G × E interactions represent qualitative or quantitative variations in phenotypic expression of genotypes (Gezan et al.2017).This occurs when the same genotypes differ in their responses to varied environmental conditions (de Leon et al.2016).Productivity is one variable that is affected by environmental conditions.G × E interactions can dictate the order of genotype rankings for best performance, according to each environment (Meyer 2009).Interactions occurring within genotypes could also be attributed to environmental features, such as soil type, climate, day length, isolation degree and competition for water and light (Sae-Lim et al.2016).G × E studies in breeding programs are necessary to quantify the magnitude and significance of the effects on phenotype expression, providing guidelines for either adopting strategies to reduce impacts or take advantage of them (Burdon and Li 2019).In this context, we aimed to (1) characterize the genetic variability of two progeny tests ofC.trichotoma; (2) estimate genetic gain, genetic diversity and effective population size after different selection intensities; (3) estimate the genetic and phenotypic correlation among quantitative traits; and (4) estimate genotype × environment interaction in areas with two different soil textures, as well as the productivity, adaptability, and stability of the genotypes.
Material and methods
Study area
Two progeny tests were established in the municipality of Linhares, state of Espírito Santo, Brazil.Seeds of 30 open-pollinatedC.trichotomamatrices were collected from the Reserva Natural Vale and from small forest fragments located between the municipalities of Sooretama (19°11′22.91" S, 40° 5′50.48" W) and Linhares (19°23′40.71" S, 40° 3′51.40" W) in Brazil.The Sooretama climate is classified as tropical rainforest climate according to the Köppen-Geiger climate classification, with warm and dry winters.Average rainfall is 1,200 mm year-1, and average temperature is 23.4 °C.The local topography is 95% flat.
A total of 30C.trichotomaprogenies were planted in a multiple cropping system with 30Dalbergia nigraprogenies from the same provenance.The species were arranged in linear alternate lines.The experimental design for both tests was randomized blocks, one tree per plot.The spacing between trees of the two species was 3.0 m × 3.0 m and between the same species 6.0 m × 6.0 m.For the first test (area 1) 40 repetitions were used, and for the second (area 2), 34 repetitions.Area 1 had sandy soil texture, and area 2 had clay soil texture.
Quantitative traits
Trees from both areas were evaluated relative to diameter at breast height (1.30 m above soil surface, dbh-cm), diameter at 30 cm above soil surface (DC-cm), plant height (H-m), first twig height (HFT-m) and survival (S-%).The evaluations were carried out over the first four years after plantation (2013=H, S; 2014=DC, H, HFT, S; 2015=dbh, H, HFT, S; 2016=dbh, H, HFT, S).dbh and DC were measured with a measuring tape.H was measured with a hypsometer and HFT with a ruler.
Statistical analysis
Individual analysis and estimation of genetic parameters
To verify progeny differences, deviance analysis was performed.The components of variance and genetic parameters were estimated by the REML/BLUP method using SELEGEN-REML/BLUP software (Resende 2016).The openpollinated progeny tests (half-sibs) were evaluated in a randomized block design, one tree per plot, one site, and a single population as Eq.(1):

where y is the data vector, r is the vector of the repetition effects (assumed as fixed) added to the general mean, a is the vector of individual additive genetic effects (assumed as random), and e is the vector of errors or residuals (random).Uppercase letters represent the incidence matrixes for these effects.The narrow-sense heritability was estimated as Eq.(2):
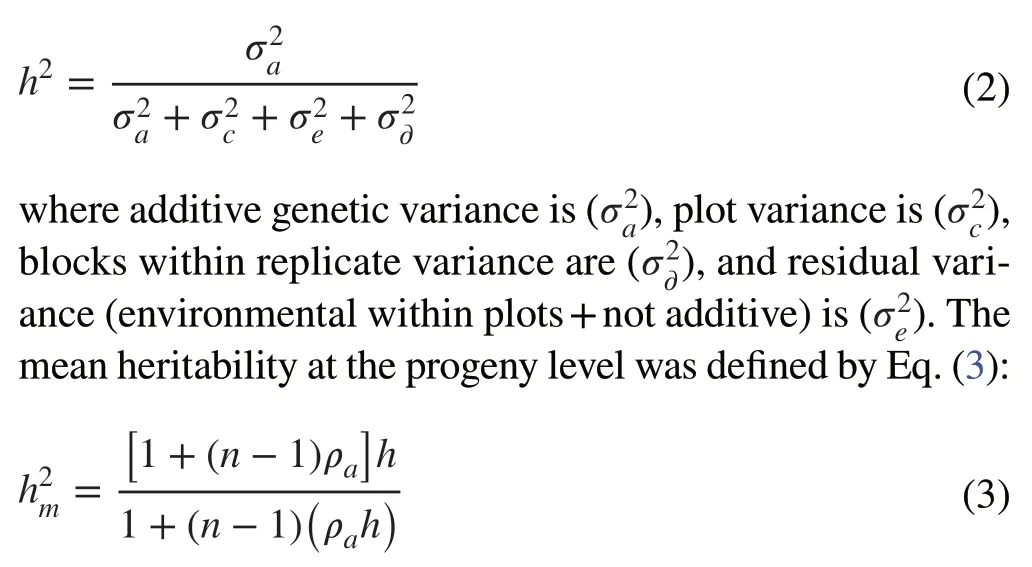
where ρais the additive genetic correlation interclass between individuals of considered progeny type (half-sibs), and n is the number of trees per progeny.
Genetic and phenotypic correlations
Age-age and trait-trait genetic and phenotypic correlations were estimated, and early selection was applied in next generations.These analyses were performed with SELEGEN®-REML/BLUP software (Resende 2016).Standard errors and significance for genetic and phenotypic correlations were estimated using GENES® software (Cruz 2013).Plots of associations between variables were drawn using R software (R Team 2013).
Genetic diversity, effective population size and expected gain with selection
In order to select genotypes and progenies, different selection scenarios (intensities) were simulated using individual additive genetic value ranking to maximize genetic diversity in a population, reduce inbreeding, and maximize genetic gains for the next breeding cycle.The intensities were: 2.5%, 5%, 7%, %, 10%, 12.%, 15%, 17.5%, and 20%, corresponding to 21, 42, 63, 84, 105, 125, 145, and 167 individuals for area 1 and 20, 40, 59, 79, 98, 118, 137, and 155 individuals for area 2.Dbh in 2016 was the trait considered in the selection.The genetic gain was estimated as percentage by Eq.(4):
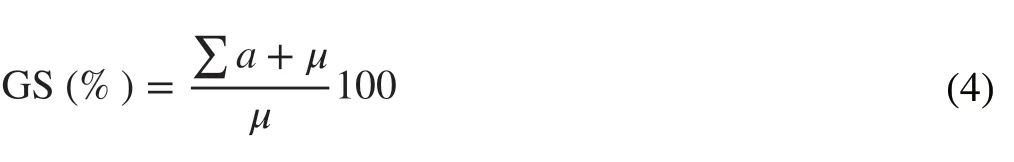
where a corresponds to the additive genetic value of the selected individual, and μ corresponds to the dbh-2016 phenotypic average.Effective population size (Ne) was estimated based on Resende (2002).Genetic diversity (D), after selection, was quantified according to Wei and Lindgren (1996).
Productivity, stability and adaptability analysis
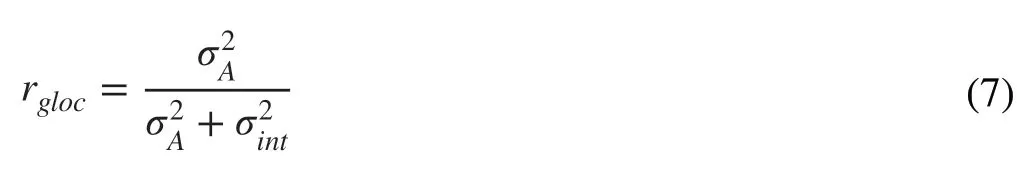
G × E interaction was analyzed for both sites using MHPRVG (harmonic mean of relative performance of genetic values), as predicted by BLUP (Resende 2016).The statistical-genetic model applied was calculated as Eq.(5):

where y is the data vector, r is the repetition effects (assumed as fixed) vector added to the general mean, g is the genotypic effects (assumed to be random) vector, i is the interaction effects of genotypes × environments (random) vector, and e is the errors or residuals (random) vector.Uppercase letters represent the matrixes index for these effects.Vectorrrepresents all measures in all replicates in the various sites and adjusts simultaneously for all these effects and their interactions (Resende 2016).Determination coefficient from effects of G × E interaction was estimated by Eq.(6):

Genotypic correlation between progenies in different environments was estimated by Eq.(7).
for the evaluation of genetic stability, the harmonic mean of genotypic values (HMGV) method was used, and for the adaptability, the relative performance of genotypic values (PRGV) method was used.These evaluations were combined to estimate stability, adaptability and productivity using the method of harmonic means performance on genotypic values relative performance (HMPRGV).The procedure follows the expressions in Eq.(8), Eq.(9) and Eq.(10):


where l is the number of sites, VG is the genetic value, and j is the genotypes.
Results
Individual deviance and estimation of genetic parameters
Average height was very similar in both areas during the first year of planting (Table 1).For DC-2014, a difference of 0.61 cm was observed when comparing the values of the two areas.In 2015, the values obtained for dbh and H in progenies of area 1 were higher than those in area 2, with a growth difference of 1.21 cm and 0.49 cm for dbh and H, respectively.The survival in area 2 (91%) was higher than that observed in area 1 (83%) (Fig.1).
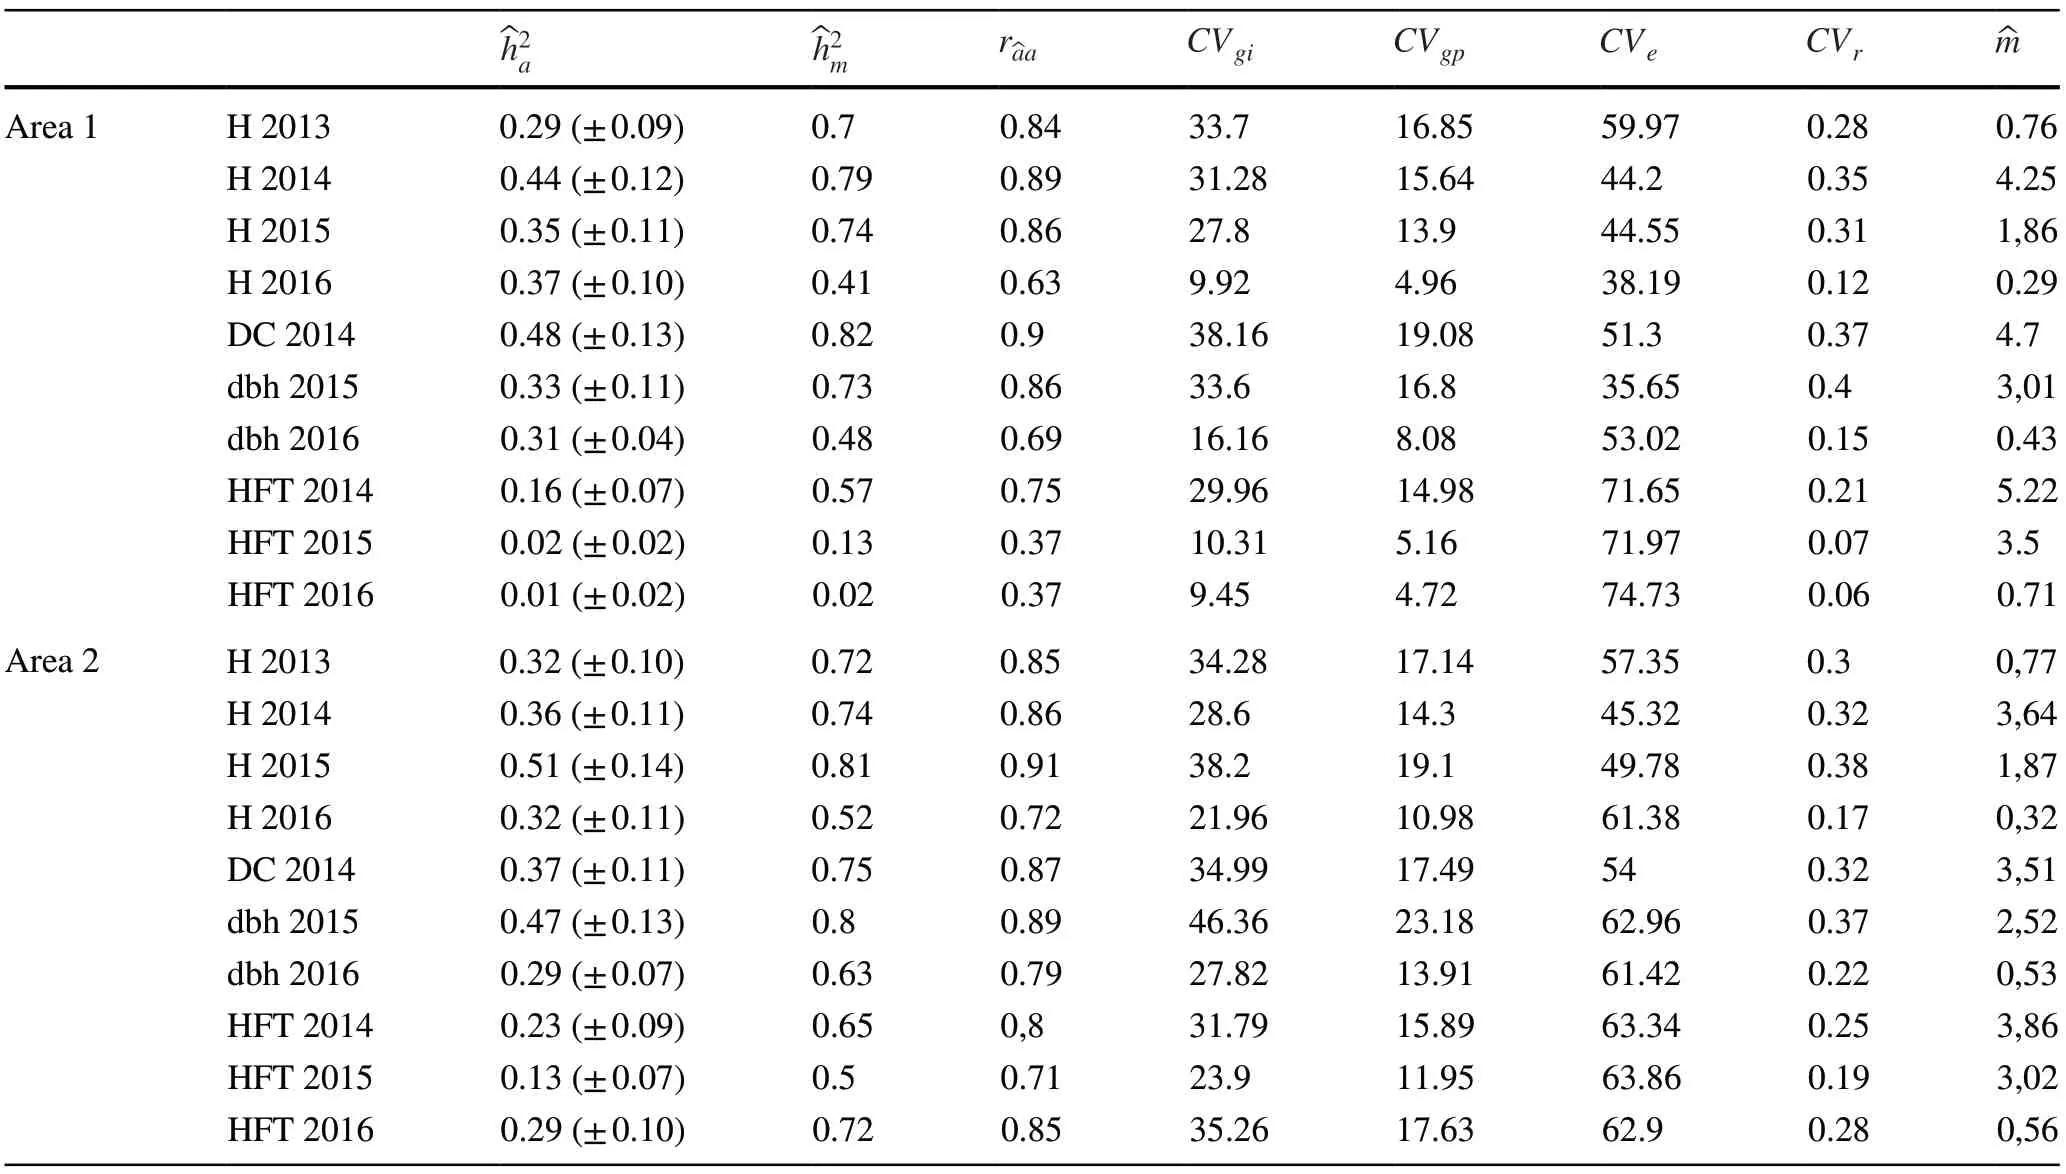
Table 1 Estimation of genetic parameters and mean for the diameter at 1.30 m from the soil (dbh-cm), diameter of collection at 30 cm from the soil (DC-cm), height of plant (H-m) and height of the first twig (HFT-m) in the progeny test of C.trichotoma

Fig.1 Survival rate (%) in C.trichotoma progenies for the two planting sites
Significant differences (p< 0.01) were observed among progenies for all quantitative traits evaluated in the two areas (Fig.2).This implies that the tested progenies can be used in breeding programs through direct or indirect selection.The genetic effect was not significant (p< 0.01) for survival during 2013 and 2014 in area 1.In contrast, in area 2, significant differences were observed in all years for this trait.

Fig.2 Likelihood ratio test (LRT) and significance levels based on the Chi-square deviance for growth and silvicultural traits: diameter at 1.30 m from the soil (dbh-cm), diameter of the collection at 30 cm from the soil (DC-cm), height of plant (H-m), height of the first twig (HFT-m) and survival (S-%) in C.trichotoma progenies
Genetic variation among progenies ( CVgp) ranged from 4.72% to 19.08% for HFT-2016 and DC-2014 in area 1.In area 2, CVgpranged from 10.98% to 23.18% for H-2016 and dbh-2015, respectively.Estimates of coefficient of individual genetic variation ( CVgi) ranged from 9.45% to 38.16% for HFT-2016 and DC-2014, respectively, in area 1 (Table 1).In area 2, CVgivaried from 21.96% to 46.36% for H-2016 and DBH-2015, respectively.
The coefficient of experimental variation ( CVr) was higher for HFT-2015 (71.97%) in area 1, but lower for H-2014 (45.32%), also in area 1.DBH-2015 and HFT-2015 presented high CVrvalues for both areas (0.40-area 1 and 0.07-area 2).Considering all CVrfor both progeny tests, the results show low and high estimates of accuracy (HFT-2015=0.37% area 1 and H-2015=0.91% area 2).High coefficients of variation suggest that the experimental data are subject to errors, despite the normal data distribution (Gonçalves et al.2003).
The additive genetic individual heritability and mean progeny heritability were high for all traits.The additive individual heritability ranged from 0.01 for HFT-2016 to 0.48 for DC-2014 in area 1.In the second area, the individual additive heritability ranged from 0.13 to 0.51 for HFT-2015 and H-2015.These same traits had the lowest and highest heritability values at the mean progeny level (0.02=HFT-2016 and 0.82=H-2015 in area 1; 0.50=HFT-2015 and 0.81=H-2015).
Estimates of genetic diversity, effective population size and expected genetic gains
Expected genetic gains for dbh at four years of age at both sites ranged from 5.72% to 15.45% (Table 2).The highest selection intensity (2.5%) shows a sharp reduction in the population effective size (7.15) and genetic diversity (0.09) in area 1 and area 2 ( Ne6.57 and D 0.08).
Estimates of genetic and phenotypic correlations
Estimates of genetic correlations demonstrate significant positive associations among all traits, except for HFT-2014 and DBH-2015 in area 2 (Fig.3).The highest value was observed between DBH-2016 and H-2015 in both areas (0.82 area 1; 0.93 area 2).HFT-2015 presents a negative association with H-2014 (-0.07) and DBH-2015 (-0.13).
Cassim was married to a rich wife and lived in plenty, while Ali Baba had to maintain his wife and children by cutting wood in a neighbouring forest and selling it in the town
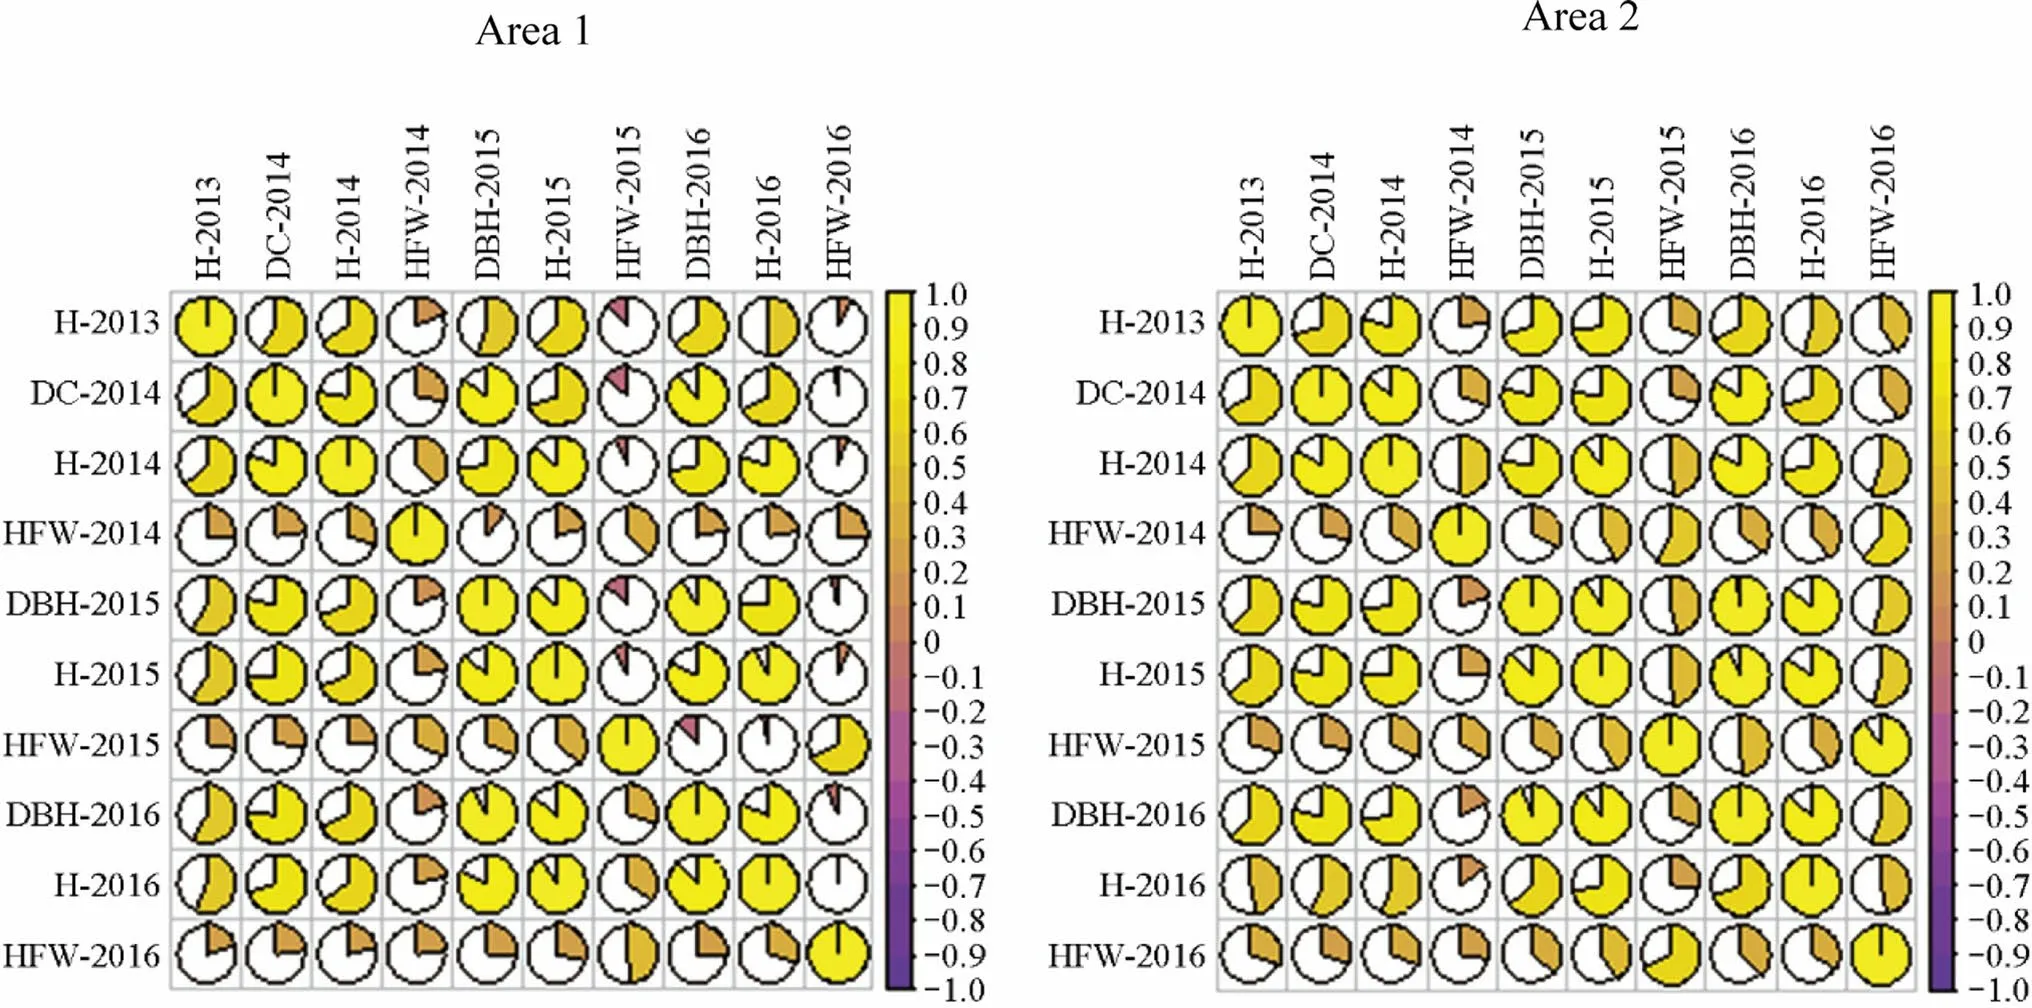
Fig.3 Estimation of genetic and phenotypic correlations (above diagonal and below diagonal) between the traits: diameter at 1.30 m from the soil (dbh-cm), diameter of the collection at 30 cm from the soil (DC-cm), height of plant (H-m) and height of the first twig (HFTm) in progeny test of C.trichotoma
G × E interaction based on DBH-2016 and H-2016
G × E interaction was not significant for DBH-2016 and H-2016 (Table 3).Individual heritabilitypresented lowmagnitude values for DBH-2016 (0.02) and H-2016 (0.02) (Table 3).Progeny heritabilitieswere high (0.58=H-2016 and 0.61=DBH-2016).These results show that most total variation is genetically controlled and contributes to high estimates of accuracy ( r^aa), considering the whole experimental area (0.76=H-2016; 0.78=DBH-2016).
The determination coefficients of G × E interactionpresented low values for all traits (0.01).Estimates of genotype correlation between progeny performance and environments ( rgloc) are high.This indicates that G × E interaction has low impact for those traits.The progeny averages of each site were 3.86 cm for area 1 and 5.21 for area 2.The top nineC.trichotomaprogenies (21, 30, 2, 15, 4, 28, 25, 19, and 17) showed no differences among them for stability (MHVG) and adaptability (PRVG) genotype rankings (Table 4).

Table 2 Individual selection gains ( GSI ) for dbh-cm in progeny test of C.trichotoma in 2016

Table 3 Estimates of genetic parameters and genotypes × environment interaction for growth traits (diameter at 1.30 m soil (DBH-2016) and plant height (H-2016)) in progeny test of C.trichotoma
For adaptability (PRVG), the most productive progeny rank coincided with 53% between the two areas.Considering the top nine progenies, the order for adaptability coincides with 100%.
Discussion
Genetic parameters
In general, the coefficients of experimental variation ( CVe) showed high values.Furthermore, the experimental model adopted, from one tree per plot, increased the accuracy of the genetic parameter estimates.Moreover, the model also facilitated the spatial arrangement of the plants in the selective thinning.This led to greater reliability in the estimationof genetic parameters (Storck et al.2014).On the other hand, this model tended to generate high coefficients of experimental variation in relation to the models of several plants per plot.Duarte (2007) recommends using this parameter to make inferences about the precision of the adopted experimental model.The author also recommends accuracy as the main precision parameter to be evaluated.
Resende and Duarte (2007) explain that accuracy is the better parameter for assessing the quality of statistical analysis.In order to make inferences about the selective accuracy in assays, Hill and Mulder (2010) reported the necessity of considering CVe, CVgi, and the number of repetitions.Following that precept, the accuracy of the present study is a good example.A proper number of repetitions should ensure the reliability of the estimates.
Individual heritabilities in the restricted sense and progeny heritability were high for all traits.Cornelius (1994) confirmed mean values of heritability as 0.16 and 0.21 for dbh and height on the basis of several published forestry studies.These values are much higher than those found for other cultivated Brazilian native species, such asEsquizolo biumparaybaandMyracrodruon urundeuva(Chinelato et al.2014; Pupin et al.2017).These parameters are even higher than those observed for other tropical species more widely disseminated, such asTectona grandis(Callister 2013).
Thus, selection based on progeny heritabilities would mean higher genetic gains (Roychowdhury and Tah 2011).Studying progenies ofJatropha curcasL., Spinelli et al.(2015) reported restricted heritability of 0.39 at 2 years and 0.31 at 3 years for height.Freitas et al.(2006) found that progeny heritabilities varied from 0.76 (dbh) to 0.12 (H) forC.trichotoma, a lower value than that found in this research.Genetic gains were higher at all levels for the progenies of area 2.This result was expected because area 2 had higher coefficients of variation, CVgpand CVgi, and individuals with performance above the general average.Establishing a seed orchard depends on continuity in the investigation of CVgp, CVgiandin adults since these parameters are in constant flux owing to climatic factors, age and individual survival.The genetic gains estimated for this population show similarity to other competitive tropical species.The values estimated for area 2 are higher than those estimated by da Costa et al.(2015) toT.grandis(6.5% in height).However, they are similar to those described toEsquizolobium amazonicum(20% in volume) (Rocha et al.2009).
Area 1 contributed more individuals per progeny, providing the highest number of individuals selected by progenyand highest estimate of the variance of the number of individuals selected by progeny, all contributing to the decrease of Ne.Neandvalues, which are evidently lower when compared to the lower selection intensity (20%).The drastic loss of genetic variability in a breeding program would affect the maintenance of the breeding population since it reduces population evolutionary potential (Santos et al.2016).However, if the main goal of the breeding program is to increase production, then this kind of concern doesn′t carry so much weight.
For the next breeding generation, lower selection intensity should be adopted to avoid excessive loss of genetic variability, especially in the first generation.Seeds of a greater number of matrices should be prioritized in future selections.The effective population size ( Ne), indicated as the selective threshold, is between 30 and 60 (Leonardeczneto et al.2003).According to Moreira et al.(2013) and do Nascimento (2012), in order to maintain genetic variability in each selection cycle, it is important to maintain an Nearound 50 to avoid the loss of variability and increase the likelihood of maintaining favorable alleles during the selection cycles.Following this protocol ensures that the genetic gain in continuous cycles will not be compromised.Therefore, to maintain Newithin the recommended numbers, the breeding process should select individuals of different progenies.That is, it is necessary to work with a larger number of individuals in order to guarantee a minimum Nethat will allow the maintenance of variability in the next stages of selection (Wang et al.2016).
The definition of selection intensity to be applied in each breeding cycle should be against loss of favorable alleles by genetic drift or inbreeding throughout the selection cycles.To accomplish this, it is recommended that the breeder base the selection process on the formula Neh to calculate an effective population number, where h is the square root of the heritability coefficient of the trait under selection (Cobb et al.2019).This formula could be applied to the selection intensity of 2.5% in area 2 where the value of Newas lower.Considering avalue of 0.29 for the DBH-2016 plants and Neof 6.57, the computation of the formula Neh would be 3.53.This outcome results from the low estimate of the effective population size.Resende (2002) used the Neh method for a population with a few degrees of genetic improvement, a selection intensity of 2%, and a heritability of 0.30 and reported 40 as the Neto be maintained.This number is higher than that obtained in the present study.A difficulty arises by not having a minimum and unique number of Neto serve as indicator for the intensity of selection in breeding programs because the fixation of favorable alleles along selective cycles is not provided by a sufficiently large Ne.The Nenumber also depends on the initial allele frequency and the selection coefficient(s) at each locus level (Aguiar 2009).As pointed out by Namkoong et al.(2012), if the breeder′s strategy is a long-term recurrent selection program, then the effective size should be high to avoid random loss of favorable alleles over the selective breeding cycles.Thus, the criterion of using Neh is better than just using Neas parameter.
The two progeny tests in this study came from seeds collected from 30 trees.This number should have been higher since the use of small samples for the implantation of progeny tests can result in accelerated loss of diversity.Rigorous selection cycles raise the inbreeding and genetic drift indexes.Subsequent reductions in the number of individuals induce the cross between related individuals, leading to a sharp increase of kinship in the population.Therefore, in the next cycles of genetic breeding, introducing new genotypes from commercial stands or natural populations is recommended (Govindaraj et al.2015).
Highly positive or negative genetic correlations imply that the same genes may be responsible for the two traits (pleiotropic) (Du et al.2019; Valenzuela et al.2019).Indirect selection may be more efficient in cases where the associations are high and significant.Positive associations between traits indicate that the selection in one trait can bring indirect gains to the other.High and significant genetic correlations were observed between DBH (2015) and H (2015) in area 1 and 2.These results indicate that the selection of the best individuals based on DBH will have a positive influence on height.The selection based on diameter, using the correlation information regarding height, would reduce the cost and errors caused by inaccurate height measurements, especially in future ages when the trees will be relatively higher.Mugasha et al.(2013) confirms that the genetic and phenotypic correlations between H and DBH in forest species are positive and of high magnitude.Therefore, selection can be performed in only one of the traits without detriment to the other trait.The values of genetic and phenotypic correlations had oscillations between the traits during the evaluated years.As for heritability, the genetic correlation between tree height and tree diameter can change according to the years of growth (Sumardi et al.2016).
Productivity, stability and adaptability
The high estimates of accuracy ( ra^a) in the joint analysis confirm the high genetic control and efficiency of a general selection considering all individuals in the experiment.The adoption of joint analysis to select superior genotypes would result in a precise and accurate selection process (Carvalho et al.2016).Low magnitude of G × E interaction indicates the predictability in the genotypes′ performance according to environmental features.This type of interaction is considered to be non-complex in nature (Heslot et al.2014).In this case, the genotypes′ ranking in different environments may be the same.The lower the standard deviation of genotype performance between environments, the higher the harmonic mean of the genotypic values between environments (MHVG) (Torres Filho et al.2017).This means that selection by MHVG implies both selection for productivity and stability (Gonçalves et al.2014).
The high genetic correlation between the two sites studied shows that the genotype with the best performance in one environment tends to be better in another environment.Resende (2005) reports how stratification in planting sites limits breeding areas.This allows G × E interaction to be discarded as an issue for selection.In these cases, without G × E interaction, a single selection could be satisfactory.
The values of MHPRVG showed superiority of genotype means in relation to the environment in which the tests were installed (Torres Filho et al.2017).Secure and precise predictions about genetic values can be obtained with this one selection method that integrates the criteria of productivity, stability, and adaptability.When comparing the top 15 progeny rankings, slight alterations in the order of progenies can be observed.The top 15 remain the same in all lists; they just change some positions, according to the ranking.These results show that the progenies with the highest production are also those that show more stable behavior and better adaptability, especially considering the top nine in the ranking in the two locations.Progenies, in general, had few alterations in ranking order.This stability comes from the high correlation between the progenies′ genetic values, as observed in the different environments for the evaluated traits (H-2016=0.82 and DBH-2016=0.72).This suggests that the MHVG, PRVG and MHPRVG methods offer almost the same genotype ordering.The use of these results as selection criteria leads to an improvement in the breeding procedures, considering more than only one area.They establish the safest predictions for genetic values by considering productivity, stability and adaptability simultaneously (Pagliarini et al.2016).Maia et al.(2009), Regitano Neto et al.(2013), Moiana et al.(2014) and Carvalho et al.(2016) all reported that the selection of cashew, rice and cotton genotypes, according to the MHVG, PRVG and MHPRVG, is favorable to crop development based on the results of genotype correlations among the studied sites ( rgloc).The stability and adaptability values point to the mean genotype value of the progenies at the two sites.The MHPRVG value is already discounted by instability and accounted for by adaptability (Carbonell et al.2007).
Zakir (2018) argues that investigations of environmental variations that interfere with G × E are important and necessary to identify stable genotypes that produce well under different conditions.Li et al.(2017) reviewed the influence of G × E on forestry species.The authors notice, in general, a significant impact of the interaction on growth traits.Studies with other species, such asPopulus davidiana(Koo et al.2007),Betulaspp.(Zhao et al.2014), as well asT.grandis(Goh et al.2013), corroborate this hypothesis.The matter that should be contemplated is whether enough difference exists between the two analyzed sites to promote a significant G × E.Kang (2002) explains that the G × E effect can only be detected in the presence of a considerable level of stress capable of producing an intense level of genotype responses.Many studies have shown climatic variables as the usual main driver of G × E (McDonald and Apiolaza 2009; Berlin et al.2015; Gapare et al.2015; Mohammadi et al.2015; Temesgen et al.2015).The two sites of this study are located in the same locality and, hence, exposed to the same climatic conditions.It is likely that the difference in soil texture was not sufficiently stressful to lead to a more distinguishable genotype response for each site.
Conclusions
We found genetic variation among theC.trichotomaprogenies for all quantitative traits in the two experimental areas.The average heritability shows that the trials can achieve high genetic gains through selection.The genotypes that present superior performance and high productivity should be used in the next generation of the breeding program.The wood productivity level, as well the genetic gain, point to the formation of clonal or seed orchards to increase the commercial use of the species.However, the introduction of new genotypes in further breeding cycles from commercial stands or natural populations is recommended.This process will minimize the loss of genetic diversity, maintaining a significantly effective population size in the breeding population.
Estimates of the genetic correlations obtained significant positive associations for most of the traits, suggesting good results in using indirect selection.No evidence for a complex genotype × environment interaction was found forCordia trichotomain the studied sites.The top-ranked progenies were almost the same, independent of environmental features.Therefore, considering the stability, adaptability and productivity criteria, progenies 21, 30, 2, 15, 4, 28, 25, 19, and 17 could be indicated for the studied range of sites.
AcknowledgementsThe authors thank the Coordenação de Aperfeiçoamento de Pessoal de Nível Superior (CAPES), Vale S.A., Embrapa Foresta Research Company, and the research technicians of the Project Biomas from Embrapa Forestas and FEIS-UNESP (Universidade Estadual Paulista “Júlio de Mesquita Filho” em Ilha Solteira).
杂志排行
Journal of Forestry Research的其它文章
- A novel NIRS modelling method with OPLS-SPA and MIX-PLS for timber evaluation
- The dissemination of relevant information on wildlife utilization and its connection with the illegal trade in wildlife
- Endangered lowland oak forest steppe remnants keep unique bird species richness in Central Hungary
- The distribution patterns and temporal dynamics of carabid beetles (Coleoptera: Carabidae) in the forests of Jiaohe, Jilin Province, China
- The disease resistance potential of Trichoderma asperellum T-Pa2 isolated from Phellodendron amurense rhizosphere soil
- Overexpression of the ThTPS gene enhanced salt and osmotic stress tolerance in Tamarix hispida