Measuring loblolly pine crowns with drone imagery through deep learning
2022-02-26XiongweiLouYanxiaoHuangLumingFangSiqiHuangHailiGaoLaibangYangYuhuiWenguaiHung
Xiongwei Lou · Yanxiao Huang · Luming Fang · Siqi Huang · Haili Gao · Laibang Yang · Yuhui Weng · I.-K.uai Hung
Abstract In modeling forest stand growth and yield, crown width, a measure for stand density, is among the parameters that allows for estimating stand timber volumes.However, accurately measuring tree crown size in the field, in particular for mature trees, is challenging.This study demonstrated a novel method of applying machine learning algorithms to aerial imagery acquired by an unmanned aerial vehicle (UAV) to identify tree crowns and their widths in two loblolly pine plantations in eastern Texas, USA.An ortho mosaic image derived from UAV-captured aerial photos was acquired for each plantation (a young stand before canopy closure, a mature stand with a closed canopy).For each site, the images were split into two subsets: one for training and one for validation purposes.Three widely used object detection methods in deep learning, the Faster region-based convolutional neural network (Faster R-CNN), You Only Look Once version 3 (YOLOv3), and single shot detection (SSD), were applied to the training data, respectively.Each was used to train the model for performing crown recognition and crown extraction.Each model output was evaluated using an independent test data set.All three models were successful in detecting tree crowns with an accuracy greater than 93%, except the Faster R-CNN model that failed on the mature site.On the young site, the SSD model performed the best for crown extraction with a coefficient of determination (R2) of 0.92, followed by Faster R-CNN (0.88) and YOLOv3 (0.62).As to the mature site, the SSD model achieved a R2 as high as 0.94, follow by YOLOv3 (0.69).These deep leaning algorithms, in particular the SSD model, proved to be successfully in identifying tree crowns and estimating crown widths with satisfactory accuracy.For the purpose of forest inventory on loblolly pine plantations, using UAV-captured imagery paired with the SSD object detention application is a cost-effective alternative to traditional ground measurement.
Keywords UAV image · Crown recognition · Object detection · Crown width measurement
Introduction
The tree crown consists of a mass of foliage and branches, the component important for photosynthesis.Therefore, tree crown size (crown width and depth) is strongly correlated with the growth of a tree (Chubey et al.2006).Tree crown measurement is used to assist in estimating biomass, predicting growth, and determining wood properties (Amarasekara and Denne 2002; Popescu et al.2003; Dobbertin 2005).Although tree crown depth, a part of the tree height, can be measured using a hypsometer with acceptable accuracy, measuring the crown width is often a challenge.Conventionally, crown width is measured in the field using logger’s tape by measuring a tree’s crown diameter twice (the largest and smallest or the east-west and north-south diameters) and calculating their average as the tree crown width (Lee et al.2010).The method is widely used, although it is time-consuming and labor intense.However, its accuracy is often compromised due to terrain and ground cover.As a result, the efficacy and accuracy of techniques to measure tree crown width continue to be improved.
Modern remote sensing technologies to identify and measure tree crowns (Ke and Quackenbush 2011) have included aerial imagery, high-resolution satellite imagery, and light detection and ranging (LiDAR).Using the Taguchi method, Erfanifard et al.(2014) optimized the support vector machines (SVM) classification system to identify tree crowns.Based on the UltraCam-D (UCD) aerial images with a spatial resolution of 0.06 m, they reported an overall accuracy of crown classification of 97.7%.Wagner et al.(2018) reported a method of automatic tree crown delineation using very high-resolution satellite images, while Li et al.(2019) proposed a real-time tree crown detection method for largescale remote sensing images.While satellite remote sensing images typically cover a larger area compared to aerial imagery, they are affected by atmospheric conditions and cloud cover.In addition, they might not provide enough spatial resolution for individual tree crown classification.Harikumar et al.(2017) applied high-density LiDAR point cloud data to build the internal and external geometric structures of a coniferous tree crown and identify tree species.Naveed et al.(2019) proposed a framework to integrate spectral and height information for individual tree crowns (ITC) delineation, with the treetop segmented to recognize tree crown.However, these methods using LiDAR and multispectral remote sensing data can be costly.
Most of the methods developed to improve accuracy of crown width measurement without taking measurements on the ground are geometry-based, e.g., determination of the crown vertex, multiscale segmentation, or direct detection of the crown contour.Few methods have involved object recognition using the image directly.By using optical submeter resolution satellite images, Gomes et al.(2018) developed a new algorithm for the detection and delineation of tree crowns.The algorithm uses a three-dimensional geometric model of the crown to detect and calculate the crown width.Wu et al.(2016) captured the topographical structure of forest and quantified the topological relationships of tree crowns using a graph theory-based localized contour tree method, before segmenting individual tree crowns analogous to recognizing hills from a topographic map, thus improving the accuracy by 1.8%-4.5% over that for the watershed and local maximum algorithm.Based on simple linear iterative clustering of superpixel algorithm, Zhou et al.(2020) obtained the crown boundaries based on aerial images of forest plots captured by drones.However, the methods listed above can only be applied to measure tree crowns at specific terrains and their accuracies are expected to be lower when applied to forest stands of multiple canopy layers.
As reviewed above, image-based crown width measurement involves crown classification (detection) and measurement.In recent years, deep learning based object detection algorithms, which can classify and measure objects in images have been widely used in fields such as in medical science (Kumar et al.2016; Wu et al.2018) and facial recognition (He et al.2018).Ren et al.(2018) was able to detect aircraft and ships by improving the Faster R-CNN algorithm and using high-resolution optical remote sensing images.Deep learning has also been applied to forestry.For example, Santos et al.(2019) employed drones to take images over a forested urban area in midwest Brazil, and applied three different object detection algorithms directly to recognize tree species.With the rapid development in deep learning, a subset of machine learning in artificial intelligence, the use of UAV with object detection algorithms may be an efficient alternative to measuring tree crowns, but has not been demonstrated yet.
In this study, deep learning based objection detection algorithms were exercised to identify and measure individual tree crown width of pine plantations based on highresolution images captured by UAV, with the goal being to demonstrate the efficacy and accuracy of the method.Three popular algorithms, Faster R-CNN (Ren et al.2015), You Only Look Once version 3 (YOLOv3) (Redmon and Farhadi 2018), and Single Shot Detection (SSD) (Liu et al.2016), were applied.Given the increasing popularity of drone and machine learning techniques in forestry, results of the study may have significant impact in future forest mensuration.
Object detection using deep learning
For the development of a typical statistical model, organized data are run through predefined equations, then model parameters are estimated, yielding predictive system outputs.Alternatively, a deep learning process trains the computer to learn on its own by recognizing patterns in the data using multiple layers of processing.Most recent deep learning models are based on artificial neural networks, specifically, convolutional neural networks (CNNs) to recognize latent features of the data from regularities in the layers.If the output data resulted from this network (model) process complies with the model requirements (LeCun et al.2015), the network will be retained as the target model.Otherwise, the parameter setting of the network will be readjusted iteratively until the output meets the requirements.
Deep learning has been extensively and successfully applied in many areas, including object detection.Object detection provides a fast and accurate means to classify and position (measure) objects in images (Girshick et al.2014).An object detection model predicts bounding boxes with confidence scores, one for each object it finds, as well as classification probabilities for each object.Object classification judges whether the object of interest is in the input image and reports a series of scored labels, which indicate the probability of the object of interest being in the input image.The object positioning determines the position and range of the object of interest in the input image.Then it delineates the border or the center of the object, a square box known as a bounding box, which can be used to measure object size.For this study, we used three commonly used algorithms: Faster R-CNN (Ren et al.2015), You Only Look Once version 3 (YOLOv3) (Redmon and Farhadi 2018), and single shot detection (SSD) (Liu et al.2016).
Faster R‑CNN
Faster R-CNN is a two-stage detection algorithm, with the first stage identifying a subset of regions in an image that might contain an object and the second stage classifying the object in each region.This algorithm consists of two modules: a deep fully convolutional network that proposes regions, and a Faster R-CNN detector that processes the proposed regions.It utilizes a region proposal network (RPN) with the CNN model.The RPN shares full-image convolutional features with the detection network and can simultaneously estimate object bounds and object scores at each position.Application of the technique takes following steps: pass an input image to the ConvNet, which returns feature maps for the image; apply a RPN on these feature maps and receive object proposals; apply ROI pooling layer to bring down all the proposals to the same size (Girshick 2015); and pass these proposals to a fully connected layer to classify any bounding boxes for the image.The Faster R-CNN detectors are designed to improve detection performance with a large number of regions.
YOLOv3
YOLOv3, an object detection system targeted for real-time processing and based on the structure of Feature Pyramid Networks (FPN) (Lin et al.2014), uses a single stage object detection network that is faster than other two-stage deep learning object detectors, such as Faster R-CNNs.The YOLOv3 model runs a deep learning CNN on an input image to produce network predictions.The object detector decodes the predictions and generates bounding boxes.YOLOv3 uses a feature extractor that has 53 convolutional layers and 22 Res layers named Darknet53 that is trained on ImageNet.Res layers use the idea of Residual Network (ResNet) (He et al.2016) for reference.Seventy-five layers are stacked to the feature extractor resulting feature fusion of three different levels of feature maps, so that the detector can better detect objects of different sizes.Development of a YOLOv3 model involves (1) inputting the image data for training, (2) annotating label objectives on images and initiating training, and (3) testing the trained model with YOLOv3.
SSD
SSD is another single-stage object detection model, and it adopts different detection steps from YOLOv3.After SSD extracts features from CNN to generate a feature map, it selects six layers of different sizes (multi-scale) from feature maps to perform straightforward regression for generating not only a series of fixed size bounding boxes, but also the confidence level for each object in these bounding boxes, before non-maximum suppression (NMS) (Neubeck and Van Gool 2006) is applied to produce the final detection results.To reduce the number of parameters and the computing workload, SSD adopts the MobilenetV2 (Sandler et al.2018) network as the basic network.The MobilenetV2 network inherits the highly efficient deep separable convolution form and the Residual Network in MobilenetV1 (Howard et al.2017), based on which a linear ResNet is proposed to increase the dimensionality of the input data.Application of SSD includes the following steps: install labelling, using labelling to annotate photos, config SSD, train model, and test model.
Materials and methods
Study sites and image acquisition
Two loblolly pine (Pinus taedaL.) plantations were purposely selected with one representing a young stand and the other a mature stand.The young stand was established in Houston County, Texas (31°18′38.0ʺ N, 95°18′07.1ʺ W) in 2015 with a spacing of 2.4 m by 2.7 m (1,500 trees per hectare).In 2019, the plantation had a good survival rate (92%) and reasonable growth, averaging 3.5 m in total height and 8 cm in diameter at breast height (DBH).This site has a flat terrain, and its tree crowns were not closed at the time of the study.The mature stand is in Rusk County, Texas (31°45′31.3ʺ N, 95°02′31.8ʺ W).The site is also flat and was an old field before it was planted with loblolly pine in 2001.In 2019, the site averaged 22.2 cm in DBH, 16.9 m in total height, and 35.2 m2in basal area per hectare, where the canopy was closed.
A DJI Phantom 4 Pro produced by Shenzhen DJI Sciences and Technologies Ltd.was used to capture aerial images of the two study sites, on 5 November 2019 for the young stand and 13 September 2019 for the mature stand.The Pix4Dcapyure app was used on a tablet to plan each flight mission, assigning parameters including fly area, image overlap, angle of camera, flight speed and altitude, etc.The flight altitude of the UAV was set to 42 m for the young site and 46 m for the mature site, both with the camera facing down vertically at 90°.
Individual images for each site were aligned to generate a dense point cloud and high-resolution ortho rectified image using Agisoft Photoscan (2014), a software application which performs photogrammetric processing of digital images (i.e., aerial triangulation and bundle block adjustment) and generates 3D spatial data to be used for indirect measurements of objects of various scales.The image size of ortho mosaic for the young site was 20,886 × 19,445 pixels, with the spatial resolution of 1.1720 cm per pixel, while the mature site has an image size of 28,376 × 22,244 pixels and 1.2446 cm resolution.Figure 1 shows the two site locations and their respective ortho mosaic images.
Measurement of actual tree crown width
Conventionally, tree crown width should be measured in the field.We thus attempted field measurement at both sites, but the results were less than satisfactory.At the young site, grasses were too dense for us to approach the trees.At the mature stand where the canopy was closed, the tree crowns were too intertwined for exact tree crown edges to be determined, particularly when looking into direct sunlight.Instead, we measured the crown width of each tree based on the ortho mosaic image in two directions (longest width and shorted width) and calculated their average as the actual tree crown width (hereafter referred to as actual crown width).This procedure is labor intense but is believed to result in more accurate values than field measurements.
Object detection model development
In this study, Faster R-CNN, YOLOv3 and SSD algorithms were used to develop models for measuring tree crown width, which involved both crown classification and regression.Classification evaluates the model accuracy in identifying tree crowns, while regression evaluates the model accuracy in measuring tree crown width.

Fig.1 The two study sites of loblolly pine plantation located in east Texas.Note: Each red square (a) indicates the location of a study site.Close-ups of the young site (b) and mature site (d) are shown on a Google satellite map and viewed on the ortho mosaic image, young (c) and mature (e)
For the young site, 128 trees within a plot that was randomly selected pre-flight were used for the model test (test data set) (Fig.2).The remaining part of the image was randomly sampled to create the training data set.In total, 445 samples were created, with each sample cropped into an image subset of 500 × 500 pixels that contained multiple tree crowns.For the mature site, where no test data set was selected before the flight, a total of 207 samples were randomly selected from the entire ortho mosaic image as the training data, with each sample also being cropped into an image subset of 500 × 500 pixels.Another 185 trees, which were independent of the training data, were extracted as the test data set.
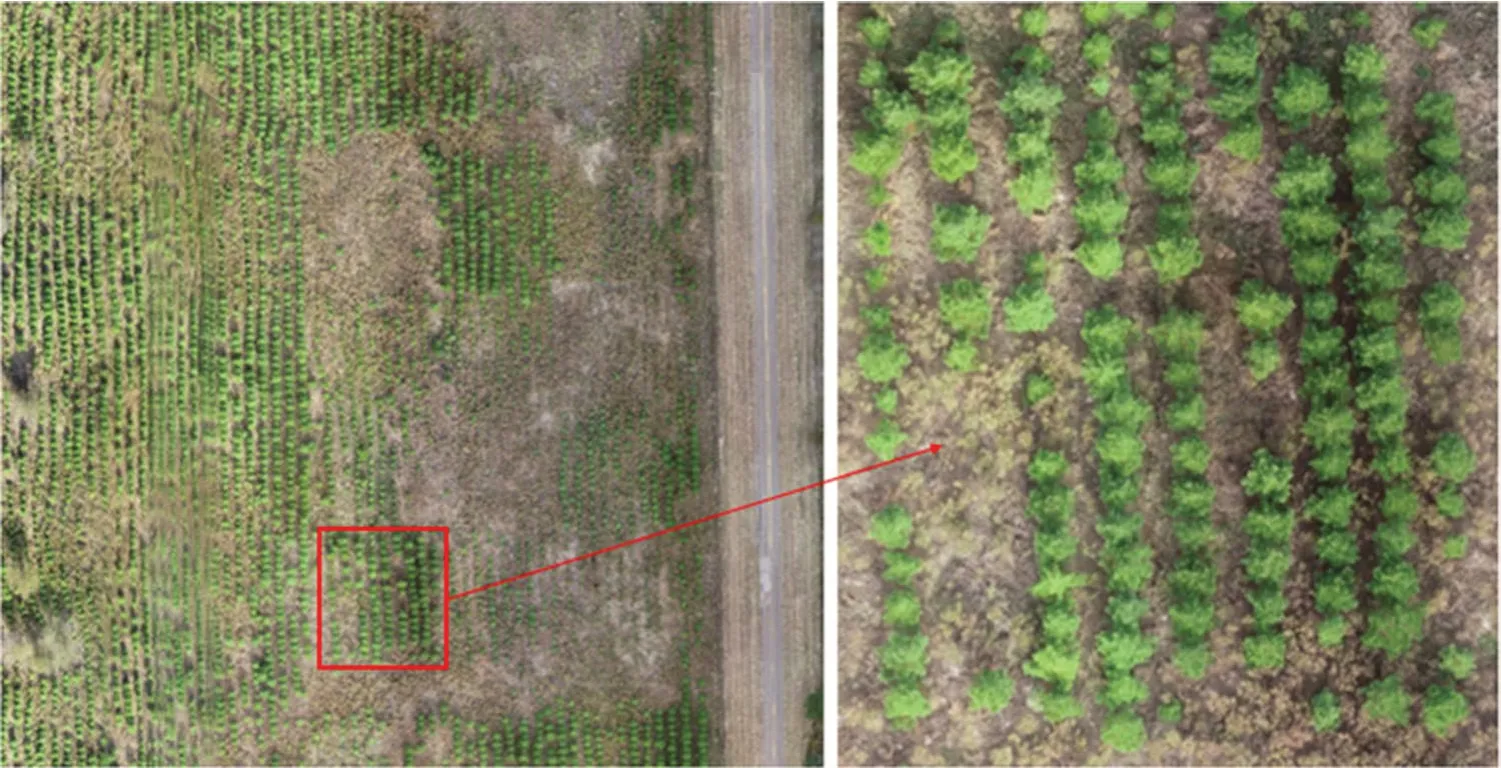
Fig.2 Aerial image of the young site showing the 128 tress used for model test
The training data set for each site was input to the three models, Faster R-CNN, YOLOv3 and SSD, respectively.During the training process, the data set was further divided into two subsets, a training subset and a validation subset, at a 9:1 ratio for iteration.These samples were annotated using LabelImg software (https:// github.com/ tzuta lin/ label Img), where each canopy within a sample was marked with a rectangular border manually (Fig.3).The parameters were set as follows for training Faster R-CNN, YOLOv3 and SSD: batch sizes were 8, 8, 16; learning rates were 0.0001, 0.001, 0.004; epochs were 720, 120 and 500, respectively.After the training of a certain number of epochs, the loss values of the models were stabilized in the training and the validation subsets.The three network models were run on the Tensorflow (Abadi et al.2016) platform of the Windows 10 operating system.The computer has an Intel(R) Xeon(R) Silver 4110 CPU with a clock rate of 2.10 GHz, 64 GB RAM, and a NVIDIA GeForce GTX 1080 Ti graphic processor with 11 GB memory.
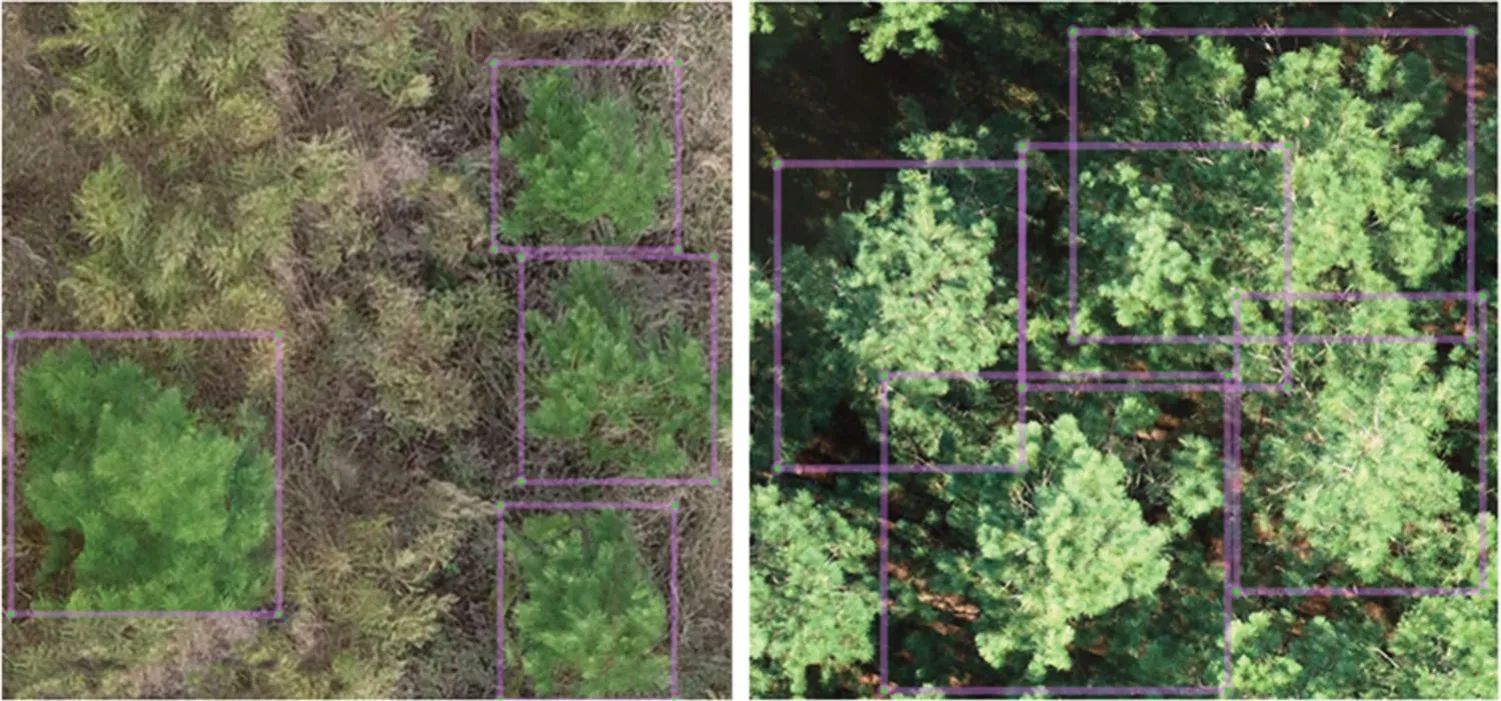
Fig.3 Crown areas in the random samples were manually delineated using labelIng software (https:// github.com/ tzuta lin/ label Img) for model training in the two study sites
Faster R-CNN model requires a large amount of data to improve both robustness (Bertsimas and Sim 2004) and accuracy.However, the experimental, labeled data for both the study sites were limited.Transfer learning is helpful for mitigating this limitation (Pan and Young 2009).Specifically, training is performed on a large data set (such as COCO data set; Lin et al.2014), and then the resulting weights are taken as the initial parameters of the training model.Of course, not all weights need to be retrained, only the weights of the last layer are trained, such as the fully connected layer.This process is referred to as fine-tuning.Data augmentation provides an alternative way to avoid model overfitting, where the original sample is horizontally flipped and randomly cropped to increase the number of data sets (Perez and Wang 2017).We applied both methods to Faster R-CNN, and the results enabled Faster R-CNN to extract crown from the young site, but failed for the mature site, probably due to its dense canopy.Therefore, the detection results of Faster R-CNN for the mature site were not acceptable and thus not reported in this study.
Model evaluation
The test data were used to assess the accuracy of the tree crown classification and crown width detection.The classification indexes were calculated to evaluate whether the crowns were correctly identified, while the regression indexes were used to evaluate the differences between the estimated crown size and the actual crown size.
Intersection over union (IoU) calculates the ratio of the intersection and union between the bounding box identified by the model and the real object bounding box.The object detection task does not require that the identified bounding box exactly match the real one.If an IoU is equal to or greater than 0.5, the detection is considered as correct (Everingham et al.2015).
Four parameters are used to quantify the correctness of each model output: true positive (TP), the number of correctly identified tree crowns in an image; false positive (FP), the number of wrongly identified crowns; false negative (FN), the number of unidentified crowns; and true negative (TN), the number of correctly identified non-crown objects.The model classification performance was evaluated based on precision, recall, accuracy and F1 score (Eqs.1-5).Precision is the ratio of correctly identified crowns over all identified crowns and represents the misidentification of the crown in the detection result.Recall represents the recall effect of classification, representing the correct frequency in the case of positive samples and shows the missed recognition of the crown in the test results.Accuracy represents the ratio of the number of correctly classified samples to the total number of samples.Note that in our study, only the crown is detected as a positive class, and thus TN=0, which simplifies the calculation of the accuracy.F1 Score is the harmonic mean of precision and recall.The two indicators accuracy and F1 score provide an overall evaluation of the model.

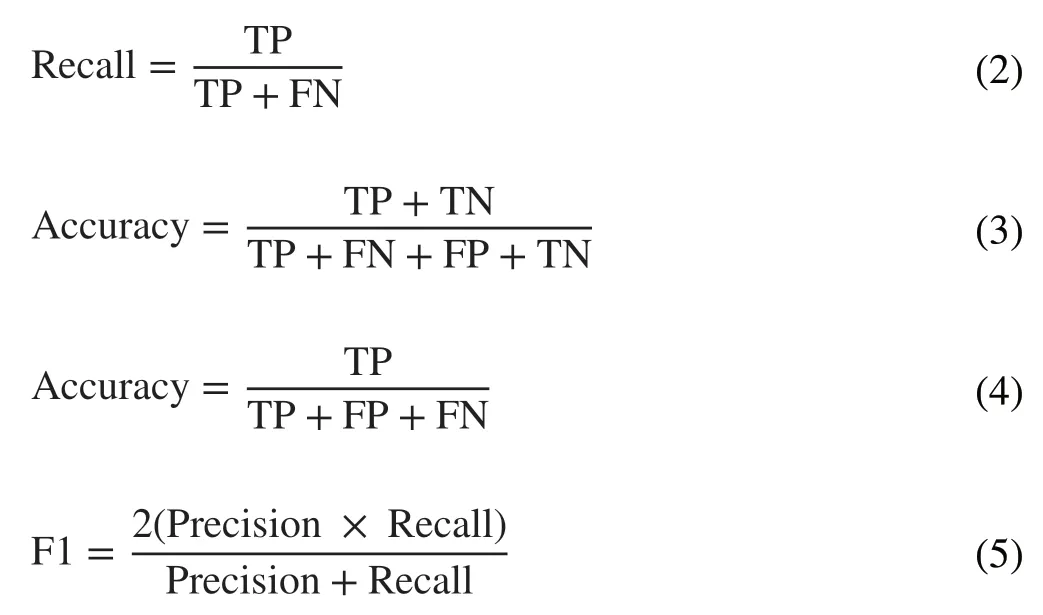
The model accuracy in measuring tree crown width was evaluated by calculating model bias, root mean square error (RMSE), and coefficient of determination (R2) (Eqs.6-8).Bias represents the degree of deviation between the estimated and actual values, RMSE andR2represent model precision.
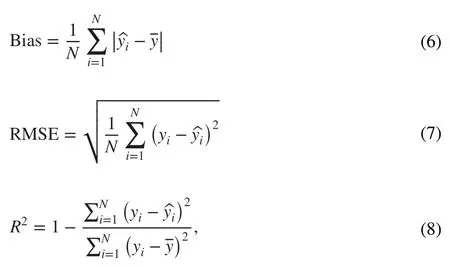
whereNrepresents the number of samples, yiindicates the actual value,denotes the estimated value, and
Results
Overall effects
By applying the test data to the models built upon the training data, the models were able to delimit individual tree crown frames and identify crown size with confidence (Figs.4, 5).Through visualization, we found that crown detection was successful throughout the entire study site, both young and mature, regardless of the object detection model used, or whether it was within or outside the areas for the test data set.
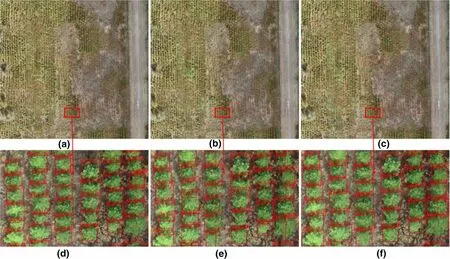
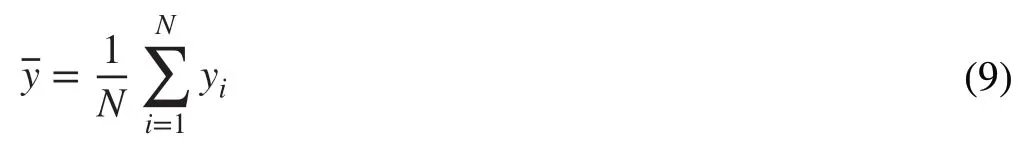
Fig.4 Results of crown identification at the young site using the three models.a Faster R-CNN, b YOLOv3, and c SSD.Note: Images d-f are the respective close-ups of area boxed in red in images a-c
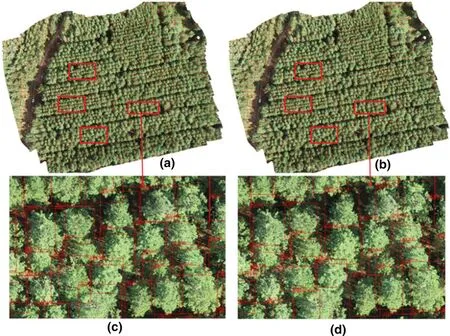
Fig.5 Crown identification results for the two models using the entire ortho mosaic image of the mature site: a YOLOv3b and b SSD.The red boxes in a and b mark all validation areas, which are shown in close-ups in c and d; the red boxes in c and d show the bounding boxes that resulted from each model
As expected, Faster R-CNN took the longest time (68 ms) for the detection since it utilizes a two-stage network.The other two models use a one-stage network, and SSD applied MobilenetV2 further as the basic network to reduce the computation workload and improve the recognition speed at 25 ms, about half the time needed by YOLOv3 (49 ms).
Faster R-CNN first generates region proposals, then makes a separate estimation for each of these regions.Therefore, it took more time because it requires running the detection and classification portion of the model multiple times.On the other hand, one-stage detectors such as YOLOv3 and SSD take a one-stage strategy by assigning each bounding box detector to a specific position in the image and are expected to be faster than Faster R-CNN.
Crown detection
Table 1 shows the results of model classification of tree crowns by applying the test data to the trained models for the young and mature sites.For all models and both sites, all of the classification indexes, including precision, recall, accuracy, and F1, achieved at least 93%, an indication that all of the three models were successful in identifying crowns in the young and the mature sites, except the Faster R-CNN model, which failed on the mature site.
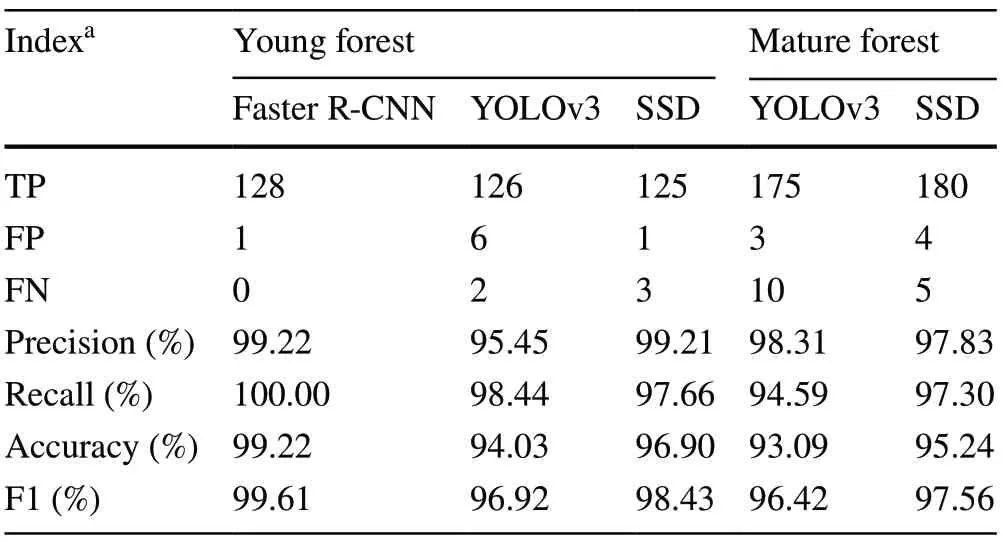
Table 1 Evaluation of crown classification for the young and mature forests by the three models
For the young site, almost all trees were correctly identified (precision) by the Faster R-CNN (99.22%) and SSD (99.21%) models.The precision of YOLOv3 (95.45%) was also high, although slightly lower (3.75%) than the Faster R-CNN and SSD.For the mature site, the YOLOv3 (98.31%) and SSD (97.83%) were similar with high precision.The recall parameter represents the missing recognition of treecrown in the detection results.For the young site, the recall of Faster R-CNN was the highest possible (100%), indicating that every tree was identified, 1.56% and 2.34% higher than that of YOLOv3 (98.44%) and SSD (97.66%), respectively.For the mature site, however, SSD (97.30%) had a 2.71% higher recall than that of YOLOv3 (94.59%).YOLOv3 and SSD had a similar likelihood of misidentification in the young site where objects were sparse.However, for the mature site with dense canopy, SSD had slightly better recognition than YOLOv3 did.
For the young site, the accuracy of Faster R-CNN reached 99.22%, suggesting this model identified the crowns satisfactorily.The YOLOv3 (94.03%) and SSD (96.90%) models had somewhat lower accuracy but still considered to be accurate.Nearly the same high level of accuracy for the young site was also obtained for the mature site using SSD (95.24%) and YOLOv3 (93.09%).The F1 score provides an overall evaluation by combining accuracy and precision of the model into one parameter (Goutte and Gaussier 2005).According to the F1 score, the ranking of the three models started with Faster R-CNN (99.61%), followed by SSD (98.43%) and YOLOv3 (96.92%) for the young site, and SSD (97.56%) was also better than YOLOv3 (96.42%) for the mature site.
Figure 6 shows the model precision-recall (P-R) curves based on the validation data.A certain point on the P-R curve (Davis and Goadrich 2006) represents that under a certain threshold, the model judges any result with confidence greater than the threshold as a positive sample, and any result less than the threshold as a negative sample.At this time, the corresponding precision and recall are determined.The entire P-R curve is generated by moving the threshold from high to low.If the P-R curve of one learner is completely covered by the curve of another learner, the performance of the latter is considered superior to the former.In the young site, Faster R-CNN and SSD performed similarly, and both had a detection effect significantly better than YOLOv3.For the mature site, the two curves (YOLOv3 and SSD) intersect.At this point, the break even point (BEP) is adopted as a measure of the model evaluation.BEP is defined as the value when the P-R curve intersects a line of 100% slope where precision=recall.The BEP value of SSD was slightly higher than that of YOLOv3, implying that the effect of SSD crown identification is slightly better than that of YOLOv3.
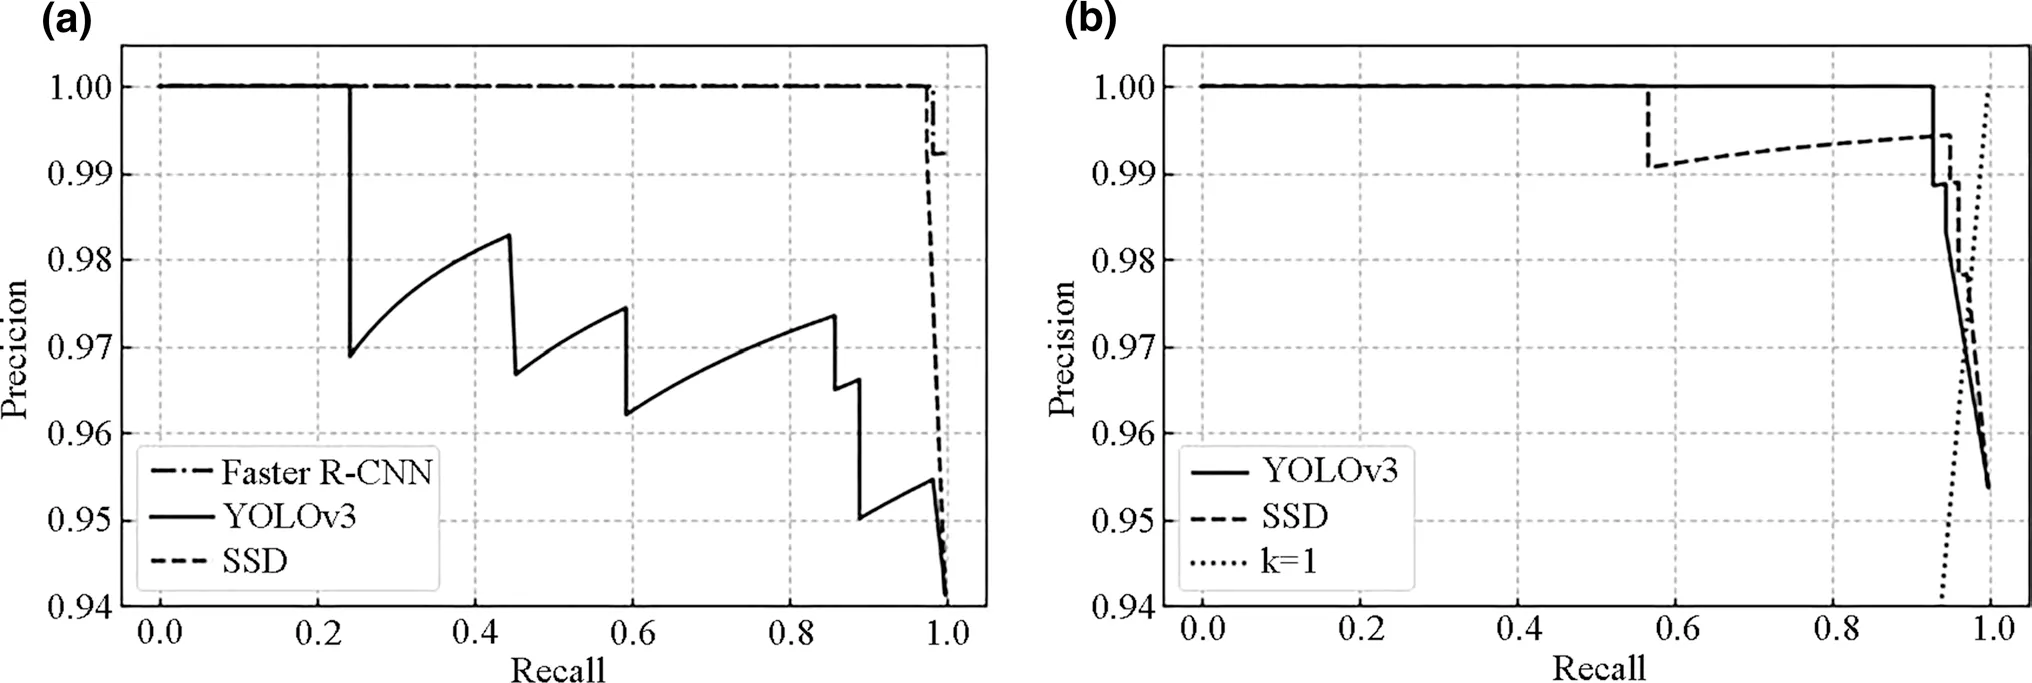
Fig.6 The precision-recall (P-R) curves using different models for a the young site and b mature site
Crown width estimation
For a correctly identified crown, its width can be estimated by calculating its bounding box dimension.By applying the test data to each model, the results (Table 2, Fig.7) showed that the model bias and precision in estimating crown width varied between models and between site types.For the young site, the SSD model had the lowest bias (0.44) and highest precision with RMSE=0.17 andR2=0.92, which translated to higher accuracy.Although its superiority to Faster R-CNN in both terms was not substantial, it was significantly better than YOLOv3.For the mature site, theR2value for SSD reached 0.94, which was much higher than for YOLOv3 (0.69), although both models displayed similar bias values.TheR2values for SSD and YOLOv3 were slightly higher for the mature site than for the young forest.Overall, the results suggest that the SSD model is more effective than the YOLOv3 model in extracting the true boundary of the tree crown.The Faster R-CNN model was also a good alternative for the young site, where the tree canopy was not closed.Figure 7 also displays how each model under-or over-estimated tree crown width.All models estimated tree crown width well at the lower end, but underestimated width at the higher end of tree crown size.Comparatively, the SSD model estimated tree crown width at both ends better than the other two models.
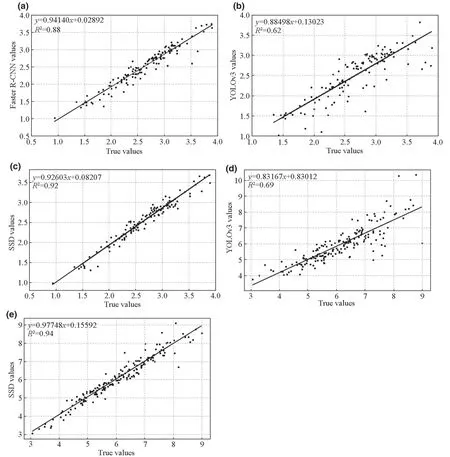
Fig.7 Comparison between the estimated and actual crown widths determined by the different models for the a-c young site and d, e mature site
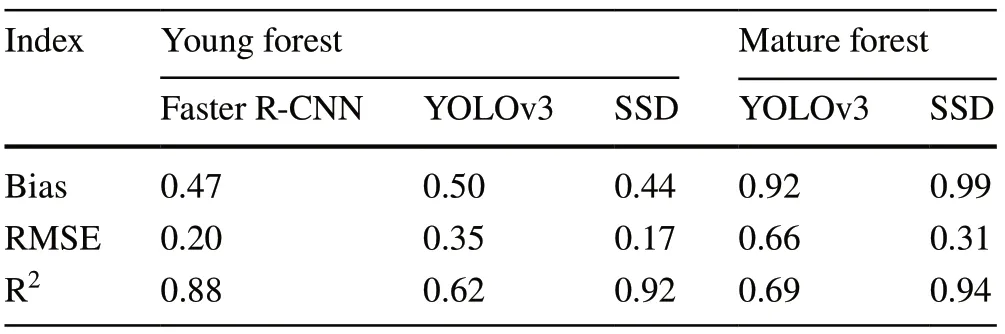
Table 2 Assessment of crown width estimation by different models
Discussion
Faster R-CNN is a two-stage network and was expected to perform better than the one-stage algorithms, SSD and YOLOv3.The results confirmed this expectation for the young site with the open canopy.However, it failed toproduce acceptable results for the mature site perhaps as a result of the closed canopy at the mature site, where more samples might be needed for the Faster R-CNN algorithm to be successful.More studies are required to further investigate this issue.SSD performed better than YOLOv3 on both sites, particularly for crown width estimation.With Darknet-53 as the backbone, YOLOv3 had fast training speed and high versatility.However, the number of iterations is fxied in pursuit of higher speed, which leads to lower accuracy than SSD for detecting objects.Based on the default proposal box mechanism of the Faster R-CNN network and the regression mechanism of YOLO (Redmon et al.2016), SSD adopts the idea of multi-scale feature characterization to detect the object.Thus, it combines the fast speed of YOLO and the high accuracy of Faster R-CNN, a breakthrough for the existing detection framework.
Conventionally, the width of a tree crown is measured by projecting the edges of the crown to the ground (dripline) and measuring the length along one axis from edge to edge through the crown center.Since a crown usually has an irregular shape, two axes (the max or min axis, or SW and NE axis) are normally measured and averaged as the crown width.Accurate projecting the crown edges to the ground is difficult, in particular for mature plantations with closed canopy.Thus, the ground measurement may be accurate for young and short trees, but tends to be biased for mature trees in rough terrains and complex stands.In addition, this method is labor intense and requires at least two crew members.Compared to the conventional method, the object detection models described in this study greatly mitigate the field workload; most work can be completed with a computer.Based on the results, even in the mature stand with a closed canopy, the models correctly bound and measured tree crown width (Figs.5, 7).Our models were also superior to other methods such as conventional aerial photogrammetry or remote sensing, which are generally suited for detecting large-area targets.With respect to forestry, they are commonly used to identify tree species in a massive area.However, the accuracy of crown extraction and the recognition of small targets could fall short of expectation.Since UAVs can obtain imagery with much higher spatial resolution than conventional aerial and satellite imagery, it is more suitable for identifying smaller targets such as individual trees.However, due to limitations in flight speed and duration, it is not suitable for large area target recognition.
The application of this study involves three steps: flying a UAV to capture images, processing images to attain an ortho mosaic image, and applying an object detection algorism to classify tree crowns and estimate each crown width.The technology for the first two steps are in place, and their application is straight forward.The third step only assigns the image path of the ortho mosaic to the model.In return, the model generates the output with images marked with crown boundaries as shown in Fig.4 and a list of items corresponding to the identified crowns in a text document.The list includes the number, center position, left and right width, top and bottom width, and average width of each crown identified.Since the models based on deep learning techniques are data oriented, the models developed in this study may apply to other loblolly pine plantations with the similar environments.Both study sites in this study are even-aged pine plantations, where trees are evenly positioned.The efficacy of these models when applied to mixed or uneven-aged stands needs to be confirmed.Through the above analysis, we know that the detection outcome of the SSD model was the most desirable.
The SSD model built in this study can be shared with other researchers for further assessment.If there are enough samples, the Faster R-CNN model can be adopted to improve precision through training.In addition, research can be conducted on the embedded devices that can extract tree crowns in real time.The Faster R-CNN has high accuracy although its recognition speed is low, which is ideal for desktop computers with greater computing power.In comparison, the MobilenetV2-based SSD and YOLOv3 can be used with a mobile terminal.
Conclusions
This work demonstrated the potential application of UAVacquired imagery paired with object detection algorithms, Faster R-CNN, YOLOv3, and SSD to estimate loblolly pine tree crowns.The results were promising, in particular for the SSD model, which achieved high accuracy for tree crown detection and crown width estimation for the young and the mature sites.In addition to accuracy, these methods also save on time and cost.A data enhancement method was used in model training to increase the number of data sets by flipping the original samples horizontally and randomly, reducing the possibility of model over-fitting, and improved model generalization and accuracy.Finally, our study contributed to the improvement of the network model.In the SSD model, the basic network was changed from VGG16 to MobilenetV2.Experiments show that this algorithm is more suitable for tree crown recognition, and the detection speed and accuracy of the model are good.Nonetheless, this is one of the first studies using deep learning technology in forestry, so there is great potential for further studies.We highly recommend the use of this object detection algorithm for forest inventory.As this machine learning technology is developed for more forest applications, the technology will improve and mature.
杂志排行

Journal of Forestry Research的其它文章
- A novel NIRS modelling method with OPLS-SPA and MIX-PLS for timber evaluation
- The dissemination of relevant information on wildlife utilization and its connection with the illegal trade in wildlife
- Endangered lowland oak forest steppe remnants keep unique bird species richness in Central Hungary
- The distribution patterns and temporal dynamics of carabid beetles (Coleoptera: Carabidae) in the forests of Jiaohe, Jilin Province, China
- The disease resistance potential of Trichoderma asperellum T-Pa2 isolated from Phellodendron amurense rhizosphere soil
- Genotype-environment interaction in Cordia trichotoma (Vell.) Arráb.Ex Steud.progenies in two different soil conditions