Polysaccharide, proline, and anti-oxidation enzyme activities of Thailand rosewood (Dalbergia cochinchinensis) seedlings exposed to exponential fertilization
2022-02-26ZhouHongJunyuGuoNingnanZhangZengjiangYangXiaojingLiuZhiyiCuiDapingXu
Zhou Hong · Junyu Guo · Ningnan Zhang · Zengjiang Yang · Xiaojing Liu · Zhiyi Cui · Daping Xu
Abstract Thailand rosewood (Dalbergia cochinchinensis) is a vulnerable high value tree species in subtropical and tropical Southeast Asia.The demand for the rehabilitation of the natural habitat of the species requires high-quality seedlings.However, current fertilizer regimes tend to deliver a coarse rate of fertilizers that result in a low uptake efficiency and a high risk of nutrient excess.Exponential fertilization is an effective approach to promote seedling quality through identifying an optimum dose out of a range of applications.In this study, Thailand rosewood seedlings were cultured in a mixed substrate of perlite, vermiculite, and peat (2:2:3, v/v/v) and received exponential fertilization from 0 (control), through 100, 200, 300, 400, and 600 mg nitrogen (N) per plant over a four-month cultural rotation.Height, diameter, and shoot biomass increased with fertilizer rate and were maximized at 300 mg N per plant.This application also reduced nutrient deficiencies and avoided excess supply compared to higher rates.Polysaccharide, proline, and anti-oxidation enzyme activities tended to be greater in unfertilized controls or in over-fertilized high dosages, with lower activities around 100-300 mg N plant-1.Application of 300 mg N per plant was identified as the optimum dosage as it maximized nutrient reserves, polysaccharide and proline contents, and anti-oxidants without causing any symptoms from excess fertilizer toxicity.Future work is required to identify the effects of N-fixation on the formation of nutritional reserves in Thailand rosewood seedlings subjected to exponential fertilization.
Keywords Dalbergia cochinchinensis · Steady-state absorption · Phosphorus · Potassium · Antioxidant
Introduction
Nutrient storage in tree seedlings partially determines the success of transplant establishment (Duan et al.2013; Wei et al.2013; Wang et al.2017).An inherent nutrient storage characteristic will benefit the retranslocation and utilization for new organ growth (McAlister and Timmer 1998; Xu and Timmer 1999).Furthermore, retranslocated nutrients can fuel bud burst and new shoot elongation which will support the assimilation of carbon (C) through photosynthesis (Wang et al.2017; Zhao et al.2017).Inherent nutrients can also be used to fuel new root emergence and elongation to promote uptake from soil (Oliet et al.2009; Wei et al.2013).The improvement of nutrient reserve availability is vital to promote the survival and growth of newly planted seedlings in a degraded habitat.
For nearly 30 years, exponential fertilization has been widely accepted as a regime to manage the fertility of tree seedlings (Timmer 1997).This practice was developed on the basis of the steady-state nutrient uptake theory and improved from conventional nutrient loading (Zhao et al.2019).Exponential fertilization can induce seedlings to store greater amounts of nutrients than needed and strengthen the inherent nutrient reserve (at the end of nursery period) to meet the exponentially increasing demand for nutrients (Timmer 1997; Duan et al.2013; Wei et al.2020).The synthesized responses of biomass and nutrient status to a range of nutrient supplies can be divided into three stages: deficiency, luxury consumption, and excessive toxicity (Birge et al.2006; Salifu and Jacobs 2006; Uscola et al.2015).Transplant trials have demonstrated that seedlings pre-cultured by a range of exponential fertilization levels will show a positive responsive performance in the field (Pokharel and Chang 2016).Recent studies specifically manipulated the nutritional regime to modify seedling response to exponential fertilization to further improve inherent nutrient reserves (Chu et al.2019a, b).Most of the current studies focus on the general response of nutrient cycling to exponential fertilization, varied by rate, across different species.
Given that the response by seedlings to a range of nutrient supply can be extended to the field stage (Li et al.2012, 2016), seedlings may have experienced physiological effects during pre-culturing that involved nutrient storage.Foliage is an internode of nutritional sink and photosynthetic source, the change of which can indicate physiological performance in response to an exogenous stimuli (Close et al.2005; Everett et al.2007; Li et al.2018; Zhao et al.2019).A recent study on Buddhist pine (Podocarpus macrophyllus(Thunb.) Sweet) seedlings found that both foliar and fine root morphologies can change in every stage induced by exponential fertilization, and foliage has a close relationship with most nutritional variables (Xu et al.2019).The chemical property of leakage from containerized Holly Oak (Quercus ilexL.) seedlings varied in response to different levels of nutrients (Uscola et al.2015).Therefore, more physiological activities may exist to explain the staged response of vulnerable tree seedlings to exponential fertilization.
Stressors on trees can cause an oxidant response and the pro-oxidant/antioxidant balance will be adjusted through changes in physiological performance until the oxidant reaches an acceptable level (Brandao et al.2017).Besides the general awareness of abiotic stressors to trees, nutrition input can be either deficient or excessive, and both can be characterized as subtle stressors for seedlings (Xu et al.2019).Exponential fertilization can induce a range of responses with regards to nutritional status in seedlings that have typical symptoms for deficiency, luxury consumption, and excessive toxicity when supply increases from low to high (Salifu and Timmer 2003; Salifu and Jacobs 2006; Uscola et al.2015; Xu et al.2019).These studies have clearly demonstrated that biomass accumulation, nutrient concentration, and nutrient content can respond in close association to different nutritional statuses.However, more specific physiological performance in relation to antioxidation across nutritional status has not been well-documented.Polysaccharides are one of the main types of natural products that regulate antioxidant enzyme activities and modulate intracellular ion concentration to protect plants from stress (Jiao et al.2016; Zou et al.2018).Proline is a proteinogenic amino acid that accumulates in response to stress-caused membrane oxidation associated with polysaccharides (Maatallah et al.2010; Turfan et al.2016).To mitigate the negative effects of reactive oxygen species (ROS) in plants, the enzymatic activities of superoxide dismutase (SOD), peroxidase (POD), and catalase (CAT) are usually increased to scavenge ROS (Hussain et al.2018).To the best of our knowledge, there are no studies documenting these physiological responses to nutritional stresses.
Thailand rosewood (Dalbergia cochinchinensisPierre ex Laness) is a highly valued hardwood from the Fabaceae family mainly distributed throughout subtropical and tropical regions of Cambodia, China, Laos, Thailand, and Vietnam.Due to its unique rich aroma, Thailand rosewood is highly desired and its commercial value has been increasing for more than 20 years (Jiang et al.2016).This species also contains several bioactive constituents that can be extracted to counter bacteria and oxidation (Surarit et al.1996, 1997; Svasti et al.1999).Therefore, similar to other endangered species, the over-exploitation of natural Thailand rosewood resources has resulted in a high demand for high-quality seedlings (Asian Regional Workshop 1998).It has been shown that exponential fertilization can efficiently improve nutrient uptake and reserves in Chinese rosewood (Dalbergia odoriferaT.Chen) seedlings, another vulnerableDalbergiaspecies (Li et al.2017, 2018).Therefore, exponential fertilization has the potential to induce physiological and bioactive responses in Thailand rosewood seedlings when their nutritional status is shaped by different dosages of nutrient application.
In this study, exponential fertilization was applied to Thailand rosewood seedlings in a range of dosages.As a species that is highly sensitive to stressors, it is assumed that physiological performances related to scavengers (POD, SOD, CAT) are easily responsive.Variables about polysaccharide, proline, and anti-oxidation enzyme activities were determined in addition to nutrient content and concentration to detect the mechanism of nutritional status across different growth stages.It was hypothesized that: (1) biomass and nutrient uptake in seedlings would show significant three-stage responses to a range of fertilizer applications; (2) chlorophyll and polysaccharide contents would be highest at the optimum rate of exponential fertilization; and, (3) proline and anti-oxidation enzymes would be high due to the excessive nutrients at the end of nursery stage.Our results will improve current understanding of the mechanism by which antioxidant activity is generated across different nutrient statuses in seedlings fed by exponential fertilization.The findings will also benefit for creating a cultural protocol for highquality Thailand rosewood seedlings.
Materials and methods
Study conditions and plant material
This study was carried out in the nursery of the Institute of Tropical Forestry (23° 13′ N, 113° 23′ E), Chinese Academy of Forestry, Longdong, Guangzhou.Seeds were collected from a mature Thailand rosewood (Dalbergia cochinchinensis) in the autumn of 2016.Seeds were cleaned and sterilized with 5% (w/w) potassium permanganate for 30 min in the spring of 2017, and sown in sand for germination.Germinated seeds were transplanted to nursery beds for culturing, according to normal protocols.On 12 April 2017, uniformly sized seedlings (average height and root-collar diameter 5.9 cm and 0.6 mm, respectively) were transplanted to plastic pots in a mixture of perlite, vermiculite, and peat (2:2:3, v/v/v).
Initial substrate characteristics were determined by methods suited for seedlings (Wang et al.2016, 2017; Wei et al.2017; Li et al.2018).Substrate pH was measured in a 1:2.5 ratio (v/v) mixture of distilled water and was 5.8.Organic matter was determined by dichromate oxidation and titration with ferrous ammonium sulfate, available nitrogen by the sum of ammonium-N and nitrate-N concentration, available phosphorus (P) by the phosphomolybdic acid blue-color method, available potassium (K) by flame photometer, total N by the Kjeldahl method, and total P by the HClO4-digested Na2CO3fusion method.According to these procedures, organic matter was 442.8 g kg-1, total N 7.4 g kg-1, total P 0.2 g kg-1, total K 16.9 g kg-1, available N 337.6 mg kg-1, available P 20.1 mg kg-1, and available K 212.4 mg kg-1.All seedlings were watered to full capacity and fertilized with monopotassium phosphate (KH2PO4) and potassium chloride (KCl) to deliver P2O5and K2O in an initial amount of 80 mg plant-1and 60 mg plant-1, respectively.This rate of P2O5was applied because the initial available P in the growing medium was less than in studies on other tropical seedlings (Chu et al.2019a, b).Phosphorous tended to be fixed by the substrate rather than be absorbed by the roots; hence, a high rate of P was utilized to promote uptake in spite of the low efficiency (Wang et al.2017).The supplement of K2O in addition to the initial content of potassium in the substrate was because of the high mobility of K, creating a leakage that decreased its content (Wei et al.2014; Wang et al.2016).
Experimental design and fertilizer treatment
This experiment was a random block design with repeated measurements on variables and three replicated blocks (n=3).Exponential fertilization at different rates was the treatment, with 18 pots (one seedling per pot) placed on a bench per treatment at 15 cm × 15 cm (the distance between outsides of two adjacent pots).Two weeks after transplanting, seedlings were fertilized with urea (N content of 46%, w/w).Controls were unfertilized.
Seedlings were fertilized according to the classical exponential fertilization model popularized by Timmer (1997), using Eqs.(1) and (2) (Li et al.2017, 2018).

whereNTis the amount of fertilizer overttimes,NSthe initial nitrogen content, andrthe coefficient that determines the fertilizer-addition rate which can be calculated and used for another hybrid model (Dumroese et al.2005; Everett et al.2007; Duan et al.2013):

whereNtis the amount of nitrogen, andNt-1the total amount of N applied.NTwas set to be 100 (E100), 200 (E200), 300 (E300), 400 mg N per plant (E400), and the maximum amount delivered was 600 mg N per plant (E600) (Li et al.2017).Since exponential fertilization may cause seedlings to absorb and store a greater amount of nutrients than required, a dosage of 800 mg N per plant was included (E800).It was assumed that this large dosage can be endured by seedlings as it has been shown that tropical tree seedlings can absorb and utilize high levels of nutrients, e.g., over 1000 mg N per plant through controlled-release fertilizer application (Chu et al.2019a, b) or fertilization combined with a longer photoperiod (Li et al.2018).Exponential fertilization was carried out in 12 applications (t=12) over three months, ending 19 July 2017 (Table 1).
In the daytime she sat down once more beneath the windows of the castle, and began to card with her golden carding-comb; and then all happened as it had happened before

Table 1 Weekly schedule of nitrogen application to Dalbergia cochinchinensis seedlings
Sampling and measurement
Seedling height and root collar diameter (RCD) were measured every 7 days, 3, 6, 9, 12, 15, and 18 weeks after transplanting on 26 April, 10 May, 24 May, 7 June, 21 June, and 5 July in 2017.Seedlings began to show toxic symptoms such as withered shoot tips and dark yellow to brown crinkled leaves in the 800 mg N per plant treatment after 16 weeks.By week 8, most seedlings in this treatment showed symptoms of death.Therefore, the rest of the seedlings in this treatment were excluded from the rest of the experiment.Seedlings in other treatments were sampled during the 20thweek after transplant; six were randomly sampled from one replicated block per treatmentand used to measure biomass as dry weight after ovendrying at 70 °C for 72 h.Dried samples were ground and digested using sulfuric acid (H2SO4) and hydrogen peroxide (H2O2).Total N concentration was determined using the Kjeldahl method and total P and K concentrations by the ICP-OES method (Vista-Mpx, Varian Medical Systems, Inc., Palo Alto, CA, USA) (Li et al.2017, 2018; An et al.2018; Chu et al.2019a, b).As seedlings were dead in the E800 treatment, only height and root collar diameter were measured and there was no further chemical analysis.
The other six seedling samples were used to determine chlorophyll a and b responses using a spectrophotometer at wavelengths 663 nm and 645 nm, respectively (Wei et al.2020).Leaves were sampled and mixed into a bulk from the six seedlings to determine chlorophyll content and polysaccharide levels by the Folin-Ciocalteu colorimeter method (Zhou et al.2019).Methylene dioxyamphetamine (MDA) and proline contents were measured using thiobartituric acid (TBA) and ninhydrin-orthophosphoric acid methods, respectively (Guo et al.2018).Enzymatic antioxidant assays on SOD, POD, and CAT were performed with different procedures (Hussain et al.2018).Fresh leaf samples were centrifuged at 15 000 rpm at 4 °C to prepare supernatant for enzymatic determination.To determine SOD, supernatant was extracted by 75 mM ethylenediaminetetraacetic acid (EDTA), 1-mL nitroblue tetrazolium (NBT) (50 mM), 950-μL sodium phosphate buffer (50 mM), 1-mL riboflavin (1.3 μM), and 0.5-mL methionine (13 mM) and measured using a spectrophotometer at 560 nm.To determine CAT, supernatant was extracted with 0.9-mL H2O2and 50 mM phosphate buffer and measured for absorbance at 240 nm.POD enzyme activity was assessed at 470 nm for the supernatant extracted by 400-μL guaiacol (20 mM), 2-mL sodium phosphate buffer (50 mM), and 500-μL H2O2(40 mM).
Statistical analysis
All statistics used SPSS software ver.15.0 (SPSS Inc., Chicago, IL, USA).Data across treatments were tested for normality and homogeneity of variance.No odd or extreme records were found in our dataset and both tests were accepted.Analysis of variance (ANOVA) was used for all variables to test responses to exponential fertilization at different rates.When a significant effect was found on some variables, means were compared to the Tukey test at 0.05 level.Both theFandPvalues used to describe the statistics of the ANOVA model were labeled to show the degree and possibility of significance of effects on measured variables.A nomograph analysis was employed to analyze the nutritional status of seedlings according to leaf biomass and nutrient concentration and content (product of biomass and concentration) for different rates of fertilization (Salifu and Timmer 2003; Salifu and Jacobs 2006; Xu et al.2019).Data from leaves, stems, and roots were combined to calculate average biomass, nutrient content, and nutrient concentration.Using the control as reference, data from fertilized seedlings were standardized to positive values.Subsequently, standardized means were projected into a twodimensional coordinate with thexaxis as standardized nutrient content and theyaxis as standardized nutrient concentration.Vector arrows were arranged in order with the increase of fertilizer rate relative to that in the control.The interpretation for each arrow was adapted from Salifu and Timmer (2003).
Results
Seedling growth
Fertilized seedlings increased in height over time but control seedlings did not show changes until six weeks after transplanting (Fig.1a).Exponential fertilization did not have a significant effect on heights until 12 weeks after transplanting.By the 12th week, heights were higher in fertilized seedlings than in the control, except for the E100 treatment (F6,14=7.75;P=0.0008).Height was also higher in the E300 treatment than in the E100 treatment by 15%.Fifteen weeks after transplanting, fertilization resulted in higher seedling heights than the control among all application rates (F6,14=8.98;P=0.0004).In the 18th week, fertilized seedlings had greater heights than the controls except for the E800 treatment (F6,14=12.55;P< 0.0001).Heights in the E300 treatment were higher than in the E600 and E800 treatments by 26% and 34%, respectively.
Root collar diameter (RCD) increased over time until the 9th week after transplanting, and then remained unchanged until the 18th week (Fig.1b).In the 3rd week after transplanting, RCD in the fertilization treatments were lower than the controls except for the E100 and E400 treatments (F6,14=6.47;P=0.0020).By the 5th week, there were no differences for RCD between the controls and fertilized seedlings, but RCD in the E100 treatment was higher than in the E200, E300, and E400 treatments (F6,14=5.04;P=0.0060).In the 9th week, RCD in the E100 and E200 treatments were higher than in the E800 treatment (F6,14=3.97;P=0.0157).By the 12th week, RCD in the E100 treatment was higher than that in the E800 treatment (F6,14=3.84;P=0.0178) and by the 18th week, RCD in the E300 treatment were the highest compared to the those in the E600 and E800 treatments (F6,14=6.90;P=0.0014).
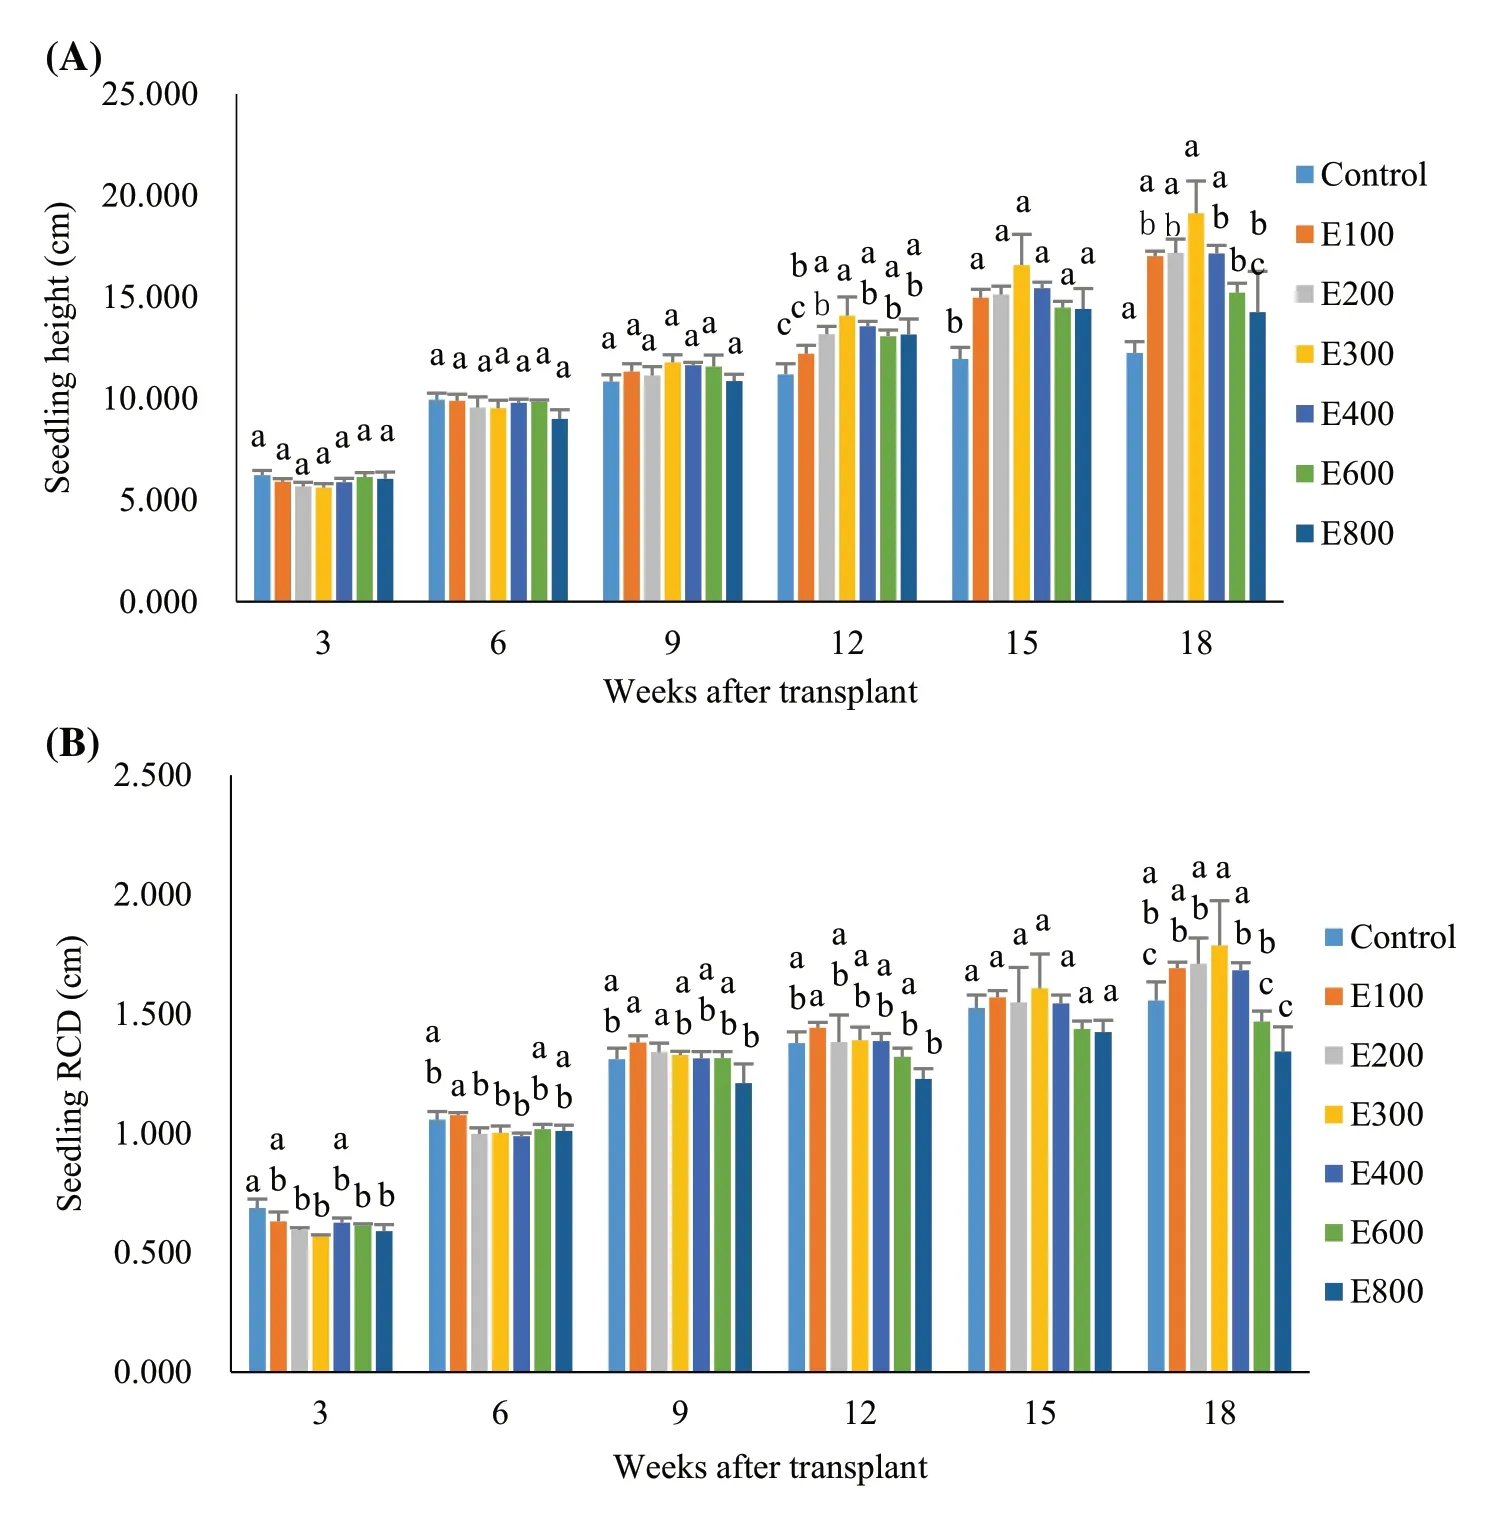
Fig.1 Heights and root collar diameters (RCD) in Dalbergia cochinchinensi seedlings Note: Different letters over error bars indicate significant differences across treatments in a specific week after transplant
Biomass accumulation
Leaf biomass was higher in the E200, E300, and E400 treatments than in the controls (F5,12=6.33;P=0.0042) (Fig.2a), and was largest in the E300 treatment than in the E100 and E600 treatments.The E300 treatment also resulted in a greater stem biomass than in the controls, E400, and E600 treatments (F5,12=6.88;P=0.0030).Root biomass was lower in the E400 and E600 treatments compared to the controls and the E300 treatment (F5,12=4.27;P=0.0184).Root to shoot ratios (R/S) were highest in the control seedlings highest in the F100 treatment compared to the rest of fertilization treatments (F5,12=80.48;P< 0.0001) (Fig.2b).
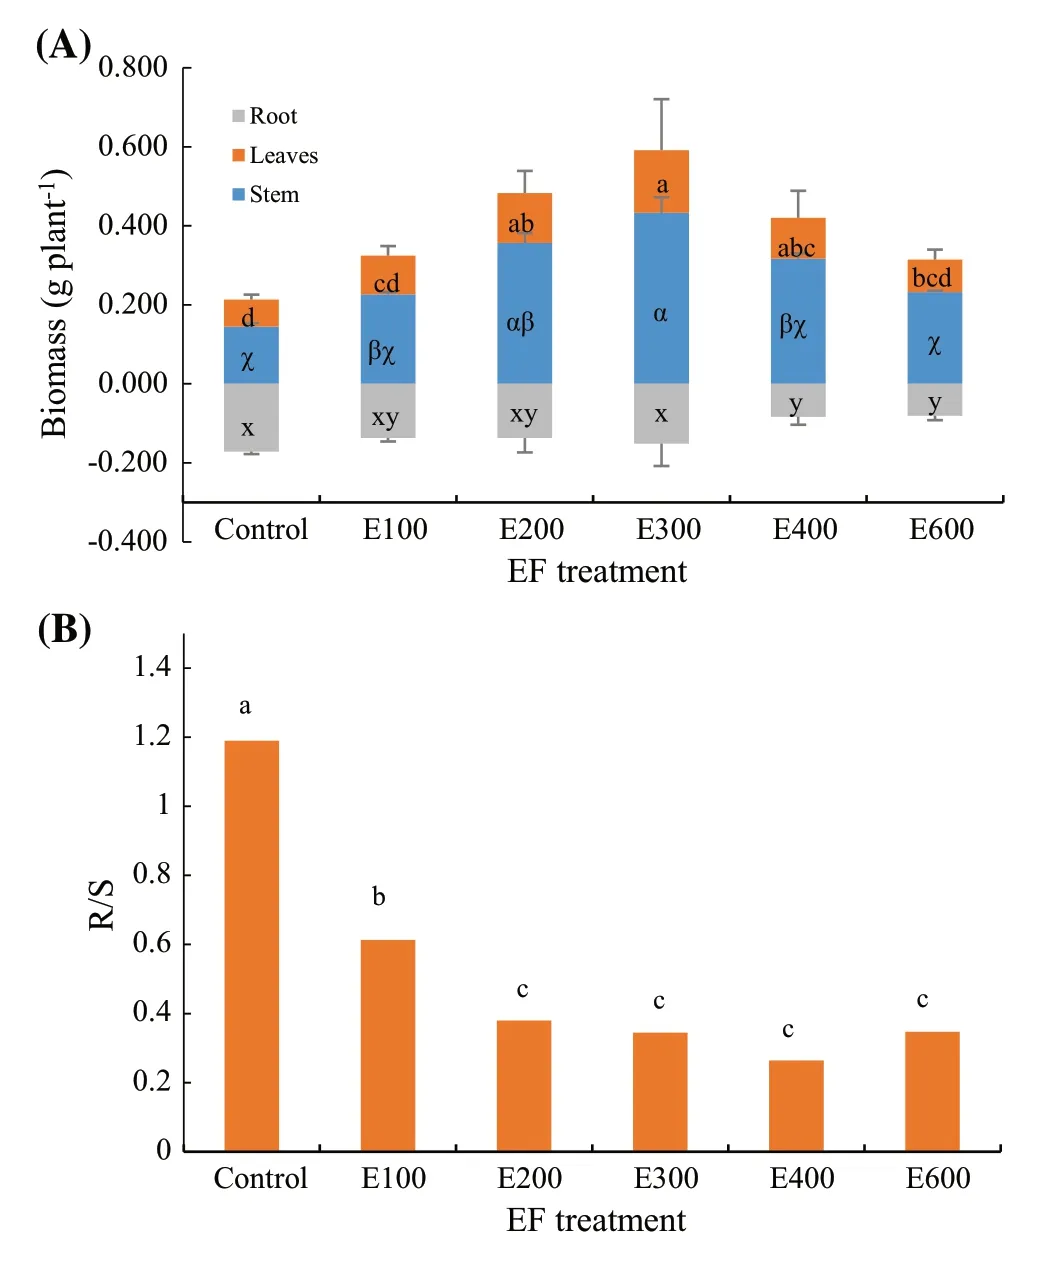
Fig.2 a Biomass accumulation in leaves, stem, and root and (b) root to shoot (combined leaves and stem) ratios of Dalbergia cochinchinensis seedlings Note: letters indicate significant differences according to Tukey test at 0.05 level; (a), letters of a, b, c, and d are labeled for leaves; letters of a, β, and χ are labeled for stem; letters of x, y, and z are labeled for root
Nutrient concentration
Leaf phosphorous with fertilization rate but was unchanged by the E200 to E600 treatments (F5,12=15.76;P< 0.0001; Fig.3b).Stem P levels increased in the controls to the E300 treatment and stagnated until the E600 treatment (F5,12=19.73;P< 0.0001).The E100 treatment did not modify root P, which increased from the E200 to the E400 treatment, and declined in the E600 treatment (F5,12=34.89;P< 0.0001).
Leaf potassium levels were higher in the control and the E100 treatment and then declined with increasing amounts of fertilizer (F5,12=37.63;P< 0.0001; Fig.3c).Stem K concentrations were the same in the E100 and E200 treatments as in the control (F5,12=4.75;P=0.0126) and potassium concentrations in the roots decreased in the E600 treatment but were higher in the E100 treatment than in the E400 and E600 treatments (F5,12=5.02;P=0.0103).

Fig.3 a Concentrations of nitrogen (N), b phosphorus (P), and c potassium (K) (c) in leaves, stem, and root in Dalbergia cochinchinensis seedlings.Note: Different letters indicate significant different according to Tukey test at 0.05 level.Letters of a, b, c, and d are labeled for leaves; letters of a, β, χ, and δ are labeled for stem; letters of w, x, y, and z are labeled for root
Whole-plant nutritional status
As the level of fertilization increased, whole-plant N levels increased up to the E300 treatment but remained unchanged in treatments with higher fertilizer rates (F5,12=237.64;P< 0.0001; Fig.4a).However, with increasing rates of fertilization, both N contents and biomass increased up to the E300 treatment then decreased to the E600 treatment (N contentF5,12=8.38;P=0.0013; biomassF5,12=3.58;P=0.0327).Phosphorous levels increased in the whole plant from the controls to the E200 treatment, after which there was no further change (F5,12=28.56;P< 0.0001).Again, whole-plant P peaked in the E300 treatment (F5,12=16.81;P< 0.0001; Fig.4b).
With an increase in nutrient supply, K concentration increased from the controls to the E100 treatment, then decreased up to the E600 treatment (F5,12=12.24;P=0.0002; Fig.4c).

Fig.4 Responses of wholeplant biomass, nutrient content, and nutrient concentration for a nitrogen (N), b phosphorus (P), (c) and potassium (K) in Dalbergia cochinchinensis seedlings Note: Different letters indicate significant different according to Tukey’s test at 0.05 level.Letters a, b, c, and d are for leaves; a, β, χ, and δ for stems; w, x, y, and z for roots
Diagnosis of nutritional status
Nitrogen deficiency was continuously countered by increasing the rate of fertilization from the control to the E300 treatment (Fig.5a).From the E300 treatment on however, the increase in fertilization created excess N reserves according to the decline in biomass and N content.
Similar to nitrogen status, phosphorous deficiency was countered by increasing the level of fertilization up to the E300 treatment (Fig.5b).Thereafter, higher rates induced excessive P toxicity due to a decline in whole-plant biomass.
The E100 treatment countered the whole-plant K deficiency in the control (Fig.5c).However, increases in fertilizer application up to the E300 treatment resulted in potassium dilution but increased biomass.The two highest fertilization treatments resulted in an excess of K.

Fig.5 Vector analysis of whole-plant biomass, nutrient content, and nutrient concentration for a nitrogen, b phosphorus, and c potassium in Dalbergia cochinchinensis seedlings Note: Interpretations for vector shifts are adapted from Salifu and Timmer (2003).Shift A, nutrient dilution; Shift C, nutrient deficiency; Shift E and F, excessive nutrient supply
Chlorophyll content
Chlorophyll a was greater in the E100, E200, and E300 treatments than in the control and in the E400 and E600 treatments (F5,12=73.04;P< 0.0001; Table 2), and chlorophyll b was highest in the E300 treatment (F5,12=91.64;P< 0.0001).Foliar carotenoid levels were greater in the E200 and E300 treatments than in the control and in the other treatments except for E100 (F5,12=21.10;P< 0.0001).As a result, total chlorophyll content was greatest in the E100, E200, and E300 treatments (F5,12=119.26;P< 0.0001).

Table 2 Chlorophyll a, chlorophyll b, and carotenoid levelsin leaves of Dalbergia cochinchinensis seedlings
Foliar antioxidant variables
The polysaccharide content was higher in the control and the E600 treatment than in the other treatments (F5,12=21.81;P< 0.0001; Table 3).Proline content increased with exponential fertilization although the difference between the E300 treatment and control was insignificant (F5,12=162.48;P< 0.0001).MDA levels also showed an increasing trend in response to fertilization and was higher in the E600 treatment than in the E100 and E200 treatments (F5,12=6.80;P=0.0032).POD activity was reduced by fertilization although the difference between the control and the E600 treatment was not statistically different (F5,12=15.56;P< 0.0001).SOD activity decreased from the control to the E200 treatment, then increased up to the E600 treatment (F5,12=25.72;P< 0.0001).A similar trend was shown for CAT activity across fertilization treatments (F5,12=44.85,P< 0.0001).

3 elbaT-atac dna ,)DOS( esatumsid edixorepus ,)DOP( esadixorep fo semyzne noitadixo-itna fo seitivitca dna ,)ADM( enimatehpmayxoid enelyhteM dna ,enilorp ,edirahccasylop fo stnetnoC ES a10.5 c14.31 d59.3 dc00.3 b55.01 a13.3 ES ba42.1 b07.51 b12.7 ba51.4 ba57.6 a93.7 1-1-)nim g 001 U( TAC naeM 05.711 00.86 40.34 22.26 61.29 00.021 1-)WF g lomn( ADM naeM 32.56 18.35 01.44 81.36 02.66 85.38 ES a34.0 c74.862 d77.91 d55.36 c39.62 b27.23 a42.77 d74.2 ba54.0 a79.0 ES dc86.0 cb73.0 1-)WF g 001 U( DOS naeM 38.71 35.8 1-)WF g gμ( enilorP 99.6641 59.01 60.714 48.41 07.357 47.61 49.2331 naeM 26.9702 43.6692 31.21 ES a32.5 c50.4 c38.11 b86.4 c17.52 c50.11 ba33.3 a13.3 1-) g gm( edirahccasyloP ba90.2 cb60.01 ES sgnildees sisnenihcnihcoc aigreblaD fo sevael ni )TAC( esal a56.2 1-1-)ni m WF g 001 U( DOP cb42.01 naeM 36.98 91.54 naeM 05.831 09.78 37.26 45.29 99.521 26.551 32.44 49.26 85.86 57.37 tnemtaert FE lortnoC 001E 002E 003E 004E 006E tnemtaert FE lortnoC 001E 002E 003E 004E 006E
Discussion
The nutritional stages in seedlings subjected to exponential fertilization were divided on the basis of gradient changes in biomass, nutrient content, and nutrient concentration (Salifu and Timmer 2003; Salifu and Jacobs 2006).In the concept model, nutrient content increases as the rate of fertilization increases and peaks at an optimum rate.Further increases in nutrient concentration coincide with toxicity (Salifu and Timmer 2003).Therefore, biomass increases with fertilization application in the deficiency stage, remains unchanged in the luxury consumption stage, and decreases in the toxicity stage.This methodology of dividing the nutritional stages has been successfully used to assess the status of seedlings from black spruce (Picea mariana(Mill.) BSP) (Salifu and Timmer 2003), northern red (Quercus rubraL.) and white oaks (Q.albaL.) (Birge et al.2006; Salifu and Jacobs 2006), Mediterranean oak (Q.ilexL.) (Uscola et al.2015), and Buddhist pine (Podocarpus macrophyllus(Thunb.) Sweet) (Xu et al.2019).Therefore, our first hypothesis is accepted.
However, the dose-response of Thailand rosewood seedlings did not have the same pattern as other seedlings from other studies at the whole-plant scale.This is because wholeplant biomass was not significantly dynamic, although [N and P concentrations increased and remained unchanged from the E300 to the E600 treatments.However, N and P contents increased up to the E200 treatment, then declined to a static level that was the same as the beginning.] The biomass of leaves showed regular responses to fertilization and the luxury consumption can be characterized as rates between the E200 and E400 treatments, while foliar N and P concentrations continuously increased to a stable level in the E300 and E200 treatments, respectively.As a nitrogen-fixing species from the Fabaceae family, the whole-plant nitrogen status of Thailand rosewood seedlings is subject to atmospheric N-fixation (Alvarado et al.2018; Yao et al.2019).However, leaf response shows a pattern as a nutritional sink.Foliar biomass and nutrient concentrations have been evaluated as the dependence to which the nutritional status can be determined (Close et al.2005; Dumroese et al.2005; Everett et al.2007).Therefore, the nutritional response of Thailand rosewood seedlings can be divided into three stages: 0-200, 201-400, and over 400 mg N per plant-1and labeled as deficiency, luxury consumption, and excessive, respectively.
Potassium concentrations in either the leaves or the entire plant decreased as the rate of fertilization increased.Similarly, there was a negative relationship between the response by N and P and the concentrations of K and N, especially in the leaves.The negative relationship between N and K has been corroborated by other studies, and is the result of the competition between NH4+and K+cations for uptake (Salifu and Jacobs 2006; Wei et al.2014; Wang et al.2016).
The response of chlorophyll b and carotenoid concentrations matched that of characterized nutritional responses, but the response of chlorophyll a was different.] This was because seedlings utilize leaf nutrients for photosynthesis for storage (Timmer 1997).A recent study revealed that leaf chlorophyll a functioned to absorb photons from the light spectrum that would benefit photosynthesis and biomass production (Wei et al.2020).Chlorophyll content was not maximized at the optimum level of 300 mg N per plant our second hypothesis is not satisfied.
In our study, polysaccharide levels as well as contents of proline, MDA, and the activities of three antioxidant enzymes, were all greater in the controls and in seedlings treated with the highest rate of fertilizer.The controls had greater contents due to the stress of nutrient deficiency, while seedlings with the highest treatment had greater contents due to excess toxicity.Although nutrient concentrations in Thailand rosewood seedlings were not statistically different between the E400 and E600 treatments, vector analysis has clearly indicated that both of these resulted in excess toxicity.Based on these results, the nutritional stage of luxury consumption was adjusted to be within the range of 200-300 mg N per plant.Again, our second hypothesis is not accepted.However, our third hypothesis is accepted because excess supply induced higher contents of antioxidants.
Conclusions
Seedlings were fertilized in a range of doses from 0 (controls) to 600 mg N per plant.As a legume, Thailand rosewood seedlings did not show regular responses of nutritional status at the whole-plant scale and in the three nutritional stages as other tree species.However, synthetic assessment of foliar response through biomass, nutrition content, physiology, and antioxidants related the range of 0-200, 200-300, and over 300 mg N per plant to the labels of nutrient deficiency, luxury consumption, and excessive toxicity, respectively.Furthermore, exponential fertilization at the rate of 300 mg N per plant can be recommended as the optimum treatment as it maximizes nutrient reserves and bioactive products within stable biomass accumulation without any symptom from excessive fertilizer toxicity.However, given that Thailand rosewood is a species from the Fabaceae family, it was difficult to distinguish the nitrogen source between uptake and atmospheric N-fixation.Future work is needed to detect the effects of N-fixation on the formation of nutritional reserves in Thailand rosewood seedlings subjected to exponential fertilization at the recommended rate.
杂志排行
Journal of Forestry Research的其它文章
- A novel NIRS modelling method with OPLS-SPA and MIX-PLS for timber evaluation
- The dissemination of relevant information on wildlife utilization and its connection with the illegal trade in wildlife
- Endangered lowland oak forest steppe remnants keep unique bird species richness in Central Hungary
- The distribution patterns and temporal dynamics of carabid beetles (Coleoptera: Carabidae) in the forests of Jiaohe, Jilin Province, China
- The disease resistance potential of Trichoderma asperellum T-Pa2 isolated from Phellodendron amurense rhizosphere soil
- Genotype-environment interaction in Cordia trichotoma (Vell.) Arráb.Ex Steud.progenies in two different soil conditions