Ultrafast proton transfer dynamics of 2-(2′-hydroxyphenyl)benzoxazole dye in different solvents
2022-02-24SimeiSun孙四梅SongZhang张嵩JiaoSong宋娇XiaoshanGuo郭小珊ChaoJiang江超JingyuSun孙静俞andSaiyuWang王赛玉
Simei Sun(孙四梅) Song Zhang(张嵩) Jiao Song(宋娇) Xiaoshan Guo(郭小珊)Chao Jiang(江超) Jingyu Sun(孙静俞) and Saiyu Wang(王赛玉)
1Huangshi Key Laboratory of Photoelectric Technology and Materials,College of Physics and Electronic Science,Hubei Normal University,Huangshi 435002,China
2State Key Laboratory of Magnetic Resonance and Atomic and Molecular Physics,Innovation Academy for Precision Measurement Science and Technology,Chinese Academy of Sciences,Wuhan 430071,China
3Hubei Key Laboratory of Pollutant Analysis&Reuse Technology,College of Chemistry and Chemical Engineering,Hubei Normal University,Huangshi 435002,China
The excited-state intramolecular proton transfer of 2-(2′-hydroxyphenyl)benzoxazole dye in different solvents is investigated using ultrafast femtosecond transient absorption spectroscopy combined with quantum chemical calculations.Conformational conversion from the syn-enol configuration to the keto configuration is proposed as the mechanism of excited-state intramolecular proton transfer. The duration of excited-state intramolecular proton transfer is measured to range from 50 fs to 200 fs in different solvents. This time is strongly dependent on the calculated energy gap between the N-S0 and T-S1 structures in the S1 state. Along the proton transfer reaction coordinate,the vibrational relaxation process on the S1 state potential surface is observed. The duration of the vibrational relaxation process is determined to be from 8.7 ps to 35 ps dependent on the excess vibrational energy.
Keywords: proton transfer, vibrational relaxation, femtosecond transient absorption spectroscopy, quantum chemical calculations
1. Introduction
As one of the most important and fundamental photoinduced reactions, excited-state intramolecular proton transfer(ESIPT)is a type of photo-tautomerization of a molecule that includes a hydroxyl group, proton donor and a neighboring proton acceptor.[1]Dyes undergoing ESIPT have been applied in many fields,[2–6]for example as fluorescent chemosensors and probes,[7–10]laser dyes,[11,12]UV photostabilizers,[13]promising components for photoswitches[14,15]and organic optoelectronic materials.[16–21]Following photon absorption,ESIPT dyes are widely acknowledged to undergo apparent geometrical reorganization and then present large Stokes shifts.Generally,the ESIPT process derives from the initial S0structure(enol)and goes back to the same state through a four-level reaction.[22–26]In this reaction,the excited enol and keto forms in the S1state emit short- and long-wavelength fluorescence,respectively.
It is well known that 2-(2′-hydroxyphenyl)benzoxazole(HBO) dye[27,28]and its analog dyes such as 2-(2′-hydroxyphenyl)benzothiazole (HBT)[29,30]and 2-(2′-hydroxyphenyl)benzimidazole (HBI)[31,32]have suitable geometries for ESIPT. The duration of the ESIPT process has been reported as being on the sub-picosecond timescale.[27,28,33–35]Due to the ESIPT effect, HBO and its analog dyes[36,37]have been widely used to produce biological probes and white-light-emitting materials.[4,38–41]Moreover,the introduction of HBO dye into double-stranded DNA can be used to detect a double stranded environment.[42]At present, it is known that HBO dye should be an excellent nonlinear optical material for high-speed and high-sensitivity optical switching devices owing to the ESIPT effect following absorption of the pump pulse rather than a thermal effect.[43]
HBO dye and its derivatives have been widely researched with regard to ESIPT and/or coupled intramolecular charge transfer (ICT).[35,43–49]It was proposed that intramolecular and intermolecular hydrogen bonds contribute to ESIPT and intermolecular proton transfer with solvents,respectively. The timescale of ESIPT was measured by Romesberg and coworkers to be shorter than 170 fs.[38,50]Dynamics simulations of the ESIPT reactions of HBO dye were carried out under the conditions of gas phase and hydration clusters.[35]The results showed that the simulated duration of the ESIPT reaction of HBO dye ranges from 28 fs to 193 fs, and that differences in the duration are due to different initial structures. However,there is still a lack of a direct experimental evidence to confirm the ESIPT time constants simulated in gas and hydrated clusters. On the other hand,dual emission of HBO dye is not shown in all solvents. The long-wavelength emission has consistently been considered as the fluorescence from the S1state of the keto tautomer[38,50–52]and, although contentious, theshort-wavelength emission is considered as fluorescence from the S1state of the anti-enol form or syn-enol form. Moreover,although the differences in the lifetimes of the S1state of the keto tautomer in different solvents are often discussed the differences in ESIPT dynamics and their causes have not been discussed in detail.
In this work, ultrafast femtosecond transient absorption(fs-TA) spectroscopy technology and global fitting were employed to clarify the ESIPT process and the following ultrafast radiative and nonradiative dynamics of HBO dye in cyclohexane, 1,4-dioxane and ethanol. Moreover, quantum chemical(QC)calculations were performed to analyze the excited state dynamics.Three fs-TA spectral bands and three lifetimes were obtained in the fs-TA experiments. The QC calculations were carried out to explain the dynamics of ESIPT and vibrational relaxation(VR).Based on the novel experimental and theoretical results,dual emission of short and long fluorescence was clearly assigned, and a more detailed ESIPT diagram is provided.
2. Experimental and theoretical methods
2.1. Experimental method
HBO dye and solvents (cyclohexane, 1,4-dioxane and ethanol)were purchased from Sigma. With purity higher than 99%, both the solute and solvents were used without further purification. All measurements were performed at room temperature and fresh samples were used for each measurement.The concentration of HBO dye in solvents was set as 1 mM.
A UV-vis spectrometer (INESA, L6) was used to record the steady absorption spectra in a 1 cm quartz cell and a spectrometer(Princeton,SpectraPro 2500i)was used to record the fluorescence spectra in a 1 mm quartz cell. The setup to record the fs-TA spectra was based on the Ti:sapphire femtosecond laser system and has been described in detail in previous works.[53,54]Briefly, the seed beam of the femtosecond laser was generated by a commercial Ti:sapphire oscillator and then amplified to output a fundamental pulse (1 kHz, 1 mJ,35 fs and 800 nm). The 800 nm femtosecond pulse was divided into two beams. One beam with energy of about 4 µJ was focused on a 1 mm CaF2plate to generate a broad-band continuum to obtain signal and reference beams as a probe pulse. The other beam had a higher intensity and was sent to a home-built non-collinear optical parametric amplifier(NOPA)system to generate a pump pulse at a wavelength of 344 nm.A small part of the second beam was also split to generate continuum for the signal of the NOPA system. A 400 nm femtosecond pulse was generated by a beta barium borate(BBO)crystal through second-harmonic generation of the 800 nm femtosecond pulse and used to amplify the signal pulse at the desired 660 nm pulse. An excitation pulse with a wavelength of 344 nm, the energy of which was about 0.6 µJ at the sample position, represented the harmonic generation of the 800 nm and 660 nm pulses by the BBO crystal. The NOPA pulses were temporally compressed to give the minimum pulse width,which was completed by prism gratings. The geometry and polarization between the excitation and signal pulses were set as~4°and the magic angle, respectively, with the reference beam transmitting through the sample at a different spot. The delay time between the probe and pump beam was realized and monitored by a linear translation stage. A spectrometer(Princeton, SpectraPro 2500i), equipped with a CCD camera(PI-MAX,1024×256 pixel array)was used to detect the fs-TA spectra.The optical Kerr gate method was used to measure the instrumental response function, which is typically better than 100 fs at wavelengths shorter than 500 nm,and a little longer at a wavelength of 650 nm.
2.2. Theoretical method
All QC calculations were carried out using the Gaussian16W.[55]PBE1PBE method with a 6-311G(d,p)basis set was used to optimize the geometries of the S0and S1states of HBO dye in the gas phase, cyclohexane, ethanol and 1,4-dioxane.Vibrational frequencies were analyzed to confirm the stationary points.The energies of the ground and excited states were calculated using the PBE1PBE function at the optimized structures of the S0and S1states. The Boltzmann distribution of different configurations in the S0state was also found according to the energy of the S0state of different configurations using the program Molclus.[56]Using the polarizable continuum model with the integral equation formalism,a selfconsistent reaction field was used to consider the effect of the bulk solvent dielectric,which is expected to affect the geometries and energies of the ground and excited states.
3. Results and discussion
3.1. Configurations in the S0 and S1 states
As shown in Fig. 1, the S0state geometry of HBO dye was optimized in the gas phase and three solvents, starting with enol and keto structures and ending only with enol forms,where the enol forms have local minima and no virtual frequencies. In the S0state, there are four enol configurations of HBO dye: 1, syn-enol; 2, anti-enol; 3, anti-enol open; 4,syn-enol open (shown in Fig. 1(a)). The calculated energies and Boltzmann distribution of the four configurations in gas and solvents in the S0state are listed in Table 1. The results show that the normal syn-enol form,denoted as the N-S0structure, has the lowest energy. The normal syn-enol form in the S0state is most stable, the population of which is dominant whether it is in the gas phase or solvents. Compared with the Boltzmann distribution in the gas phase,cyclohexane and 1,4-dioxane, the distribution in ethanol is different. The results show the proportion of anti-enol form is not zero but still very small, indicating that the anti-enol open structure may exist but its probability is very small.

Table 1. The energy difference ΔE related to the energy of the most stable configuration and the Boltzmann distribution of different configurations of HBO dye in the ground state in gas and different solvents at room temperature.
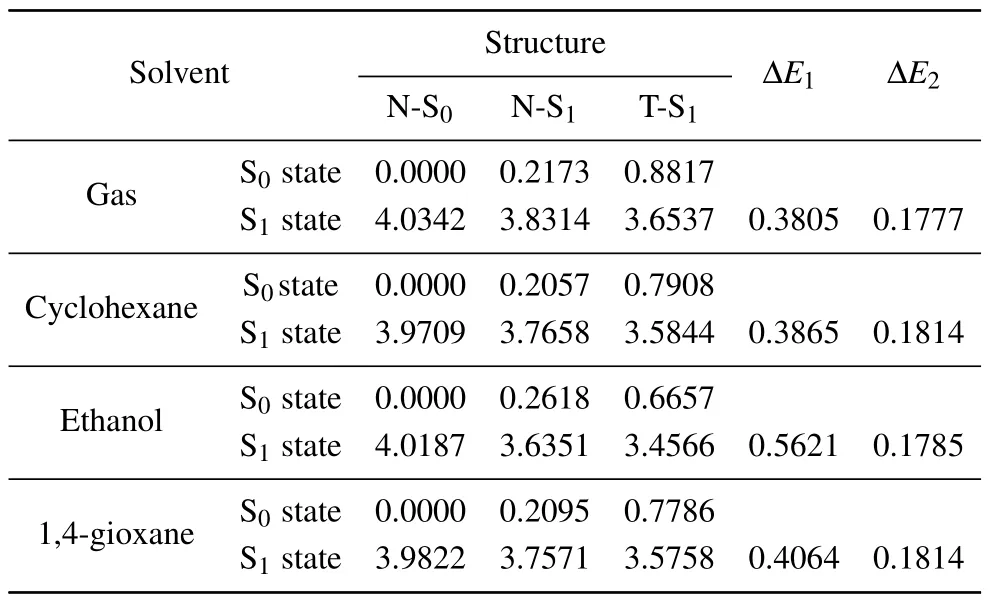
Optimization of S1state geometry was also performed on syn-enol and keto structures in the gas phase and solvents.The symbols N-S1and T-S1are used to refer to the optimized S1state structure of syn-enol and keto forms(shown in Fig.1(b)),respectively. The energy of the S1state of the T-S1structure is slightly lower than that of the N-S1structure, as listed in Table 2. This indicates that the keto tautomer is more stable than the syn-enol form in the S1state. Since the keto tautomer of HBO dye in the S0state has no local minima, it is unstable and can easily return to the normal syn-enol form in the S0state.[38,43,47]In Table 2,ΔE1and ΔE2represent the energy gaps of the N-S0and N-S1structures,respectively,compared with that of the T-S1structure in the S1state. It is found that ΔE1and ΔE2possibly stand for the ability for the ESIPT process and excess vibrational energy,respectively.

Fig.1. Optimized configurations of HBO dye in the gas phase in the S0 state(a)and the S1 state(b).
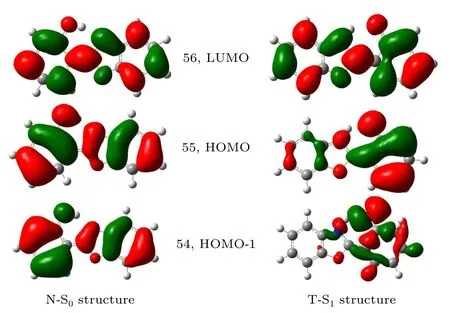
For convenience, only the frontier molecular orbits were calculated in the gas phase. Figure 2 shows three molecular orbits of the N-S0and the T-S1structures. Calculated results show that the S1state of the N-S0structure has a large transition strength and is dominated by the 56←55 transition with an energy of 4.0342 eV. The S2state of the N-S0structure mainly corresponds to the 56←54 transition, the transition strength of which is much weaker than that of the S1state.The 55 and 56 orbits belong toπandπ∗orbits and correspond to the highest occupied molecular orbital(HOMO)and lowest unoccupied molecular orbital (LUMO), respectively. Consequently, it is determined that the excitation to the S1state of the N-S0structure is strongly allowed with the dominant transition from HOMO to LUMO, while the excitation to the S2state is weaker with the transition from HOMO-1 to LUMO.The frontier molecular orbits of the N-S1structure were also calculated in the same way as that of the N-S0structure. The results are similar to that of the N-S0structure. As shown in Fig. 2, due to the structural reorganization, the molecular orbits of the T-S1structure are quite different from those of N-S0structure.

Table 2.The vertical energies(eV)of the S0 and S1 states of the N-S0,N-S1,and T-S1 structures of HBO dye in gas and different solvents. ΔE1=S1(NS0)−S1(N-S1),ΔE2=S1(N-S1)−S1(T-S1).

Fig.2. Frontier orbitals in the gas phase: HOMO-1,HOMO and LUMO of HBO dye at equilibrium geometries of the N-S0 (left)and T-S1 (right)structures. Calculations were performed based on the PBE1PBE method with the 6-311G(d,p)basis set.
3.2. The assignment of long-and short-wavelength fluorescence
Figure 3 depicts the steady absorption and fluorescence spectra of HBO dye in cyclohexane,1,4-dioxane and ethanol.At wavelengths longer than 300 nm there are two absorption peaks which are a small blue shift with the increasing polarity of the solvents. The peaks at 332 nm and 320 nm were assigned to the syn-enol and anti-enol open tautomer of HBOdye, respectively.[38,40]The Boltzmann distribution of different configurations of HBO dye in the S0state shows that the proportion of syn-enol form in the gas phase and three solvents is almost 100%,which indicates that the syn-enol form is absolutely dominant. So,the 320 nm peak could not be assigned to the absorption of the anti-enol open form. It may be due to higher excited states or the S1state with higher vibrational energies.
The steady fluorescence spectra of HBO dye in cyclohexane and 1,4-dioxane show a strong and broad band around 510 nm. This long-wavelength fluorescence band with a large Stokes shift can be consistently assigned to the emission from the excited keto form transferred from the excited synenol.[50–52]The long-wavelength fluorescence, with strong intensity and large Stokes shift, proves an easy and effective process for ESIPT. The long-wavelength fluorescence of HBO dye in ethanol is blue shifted to 495 nm compared with that in 1,4-dioxane and cyclohexane. Furthermore, the shortwavelength band around 390 nm in ethanol is much weaker than the long-wavelength band, and was previously assigned to the emission from the excited syn-enol tautomer or excited anti-enol open tautomer.[38,43,50]
However, the excitation wavelength of 344 nm used in this experiment is located at the absorption edge of the synenol form. It is indicated that the syn-enol form of HBO dye is most easily excited here.Consequently,we assign the shortwavelength fluorescence to the emission from the S1state of the syn-enol form. This viewpoint is also supported by the phenomenon in the fs-TA spectra in which the decay of the short-wavelength stimulated emission (SE) signal is distributed to the rise of the long-wavelength SE signal.

Fig. 3. Steady absorption and fluorescence spectra of HBO dye in 1,4-dioxane (blue), ethanol (green) and cyclohexane (red). Fluorescence spectra were measured upon excitation at 344 nm.
3.3. The ESIPT dynamics
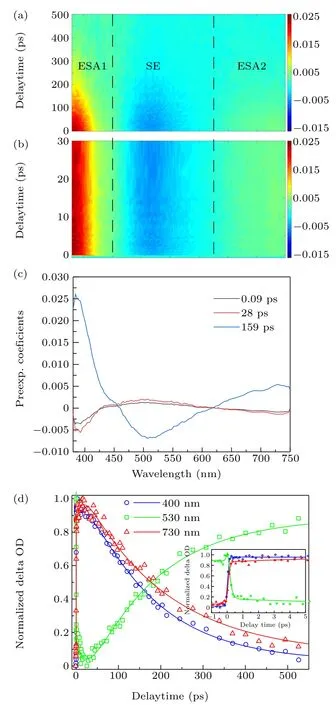
The fs-TA spectra of HBO dye at delay times within 30 ps and 500 ps are shown in Figs.4(a)and 4(b),respectively. The fs-TA spectra were recorded from 380 nm to 750 nm upon excitation at 344 nm,and three broad bands were observed. The red,first band of positive signal with wavelength shorter than 450 nm is attributed to excited state absorption (ESA1). The blue, second band of negative signal from 450 nm to 620 nm is from SE.The red, third band of positive signal with wavelength longer than 620 nm is assigned to ESA2. Obviously,all the three bands are completely attenuated to zero within 500 ps.

Fig. 4. Broad fs-TA spectra of HBO dye in 1,4-dioxane at 0 ps–500 ps(a)and 0 ps–30 ps(b). The decay-associated difference spectra(DADS)and the corresponding lifetime (c) and the time profiles at the selected wavelengths(d).
In order to accurately analyze the dynamics of HBO dye observed in the fs-TA spectra in 1,4-dioxane, singular value decomposition analysis and global fitting were performed onthe two-dimensional data matrix, which outputs three DADS components with lifetimes of 90 fs(τ1),28 ps(τ2)and 159 ps(τ3), shown in Fig. 4(c). The longitudinal coordinates of DADS are the pre-exponential factors of the related lifetime components and present the relative contribution at each wavelength. There is more than one spectral component at some wavelengths since the signals originating from different states overlap at some wavelengths.
The temporal behavior of the ESA1,SE and ESA2 signals is described by the decay of typical wavelengths of 400 nm,530 nm, and 730 nm, respectively. In Fig.4(d), the fitted decay curves match well with the experimental traces,indicating that the results of global analysis are credible.The fs-TA spectra,DADS spectra and time profiles of HBO dye in ethanol and cyclohexane are shown in Figs. S1 and S2, respectively. The global fitted time constants of HBO in three solvents,as well as the polarity and viscosity of solvents,are list in Table 3.

Table 3. The polarity, viscosity and time constants of HBO dye in cyclohexane,ethanol and 1,4-dioxane.
The long-wavelength emission with strong intensity and broad bandwidth of the keto tautomer reasonably indicates that it is easy to experience the ESIPT process—from the syn-enol form to the keto tautomer in the S1state(Fig.5).[38,43,50]The 159 ps blue component of DADS,shown in Fig.4(c),is dominant, including positive signals of wavelengths shorter than 450 nm or longer than 620 nm,and negative signals of wavelengths between 450 nm and 620 nm. The three areas correspond to ESA1,SE and ESA2 bands of the broad fs-TA spectra of HBO dye in 1,4-dioxane, shown in Figs.4(a)and 4(b),respectively. Since the peak of the SE band is in accordance with the steady fluorescence,it is indicated that the component of several hundreds ps derives from the S1state of the keto tautomer.[50]The ESA1 and ESA2 bands could be assigned to the S1→Smand S1→Snabsorption of the keto tautomer.
In Figs.S1 and S2,the delay times of 128 ps and 265 ps are assigned to the S1state lifetimes of the keto tautomer in ethanol and cyclohexane, respectively. Glasbeek concluded that the S1state lifetime of the keto form decreases with decreasing solvent viscosity and increasing solvent polarity.[50]In this work,the S1state lifetime of the keto tautomer of HBO dye was measured to be from 128 ps to 265 ps in different solvents. It is seen that the lifetime of the keto tautomer shows an obvious contrary trend to the solvent polarity, which is in accordance with the results of time-resolved fluorescence[38]and femtosecond fluorescence upconversion.[50]However, it is a little unusual that the lifetime of the keto tautomer in 1,4-dioxane is somehow longer than that in ethanol. This is possibly due to the intermolecular hydrogen-bond interaction between ethanol and N or O atoms of HBO.[48]Moreover, we did not observe the phenomenon that the S1state lifetime of the keto tautomer decreases with decreasing solvent viscosity.

Fig.5.Schematic diagram of the ESIPT dynamics of HBO dye.The Franck–Condon excitation is presented by the blue arrow. The short-wavelength emission from the syn-enol form is confirmed and is very weak because of the barrierless ESIPT process. The VR process existing in the S1 state potential and the long-wavelength emission from the keto tautomer is strong for the ultrafast ESIPT process. Because of the unstable structure,the keto form returns to the syn-enol form easily in the S0 state.
As listed in Table 2, the energy of the T-S1structure in the S1state is about 0.2 eV lower than that of the N-S1structure and the duration of ESITP process is on the femtosecond scale. This theoretically and experimentally illustrates a barrierless S1potential and an ultrafast ESIPT process of HBO.The barrierless ESIPT process promotes the keto fluorescence and quenches the enol fluorescence. This is supported by the fact that no obvious or strong short-wavelength steady fluorescence can be observed in the three solvents. The 90 fs black component of DADS has a remarkable negative signal before 420 nm. This short-wavelength SE band is not obviously shown in Fig. 4(a) because it is overlapped and submerged into the ESA1 band. The pre-exponential factor of the black component is contrary to that of the blue component, indicating that the attenuation of the short-wavelength SE band contributes to the appearance of the long-wavelength SE band. This shows that the decay of the state assigned to the black component results in a rise of the state assigned to the blue component. Consequently, the black component could be assigned to the S1state of the syn-enol configuration, and the duration of 90 fs should be assigned to the ESIPT process,which was inferred as 170 fs owing to the limit of the instrumental response function.[50]
The 0.05 ps and 0.20 ps components are assigned to the ESIPT process in ethanol and cyclohexane,respectively. The ESIPT time in 1,4-dioxane and ethanol is obviously shorter than that in cyclohexane. The energy gap ΔE1between the NS0and T-S1structures in the S1state in cyclohexane,ethanoland 1,4-dioxane is 0.3865 eV, 0.5621 eV, and 0.4064 eV,respectively, and the corresponding ESIPT time is 0.20 ps,0.05 ps, and 0.09 ps, respectively. It is concluded that the duration of the ESIPT process decreases with increasing energy gap ΔE1. The higher the energy gap ΔE1,the steeper the potential energy surface of the S1state. The steepness indicates the ease of the ESIPT process, wherein ethanol solvent environment provides a higher ΔE1to promote a faster ESIPT process.
3.4. VR process
According to the timescales of the red component in Fig. 4 and Figs. S1, S2, the corresponding process could be assigned to the VR process,[38,50]shown in Fig.5. The behavior of the red DADS spectra is different in the three solvents.The pre-exponential factor of the red DADS spectrum in 1,4-dioxane is opposite to that of the blue DADS spectrum,while the pre-exponential factor of the red DADS spectrum in cyclohexane is synonymous to that of the blue DADS spectrum and that in ethanol is much more complex and irregular.These phenomena show a complicated VR process.
The energy gap ΔE2between the N-S1and T-S1structures in the S1state may represent the excess vibrational energy on the S1state potential. The excess vibrational energy could dissipate by intramolecular or intermolecular interactions. The more greater the excess vibrational energy, the longer the time needed for the VR process. In ethanol, the excess vibrational energy is 0.1785 eV and the duration of the VR process is 8.7 ps, whereas the excess vibrational energy in both 1,4-dioxane and cyclohexane is 0.1814 eV and the duration of the VR process is lengthened to 28 ps and 35 ps,respectively. Compared with timescale of VR in cyclohexane and 1,4-dioxane, that in ethanol is significantly reduced.Consequently, in ethanol, the VR process not only occurs in intramolecular systems but also may occur in intermolecular systems. Intermolecular interaction may due to the interaction between solvents and the N or O atoms of HBO.Moreover,according to the Einstein formula,the theorical lifetime of the S1state of the keto form can be calculated asτ=1.5/(f×ΔE2).The S1←S0vertical transition energy/strength of the T-S1structure is 2.7945 eV/22539.7 cm−1and 0.3172 in ethanol,giving a keto lifetime 6.31 ns. The theorical lifetime is much longer than the experimental data of 128 ps.This indicates that there may exist some nonradiative processes such as internal conversion and external conversion.
4. Conclusion
The ESIPT dynamics of HBO dye in three solvents were investigated by ultrafast experiments combined with theoretical calculations. The calculated results show that only four enol configurations exist in the S0state, and the Boltzmann distribution shows that the syn-enol form is absolutely dominant. In the S1state, however, enol and keto forms are obtained and the dominant keto fluorescence shows an easy ESIPT process. The ESIPT process occurs within 50 fs–200 fs and strongly depends on the energy gap ΔE1between the NS0and T-S1structures in the S1state. The VR process has also been observed and takes 8.7 ps–35 ps in different solvents. The VR process is obviously dependent on the excess vibrational energy ΔE2. The S1state lifetime of the keto form following the ESIPT process depends on the polarity of the solvent. This work yields a physical principal and clear mechanism for the photoinduced ESIPT dynamics in HBO dye,and provides theoretical guidance for the design and implementation of optical switching devices.
Acknowledgments
Project supported by the Natural Science Foundation of Hubei Province,China(Grant No.2020CFB468),the Guiding Project of Scientific Research Plan of Department of Education of Hubei Province,China(Grant No.B2020136),and the National Key Research and Development Program of China(Grant No.2019YFA0307700),and the National Natural Science Foundation of China (Grant Nos. 11974381, 11674355,and 21507027).
猜你喜欢
杂志排行
Chinese Physics B的其它文章
- A broadband self-powered UV photodetector of a β-Ga2O3/γ-CuI p-n junction
- High-sensitive terahertz detection by parametric up-conversion using nanosecond pulsed laser
- High efficiency,small size,and large bandwidth vertical interlayer waveguide coupler
- High-fidelity resonant tunneling passage in three-waveguide system
- An analytical model for cross-Kerr nonlinearity in a four-level N-type atomic system with Doppler broadening
- Determine the physical mechanism and source region of beat wave modulation by changing the frequency of high-frequency waves
