Effects of Tuina combined with graded motor imagery on the upper-limb motor function and quality of life of patients with hemiplegia after stroke
2022-02-24LIUZejiang刘泽江
LIU Zejiang (刘泽江)
Lu’an People’s Hospital of Anhui Province, Lu’an 237005, China
Abstract
Keywords: Tuina; Massage; Graded Motor Imagery; Poststroke Syndrome; Hemiplegia; Motor Function; Quality of Life
Hemiplegia is one of the common sequelae of stroke that gravely hinders patients’ activities of daily living(ADL) and quality of life (QOL). As rehabilitation medicine develops, poststroke hemiplegic patients can hopefully improve or even recover the function of the affected limbs through exercise rehabilitation. As an essential component of exercise rehabilitation therapy,motor imagery enhances motor abilities by activating the relevant brain areas with motor memories. Based on this, graded motor imagery (GMI) includes mirror movement observation and imitation and has been proven to improve the motor function of poststroke hemiplegic patients[1]. Nevertheless, most of the patients also suffer from shoulder pain and spasms,which significantly affect the motion and rehabilitation of the affected upper limb[2-3]and impair the effectiveness of GMI. Tuina (Chinese therapeutic massage), one of the traditional Chinese medicine (TCM)therapies, can relax tendons, activate collaterals, release spasms, and cease pain[4]. It can significantly reduce pain in the neck, shoulders, back, and legs and alleviate spasms. To date, the integrated use of Tuina and GMI to treat poststroke hemiplegia has rarely been reported,and the clinical efficacy thus requires further investigation. Therefore, we adopted GMI and Tuina together to treat hemiplegic patients after stroke and observed its impact on the patients’ upper-limb motor function and QOL.
1 Clinical Materials
1.1 Diagnostic criteria
Referred to the diagnostic criteria for stroke stipulated by the Fourth National Conference on Cerebrovascular Diseases[5].
1.2 Inclusion criteria
It was the first onset, and head CT or MRI examination confirmed that the hemorrhagic or ischemic lesions conformed to the diagnosis of stroke; upper-limb motor dysfunction accompanied by shoulder pain and spasms of the affected limb occurred after the stroke; the patient’s condition was stable; the patients had good compliance.
1.3 Exclusion criteria
The patient had other types of intracranial disease; the patient had severe coagulation disorders, liver dysfunction, or kidney dysfunction; the patient had severe mental disorders, cognitive impairment,dementia, or a coma; the patient simultaneously participated in other clinical interventional trials.
1.4 Elimination and dropout criteria
The patient was transferred to another hospital, gave up treatment, or did not cooperate in the treatment.
1.5 Statistical methods
SPSS version 25.0 statistical software was used for data analyses. The measurement data, including the results of Fugl-Meyer assessment for upper extremity(FMA-UE), Brunnstrom staging, box and block test (BBT),co-contraction ratio (CR), visual analog scale (VAS) for shoulder pain, modified Ashworth scale (MAS), modified Barthel index (MBI), short-form 36-item health survey(SF-36), all conformed to normal distribution checked by the Kolmogorov-Smirnov test. Thus, they were examined by independent samplest-test in between-group comparisons and pairedt-test in intra-group comparisons. The counting data were expressed as ratio(%) and examined using the Chi-square test. A two-tailed test was applied throughout the statistical processing withα=0.05, andP<0.05 stood for statistical significance.
1.6 General data
The Ethics Committee of Lu’an People’s Hospital of Anhui Province approved this trial (Approval No.201701304). We also achieved agreement from the patients and their families and obtained the consent form before starting. The entire treatment process rigorously followed the ethical principle and protected the patients’ privacy and safety. This trial included a total of 216 patients diagnosed with hemiplegia after a hemorrhagic or ischemic stroke who were admitted to the Rehabilitation Department between March 2017 and March 2019. They were randomized into an observation group and a control group at 1:1 by tossing a coin, with 108 cases in each group. There were no dropouts during the treatment process. There were no significant differences in the gender, age, body mass index (BMI), lesion location, hemiplegic regions, or National Institute of Health stroke scale (NIHSS) score between the two groups (P>0.05). The details are shown in Table 1.
2 Treatment Methods
Treatments for blood pressure control, anticoagulation, and nervous system assistance, and routine physical and occupational therapies were provided.Physical therapy included training in sitting, standing,and weight-support walking positions. Occupational therapy included passive and active assistant training of the affected limb, and grasping and turning screws.These treatments were performed once a day, 45 min each time, 5 d each week, for a total of four consecutive weeks.
2.1 Control group
In addition to the primary treatments mentioned above, patients in the control group were offered GMI with four stages.
Left/right discrimination: Took limb or hand images as examples to let the patient identify left or right sides(printed or displayed on a computer screen).
Imagining movements of the affected limbs: A mirror of appropriate size was placed on the work surface. The patient put the healthy upper limb in front of the mirror and the affected upper limb behind. The patient then focused on the movements of the healthy hand in the mirror and tricked the brain into believing that it was the affected hand that was moving through the reflection.The patient would be asked to imagine the affected side performing the same movements. Each movement was repeated 20 times.
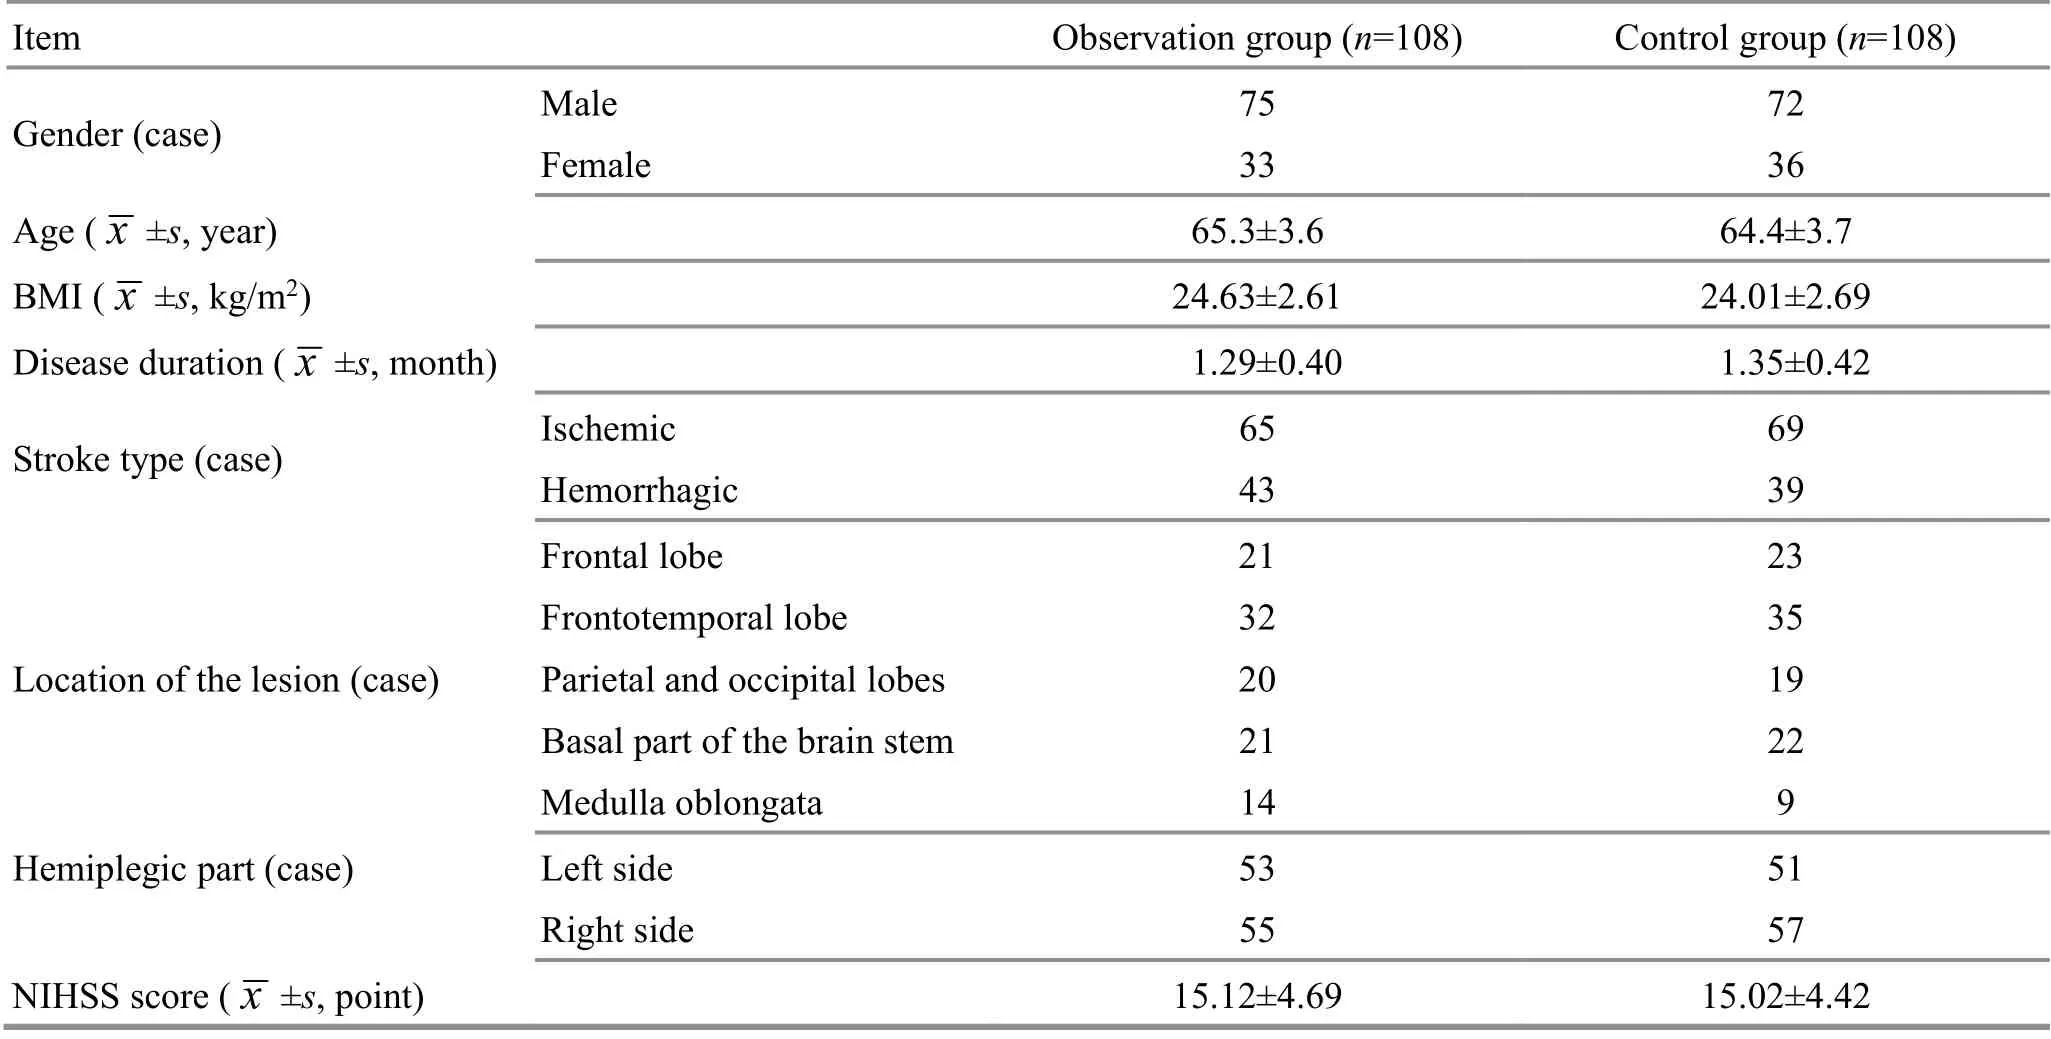
Table 1. Comparison of the general data
Mirror movements of the healthy hand: With the same settings in stage two, the patient performed different movements with the healthy hand, such as forming the shape of a heart, showing OK, and putting the thumb up while keeping the affected hand static. The patient was also asked to imagine the affected hand moving while focusing on the mirror. The movements were repeated 20 times.
Mirror movements of both hands: The patient was asked to focus on the mirror while trying his/her best to move both hands and imagine the hands moving simultaneously. Each movement was repeated 20 times.The degree of difficulty gradually increased based on the upper limb’s recovery status. However, the training should stop once the patient feels uncomfortable.
This program was conducted once a day, 45 min each session, 5 d a week, for four consecutive weeks.
2.2 Observation group
Patients in the observation group received extra Tuina treatment based on the intervention given to the control group. While the patient was lying on his/her side, the physician applied Dian-Digital pressing, An-pressing,Rou-Kneading, and Tanbo-Plucking manipulations to relax the affected scapular and upper-limb muscles. The intensity should be within the patient’s comfort threshold. Acupoints Jianjing (GB21), Jianqian (Extra),Bingfeng (SI12), Jianyu (LI15), Binao (LI14), Jiquan (HT1),Quchi (LI11), Tianzong (SI11), Gaohuang (BL43), Jiaji(EX-B2), Neiguan (PC6), and Hegu (LI4) were treated in particular with An-Pressing and Rou-Kneading manipulations. The manipulations should cause sore and During the Tuina treatment, one-thumb Tui-Pushing,Fen-Parting tendon Tui-Pushing, Dian-Digital pressing,and Tanbo-Plucking were taken as the major manipulations (Figure 1-Figure 4).distending feelings within the patient’s tolerance.

Figure 1. One-thumb Tui-Pushing manipulation
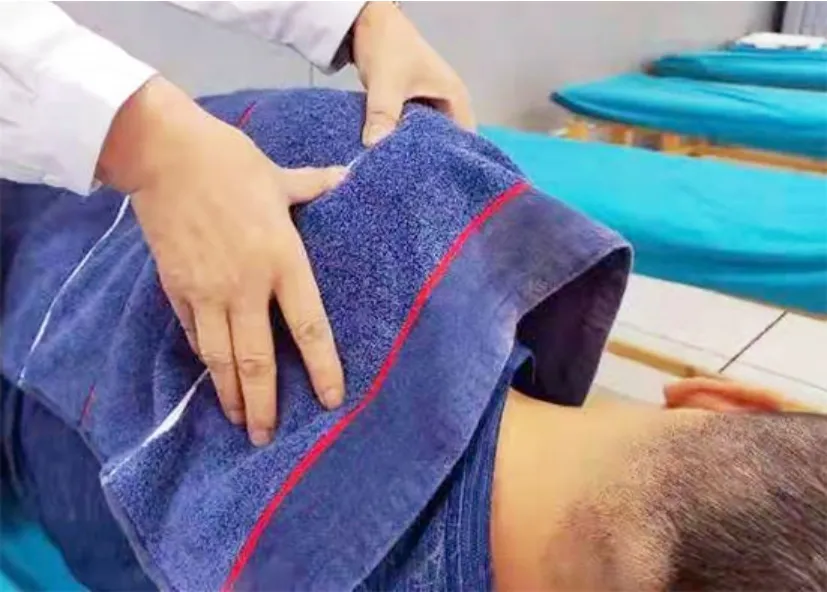
Figure 2. Fen-Parting tendon Tui-Pushing manipulation

Figure 3. Dian-Digital pressing manipulation
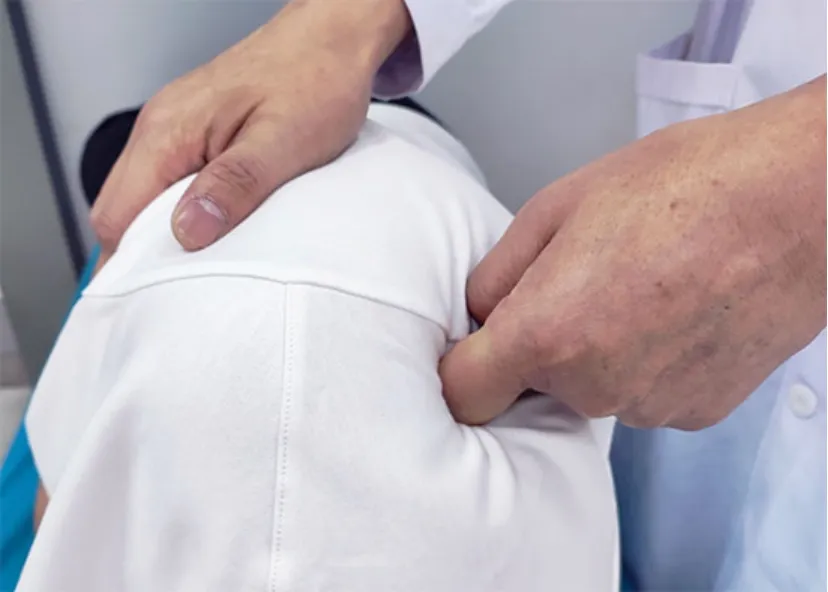
Figure 4. Tanbo-Plucking manipulation
The Tuina treatment was performed once a day,30 min each session, 5 d each week, for four consecutive weeks.
3 Observation of Therapeutic Efficacy
3.1 Observation items
3.1.1 Upper-limb motor function evaluation
Before and after the 4-week treatment, a professional therapist evaluated the patients’ upper-limb motor function. The FMA-UE was used to evaluate reflex activities, synergy movements of flex/extensor muscles,isolated movements, wrist stability, hand coordination,and speed with 10 items[6]. The total mark was 66 points.A higher score indicated lower severity of motor dysfunction.
The Brunnstrom six staging scale was adopted to define the stage of the upper-limb and hand functions from the perspectives of motor function and muscle tension[7]. Brunnstrom stage Ⅰ was scored 1 point, and a higher score stood for a better upper-limb motor function.
BBT was used to test the hand function by recording the number of the 3 cm3cube that the patient managed to move from one side of a box to the other side within 60 s[8].
The SA7550 FlexComp infinity system (surface electromyography analysis system, Thought Technology,Canada) was used to collect the integrated electromyograms (iEMG) of biceps brachii and triceps brachii at the maximum isometric contractions, both flexion and extension, to calculate the CR. CR (%) = iEMG of the antagonists ÷ (iEMG of the agonists + iEMG of the antagonists) × 100%[9].
3.1.2 Shoulder pain and spasm intensity evaluation
Before and after the 4-week treatment, shoulder pain intensity was measured by VAS with the VAS card manufactured under the supervision of the Chinese Medical Association. One end of the card represents no pain (0 point), and the other represents the most intensive pain (10 points), which means that the higher the VAS score, the more severe the pain[10]. MAS was used to evaluate muscle tone. The MAS score ranges from 0 to 4 points. The higher the MAS score, the higher the muscle tone[11].
3.1.3 ADL and QOL evaluation
Before and after the 4-week treatment, the MBI was used to score the patients’ ADL in a range of 0-100 in the performance of toilet use, dining, transferring, dressing,climbing stairs, etc. A higher score indicates a higher level of daily living ability[12]. SF-36 estimates the patients from eight domains: role-physical, physical functioning, bodily pain, and general health, etc. The higher the general score, the higher the rating of QOL[13].
3.2 Results
3.2.1 Comparisons of the FMA-UE score, upper-limb Brunnstrom staging score, and upper-limb CR
Prior to the treatment, there were no significant differences in the FMA-UE score, upper-limb Brunnstrom staging score, CR of the biceps brachii at flexion, or CR of the triceps brachii at extension between the two groups(P>0.05). After the 4-week treatment, the scores of FMAUE and upper-limb Brunnstrom staging increased in both groups (P<0.05), and the CR of biceps brachii at flexion and the CR of triceps brachii at extension declined(P<0.05). After the 4-week treatment, the scores of FMAUE and upper-limb Brunnstrom staging were higher, and the CR of biceps brachii at flexion and the CR of triceps at extension were lower in the observation compared with the control group (P<0.05). The details are shown in Table 2-Table 4.
3.2.2 Comparisons of the hand Brunnstrom staging and BBT scores
There were no significant differences in the hand Brunnstrom staging or BBT scores between the two groups before the treatment (P>0.05). After the 4-week treatment, the hand Brunnstrom staging and BBT scores increased in both groups (P<0.05) and were higher in the observation group than in the control group (P<0.05).The results are shown in Table 5-Table 6.
3.2.3 Comparisons of the ADL, shoulder pain intensity,and spasm
There were no significant differences in the MBI, VAS,or MAS scores between the two groups prior to the treatment (P>0.05). After the 4-week treatment, the MBI score increased (P<0.05), and the VAS and MAS scores dropped in both groups (P<0.05). After the 4-week treatment, the MBI score was higher in the observation group than in the control group (P<0.05), and the VAS and MAS scores were lower in the observation group(P<0.05). The results are presented in Table 7-Table 9.
3.2.4 Comparison of QOL
There were no significant differences in the SF-36 subscale scores between the two groups before the treatment (P>0.05). The SF-36 scores increased in both groups after the 4-week treatment (P<0.05) and were higher in the observation group than in the control group(P<0.05). The results are shown in Table 10-Table 17.
Table 2. Comparison of the FMA-UE score before and after the treatment ( ±s, point)
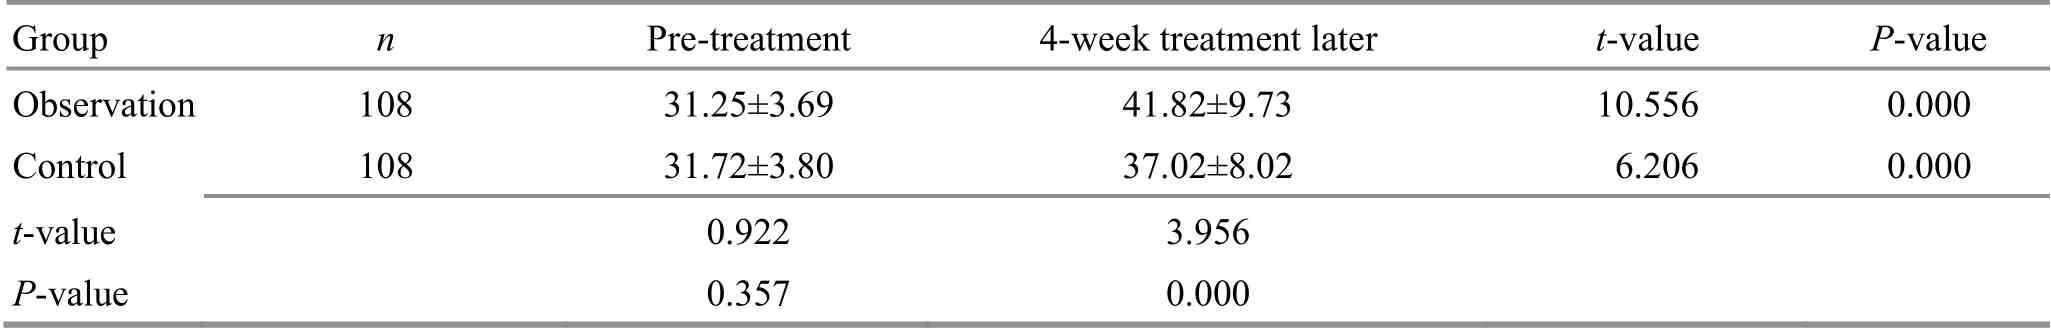
Table 2. Comparison of the FMA-UE score before and after the treatment ( ±s, point)
Group n Pre-treatment 4-week treatment later t-value P-value Observation 108 31.25±3.69 41.82±9.73 10.556 0.000 Control 108 31.72±3.80 37.02±8.02 6.206 0.000 t-value 0.922 3.956 P-value 0.357 0.000
Table 3. Comparison of the upper-limb Brunnstrom staging score before and after the treatment ( ±s, point)
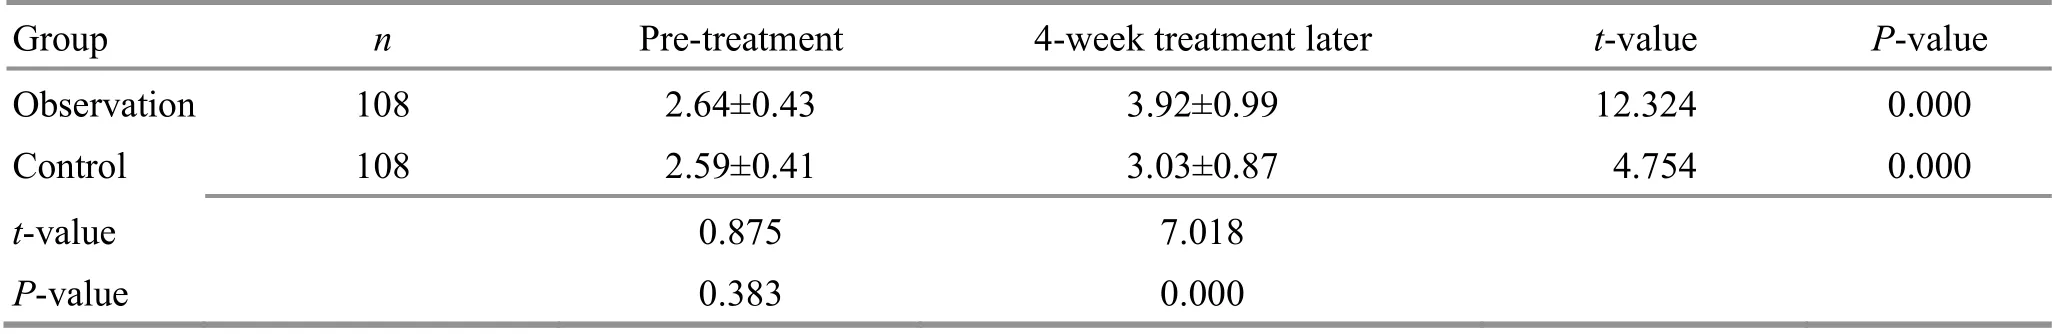
Table 3. Comparison of the upper-limb Brunnstrom staging score before and after the treatment ( ±s, point)
Group n Pre-treatment 4-week treatment later t-value P-value Observation 108 2.64±0.43 3.92±0.99 12.324 0.000 Control 108 2.59±0.41 3.03±0.87 4.754 0.000 t-value 0.875 7.018 P-value 0.383 0.000
Table 4. Comparison of the co-contraction ratio (CR) of upper-limb muscles before and after the treatment ( ±s, point)
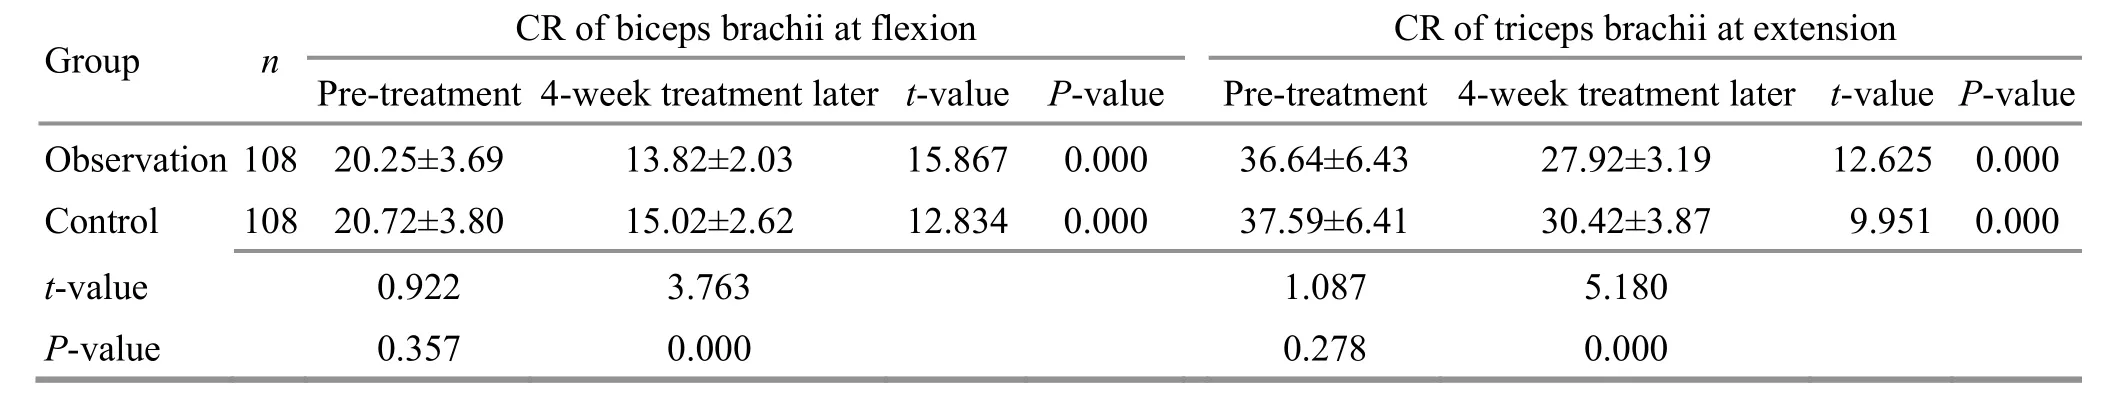
Table 4. Comparison of the co-contraction ratio (CR) of upper-limb muscles before and after the treatment ( ±s, point)
Group n CR of biceps brachii at flexion CR of triceps brachii at extension Pre-treatment 4-week treatment later t-value P-value Pre-treatment 4-week treatment later t-value P-value Observation 108 20.25±3.69 13.82±2.03 15.867 0.000 36.64±6.43 27.92±3.19 12.625 0.000 Control 108 20.72±3.80 15.02±2.62 12.834 0.000 37.59±6.41 30.42±3.87 9.951 0.000 t-value 0.922 3.763 1.087 5.180 P-value 0.357 0.000 0.278 0.000
Table 5. Comparison of the hand Brunnstrom staging score before and after the treatment ( ±s, point)
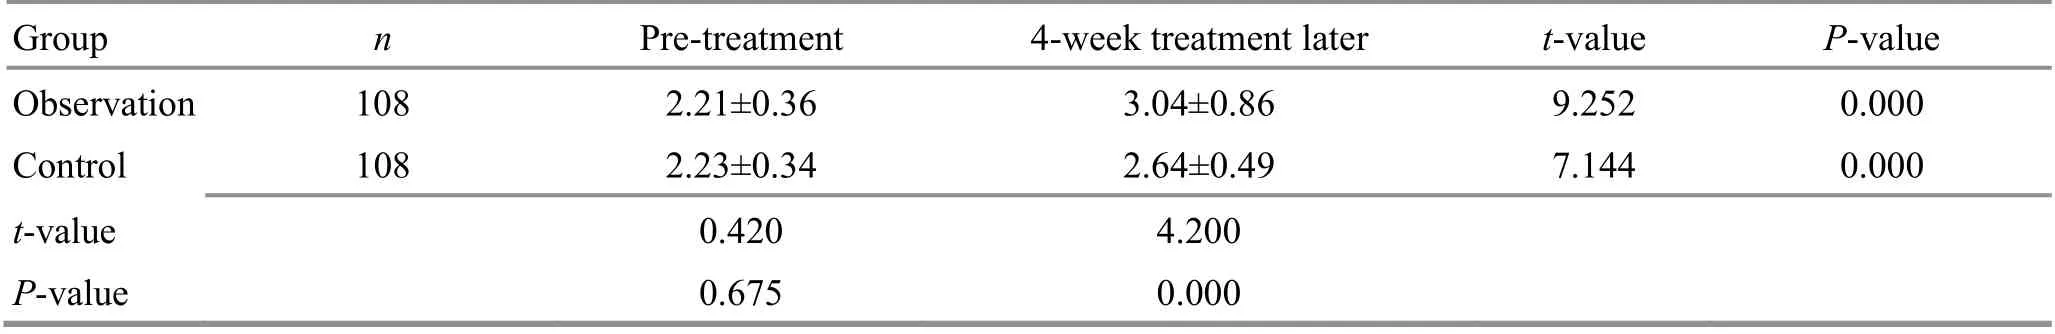
Table 5. Comparison of the hand Brunnstrom staging score before and after the treatment ( ±s, point)
Group n Pre-treatment 4-week treatment later t-value P-value Observation 108 2.21±0.36 3.04±0.86 9.252 0.000 Control 108 2.23±0.34 2.64±0.49 7.144 0.000 t-value 0.420 4.200 P-value 0.675 0.000
Table 6. Comparison of the hand BBT before and after the treatment ( ±s, number)

Table 6. Comparison of the hand BBT before and after the treatment ( ±s, number)
Group n Pre-treatment 4-week treatment later t-value P-value Observation 108 2.03±0.26 4.71±0.99 27.210 0.000 Control 108 2.05±0.31 3.69±0.67 23.086 0.000 t-value 0.514 8.867 P-value 0.608 0.000
Table 7. Comparison of the MBI score before and after the treatment ( ±s, point)
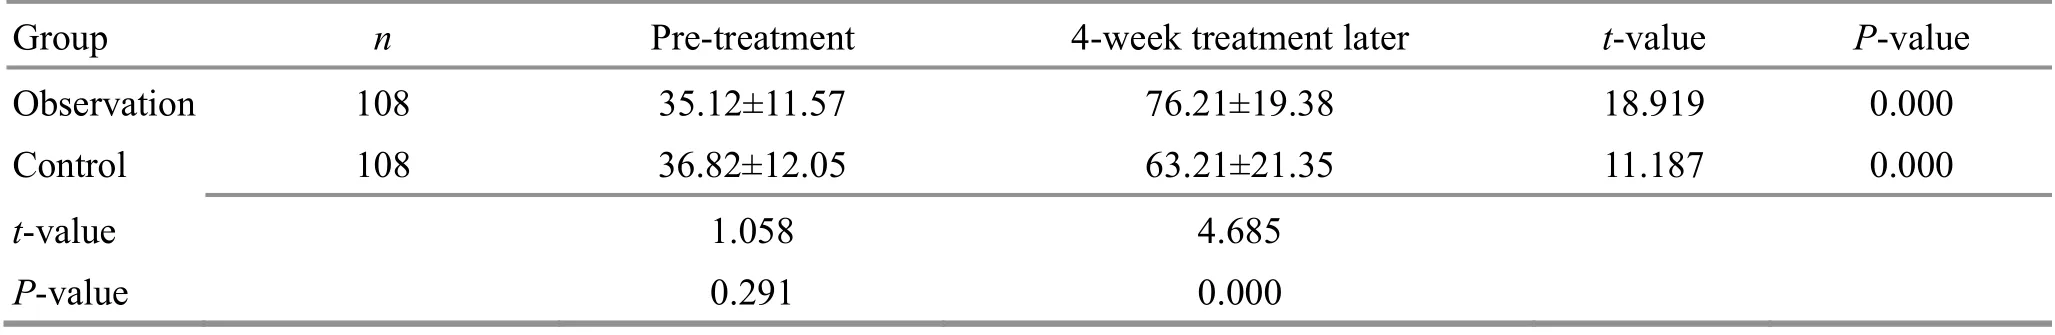
Table 7. Comparison of the MBI score before and after the treatment ( ±s, point)
Group n Pre-treatment 4-week treatment later t-value P-value Observation 108 35.12±11.57 76.21±19.38 18.919 0.000 Control 108 36.82±12.05 63.21±21.35 11.187 0.000 t-value 1.058 4.685 P-value 0.291 0.000
Table 8. Comparison of the VAS score before and after the treatment ( ±s, point)
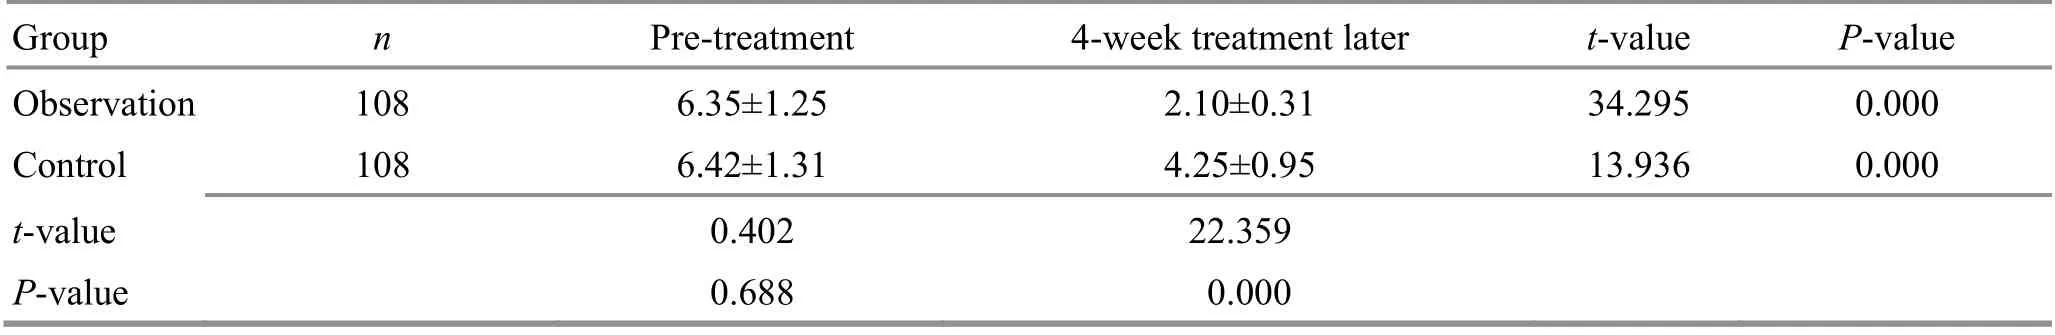
Table 8. Comparison of the VAS score before and after the treatment ( ±s, point)
Group n Pre-treatment 4-week treatment later t-value P-value Observation 108 6.35±1.25 2.10±0.31 34.295 0.000 Control 108 6.42±1.31 4.25±0.95 13.936 0.000 t-value 0.402 22.359 P-value 0.688 0.000
Table 9. Comparison of the MAS score before and after the treatment ( ±s, point)
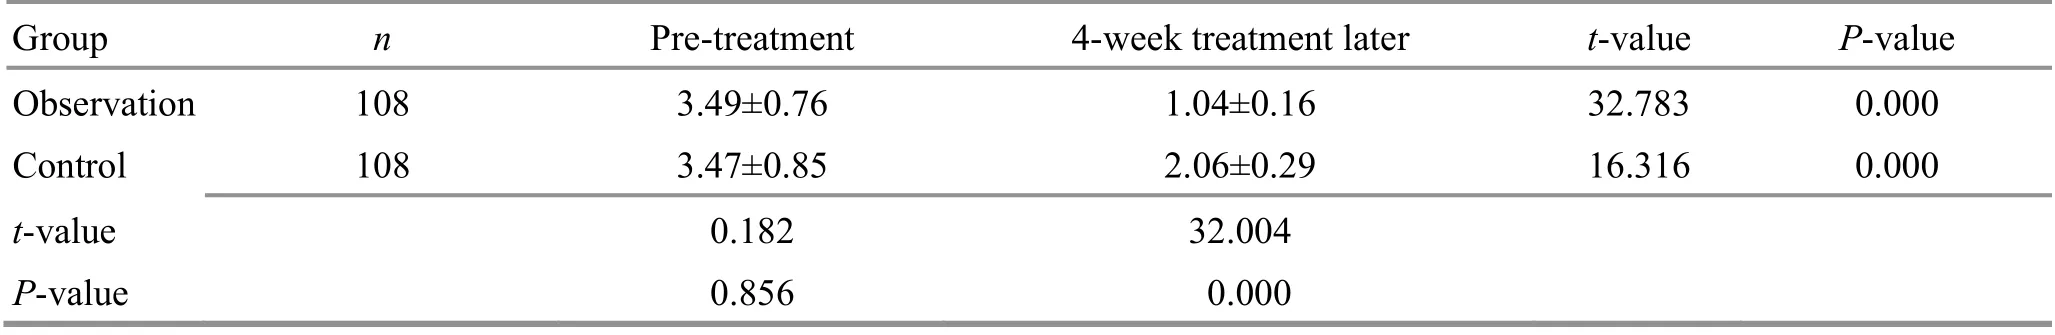
Table 9. Comparison of the MAS score before and after the treatment ( ±s, point)
Group n Pre-treatment 4-week treatment later t-value P-value Observation 108 3.49±0.76 1.04±0.16 32.783 0.000 Control 108 3.47±0.85 2.06±0.29 16.316 0.000 t-value 0.182 32.004 P-value 0.856 0.000
Table 10. Comparison of the SF-36 score of the role-physical before and after the treatment ( ±s, point)

Table 10. Comparison of the SF-36 score of the role-physical before and after the treatment ( ±s, point)
Group n Pre-treatment 4-week treatment later t-value P-value Observation 108 48.91±6.32 56.25±5.12 12.352 0.000 Control 108 48.39±6.42 53.02±5.21 8.251 0.000 t-value 0.600 4.595 P-value 0.549 0.000
Table 11. Comparison of the SF-36 score of physical functioning before and after the treatment ( ±s, point)

Table 11. Comparison of the SF-36 score of physical functioning before and after the treatment ( ±s, point)
Group n Pre-treatment 4-week treatment later t-value P-value Observation 108 56.36±5.42 62.86±5.05 15.246 0.000 Control 108 55.13±5.34 59.22±5.24 9.352 0.000 t-value 1.680 5.198 P-value 0.094 0.000
Table 12. Comparison of the SF-36 score of bodily pain before and after the treatment ( ±s, point)
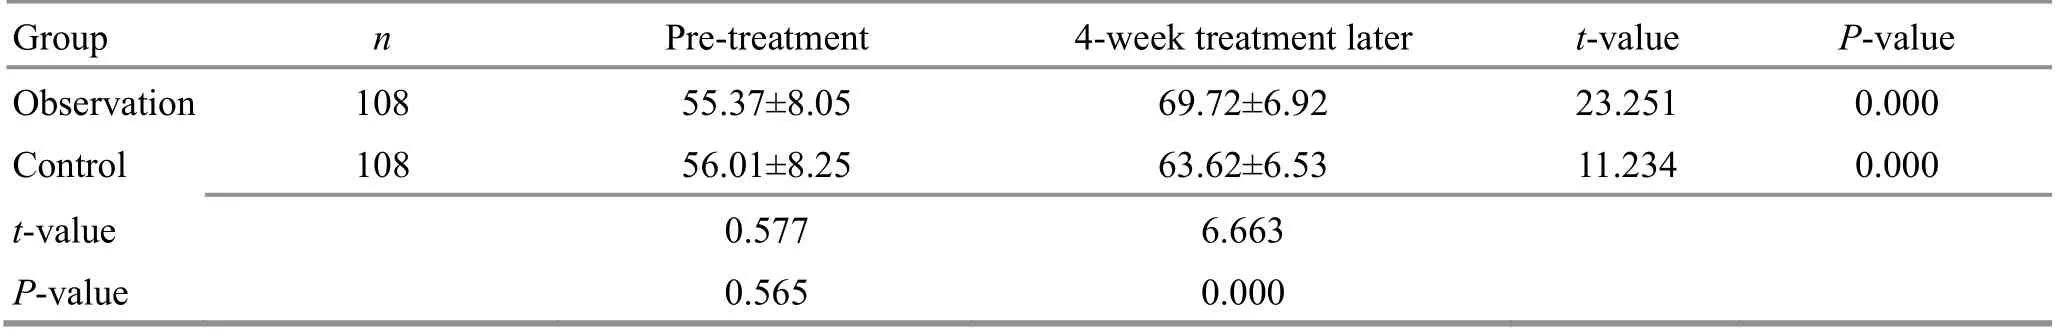
Table 12. Comparison of the SF-36 score of bodily pain before and after the treatment ( ±s, point)
Group n Pre-treatment 4-week treatment later t-value P-value Observation 108 55.37±8.05 69.72±6.92 23.251 0.000 Control 108 56.01±8.25 63.62±6.53 11.234 0.000 t-value 0.577 6.663 P-value 0.565 0.000
Table 13. Comparison of the SF-36 score of general health before and after the treatment ( ±s, point)
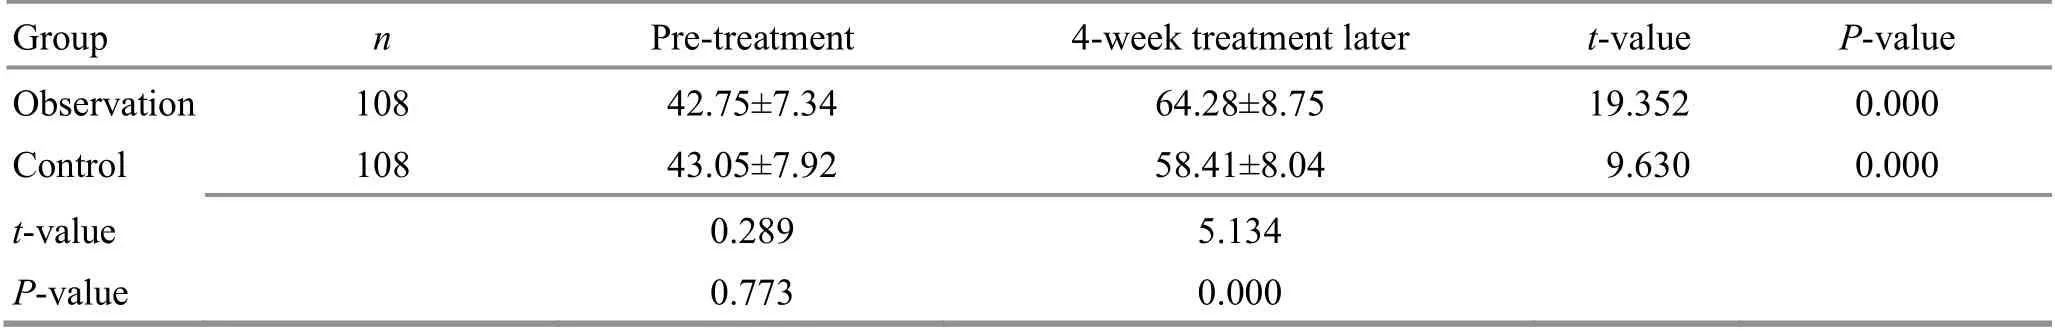
Table 13. Comparison of the SF-36 score of general health before and after the treatment ( ±s, point)
Group n Pre-treatment 4-week treatment later t-value P-value Observation 108 42.75±7.34 64.28±8.75 19.352 0.000 Control 108 43.05±7.92 58.41±8.04 9.630 0.000 t-value 0.289 5.134 P-value 0.773 0.000
Table 14. Comparison of the SF-36 score of vitality before and after the treatment ( ±s, point)
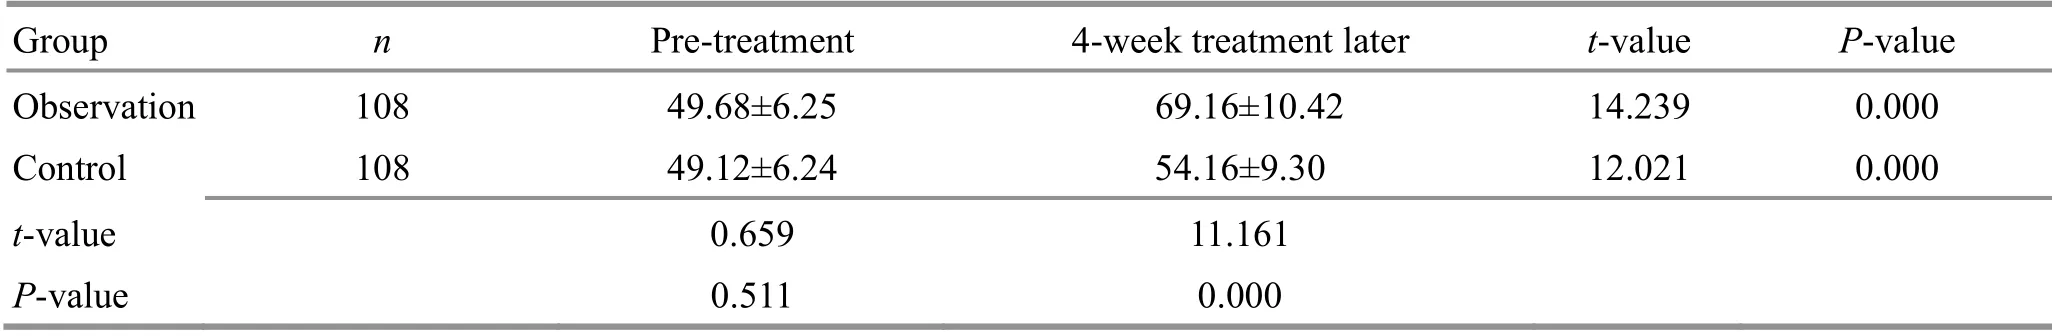
Table 14. Comparison of the SF-36 score of vitality before and after the treatment ( ±s, point)
Group n Pre-treatment 4-week treatment later t-value P-value Observation 108 49.68±6.25 69.16±10.42 14.239 0.000 Control 108 49.12±6.24 54.16±9.30 12.021 0.000 t-value 0.659 11.161 P-value 0.511 0.000
Table 15. Comparison of the SF-36 score of social functioning before and after the treatment ( ±s, point)

Table 15. Comparison of the SF-36 score of social functioning before and after the treatment ( ±s, point)
Group n Pre-treatment 4-week treatment later t-value P-value Observation 108 49.66±7.25 71.50±11.13 17.254 0.000 Control 108 49.51±7.19 62.52±9.16 11.037 0.000 t-value 0.153 6.474 P-value 0.879 0.000
Table 16. Comparison of the SF-36 score of role limitations due to emotional problems before and after the treatment ( ±s, point)
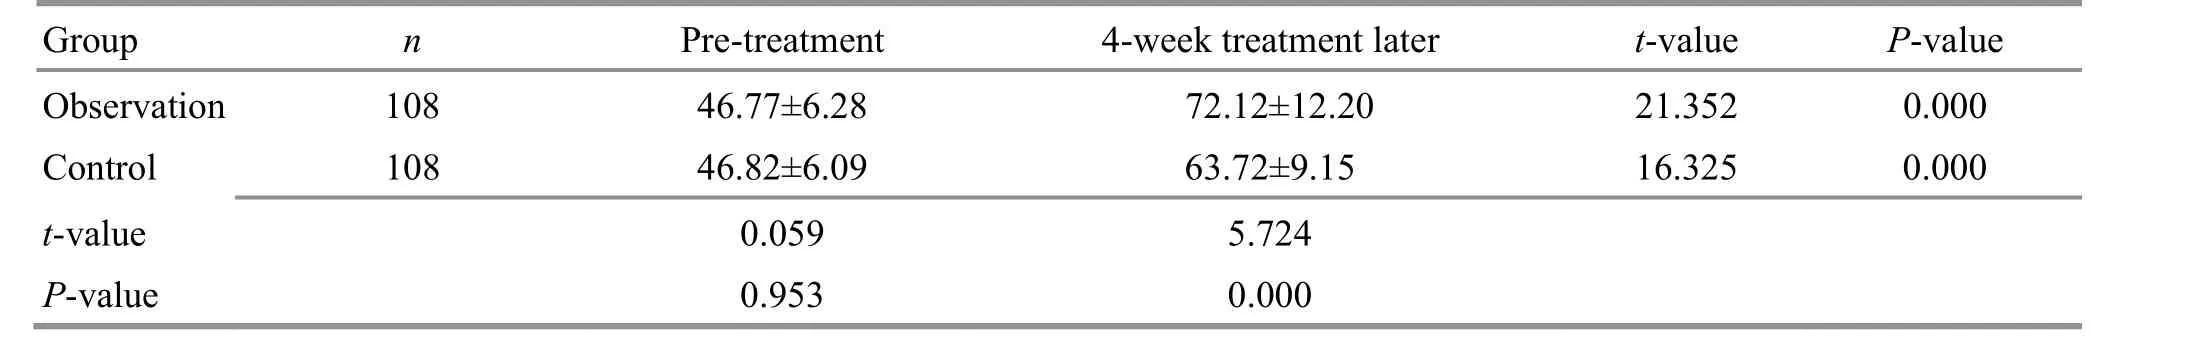
Table 16. Comparison of the SF-36 score of role limitations due to emotional problems before and after the treatment ( ±s, point)
Group n Pre-treatment 4-week treatment later t-value P-value Observation 108 46.77±6.28 72.12±12.20 21.352 0.000 Control 108 46.82±6.09 63.72±9.15 16.325 0.000 t-value 0.059 5.724 P-value 0.953 0.000
Table 17. Comparison of the SF-36 score of mental health before and after the treatment ( ±s, point)

Table 17. Comparison of the SF-36 score of mental health before and after the treatment ( ±s, point)
Group n Pre-treatment 4-week treatment later t-value P-value Observation 108 41.82±6.37 69.16±10.05 13.502 0.000 Control 108 41.90±6.41 58.62±7.35 8.359 0.000 t-value 0.092 8.546 P-value 0.927 0.000
4 Discussion
Upper-limb dysfunction disturbs 30.0%-60.0% of the poststroke hemiplegic patients[14], manifesting as decreased movement control and execution abilities and increased co-contraction of the upper extremity[15]. It is of great significance to conduct exercise rehabilitation to recover the function of the affected limbs in the early stage after a stroke. The current mainstream of rehabilitation therapy includes conventional exercises and occupational training. Motor imagery is a novel exercise rehabilitation approach raised based on the psychoneuromuscular theory. It aims to improve the affected limbs’ motor function by triggering central nervous activities by motor imagery. In addition to motor imagery, GMI adopts mirror image theory to transform simple motor imagery into motor exercises of the affected limbs, which is more beneficial to the recovery.In this study, the FMA-UE score, upper-limb and hand Brunnstrom staging scores, and hand BBT increased after the 4-week treatment, suggesting that GMI can reduce the upper-limb muscles’ co-contraction to boost the restoration of upper-limb motor function. After the 4-week treatment, the CR of biceps brachii at flexion and the CR of triceps at extension dropped, indicating that GMI can help establish a normal motion pattern and discourage the construction of an abnormal one, to enhance the ability to control the upper-limb movements. GMI takes advantage of the mirror image theory. It makes patients develop mirror image illusions while seeing the movements of their upper limbs and hands in the mirror to stimulate the neural network,enhance the motor nerve excitability, reconstruct the cortex’s function, and regain the motor function of the affected limbs[16]. POLLI A,et al[17]treated 28 patients with poststroke hemiplegia with either GMI or conventional rehabilitation therapy and found that patients treated with GMI gained better FMA score than those with conventional rehabilitation. The exact mechanism of GMI in activating the cerebral cortex is unclear yet. However, one study discovered that visual information could enhance the anterior intraparietal sulcus activity and activate the motor brain region[18].Another study holds that mirror movements can activate activity in the precuneus and the posterior cingulate cortex to increase awareness of the self and spatial attention[19]. It can be concluded that GMI may boost the recovery of motor function through multiple neural networks[20].
Shoulder pain is a common complication of poststroke hemiplegia and often occurs two weeks to three months after the stroke. The pain is associated with improper posture or method during rehabilitation exercises in the early stage, which causes shoulder joint injuries.Shoulder joint injuries may block the return of the blood flow to the upper limb, causing congestion, swelling, and pain and damaging the surrounding nerves,subsequently leading to vascular motor dysfunction and affecting the motor function recovery of the upper limb and hand[21]. Abnormal spinal reflexes after nerve injuries cause muscle spasms, increasing muscle tone of the hemiplegic side and making the rehabilitation more difficult. Tuina therapy harmonizes Qi and blood,activates blood and Qi flow, relaxes tendons, and unblocks collaterals. By stimulating acupoints, this treatment can accelerate blood circulation, muscle metabolism, and relief of swelling, palliate muscle spasms, and finally cease the spasms and pain. The patients experienced significant relief of pain and upperlimb spasms in the current study after receiving GMI and Tuina therapy. The VAS score, MAS score, CR of biceps brachii at flexion, and CR of triceps brachii at extension were lower in the observation group than in the control group. The upper-limb function got notable improvement. The FMA-UE score, upper-limb and hand Brunnstrom staging scores, and hand BBT were higher in the observation group than in the control group. These results indicate that the combination of GMI and Tuina therapy is more beneficial to recovering the upperlimb function and palliating spasms and pain of the affected limb. ZHOU Y,et al[4]conducted Tuina treatment and scapular stability training for patients with poststroke hemiplegia and gained better results in the rating of FMA-UE, MBI, and VAS compared with those treated with Tuina in isolation. The mechanism of Tuina in promoting the recovery of upper-limb function is not well-understood. However, Tuina therapy may achieve specific central effects via the meridian system or act on skeleton muscles to reduce muscle tone and release muscle spasms, thus assisting the rehabilitation training to recover the upper-limb function[22]. Acupoint selection based on syndrome differentiation along meridians is a part of TCM, and exercise therapy belongs to Western medicine. When integrated effectively, they can fully exert the fortes and advantages of the two medical systems to increase the upper-limb movement ability and boost the recovery of the upper-limb function.Therefore, the observation group achieved more significant efficacy in improving the upper-limb function in this study. We also found that the SF-36 subscale and MBI scores increased notably after the treatment in both groups and were higher in the observation group than in the control group. It is suggested that combining Tuina and GMI works better in improving the patients’ ADL and QOL.
To conclude, Tuina combined with GMI can significantly improve the upper-limb motor function and QOL in poststroke hemiplegic patients. This study creatively and effectively combined the GMI program of Western medicine and conventional TCM Tuina therapy.It proved the application value of this integrated method in recovering the upper-limb function in poststroke hemiplegic patients, thus providing a novel method and reference to clinical treatment. However, this study is limited by insufficient follow-up time, and thus the longterm efficacy needs a longer follow-up duration to prove.
Conflict of Interest
The author declares that there is no potential conflict of interest in this article.
Acknowledgments
This work was supported by the Scientific Research Plan of Traditional Chinese Medicine of Anhui Provincial Health Bureau (安徽省卫生厅中医药科研计划, No. 128).
Statement of Informed Consent
This study was approved by the Ethics Committee of Lu’an People’s Hospital of Anhui Province (Approval No.201701304). Informed consent was obtained from all individual participants.
Received: 14 September 2020/Accepted: 27 April 2021
猜你喜欢
杂志排行
Journal of Acupuncture and Tuina Science的其它文章
- Literature review and application experience of needling the Belt Vessel for low back pain
- Investigating the influence of moxibustion on colonic mucosal barrier in rats with dextran sulfate sodium-induced ulcerative colitis
- Clinical study of acupuncture plus Dang Gui Bu Xue Qu Feng Tang for benign essential blepharospasm
- Clinical efficacy of umbilical therapy with herbal cakes of different dosages for damp-heat diarrhea in young children
- Clinical study on Tuina plus Shen Ling Bai Zhu San in treating children with diarrhea due to spleen deficiency
- Observation of the efficacy and safety of the Song-Relaxing and Zhen-Vibrating abdomen manipulation for patients with prediabetes