Burnup optimization of once-through molten salt reactors using enriched uranium and thorium
2022-02-23MengLuTanGuiFengZhuZhengDeZhangYangZouXiaoHanYuChengGangYuYeDaiRuiYan
Meng-Lu Tan • Gui-Feng Zhu • Zheng-De Zhang • Yang Zou • Xiao-Han Yu • Cheng-Gang Yu • Ye Dai • Rui Yan
Abstract The advantages of once-through molten salt reactors include readily available fuel,low nuclear proliferation risk,and low technical difficulty.It is potentially the most easily commercialized fuel cycle mode for molten salt reactors.However,there are some problems in the parameter selection of once-through molten salt reactors,and the relevant burnup optimization work requires further analysis.This study examined once-through graphitemoderated molten salt reactor using enriched uranium and thorium.The fuel volume fraction (VF),initial heavy nuclei concentration (HN0),feeding uranium enrichment(EFU),volume of the reactor core,and fuel type were changed to obtain the optimal conditions for burnup.We found an optimal region for VF and HN0 in each scheme,and the location and size of the optimal region changed with the degree of EFU,core volume,and fuel type.The recommended core schemes provide a reference for the core design of a once-through molten salt reactor.
Keywords Once-through fuel cycle · Molten salt reactor ·Enriched uranium · Thorium
1 Introduction
As a fourth-generation reactor,molten salt reactors(MSRs)have the advantages of inherent safety,no risk of a core meltdown,online feeding,and reprocessing[1].MSRs eliminate the need to manufacture fuel rods,greatly reducing the fuel production cost.Online feeding and fuel reprocessing causes online removal of fission products and the separation and extraction of actinides,thus improving the neutron economy[2,3].The large negative temperature reactivity coefficient and void reactivity coefficient of fuel salt ensure the passive safety of MSRs.In addition,a passive core drain system improves the safety of MSRs[4].
Fuel chemical reprocessing is often complex and highly hazardous and have a potentially high proliferation risk.Therefore,once-through MSRs using low-enriched uranium (LEU) and thorium have aroused interest worldwide[5-7].The once-through fuel cycle design does not include chemical reprocessing of the fuel,which does not recycle uranium and plutonium from spent fuel [8,9].The design is quite simple with the advantages of easy fuel availability,low proliferation risk,and low technical difficulty.It would significantly reduce capital investment,research,development,and operating costs,and is expected to achieve commercial deployment at the earliest opportunity.A once-through MSR was first proposed by ORNL in the 1970s,with the design of a denatured molten salt reactor(DMSR) [10].It was characterized by its simple structure,low difficulty in reprocessing,and excellent nonproliferation performance [11].Presently,several reactors such as ThorCon [12],integral molten salt reactor (IMSR) [13],and small modular Thorium-based molten salt reactor(sm-TMSR) [14,15] have proposed individual design schemes to accelerate the deployment of MSRs in the next decade.
Research on MSRs in the last two decades has mainly been based on breeder reactors [16-19].In breeder MSRs,233U is the fuel salt,and thorium is the breeder salt.After reprocessing,233U is returned to the reactor online,and thorium is supplemented [20,21].However,once-through MSRs are mostly initiated by enriched uranium with or without thorium.They usually adopt the method of gradually feeding fuel,without online reprocessing,and only clearing fission gas to realize the continuous operation of the reactor [22].Owing to the differences in the fuel type and cycle mode,burnup,conversion ratios,neutron spectra,and optimal parameter regions of once-through MSRs and breeder MSRs,and online fuel feeding leading to new problems(such as the accumulation of heavy metals in the reactor core) [23],the burnup analysis and nuclear design parameters of once-through MSRs need to be further studied.
Even for the same once-through mode,selection issues still exist with different requirements.Without regard to breeding requirements,NaF-BeF2,NaF-ZrF4,NaF-RbF,NaF-KF,and LiF-BeF2could be candidate carrier salts because of their low tritium yield and low cost [24,25].The enrichment of uranium can change from 2at%(atomic percentage) to 20at% because of the difference in fuel availability or burn up.In sm-TMSR design,thorium utilization is a major concern in thorium-uranium breeder MSRs.In addition,component structures such as hexagonal plate prisms,quadrangular block prisms,and hexagonal block prisms are adopted in different design schemes [26].These selection issues were analyzed from a neutronic view in our previous work [27-30].Though,until now,there have been few optimization analyses for different structural parameters and fuel compositions.In 2017,Moser [31] performed lattice optimization with different carrier salts and lattice sizes.However,the optimization did not include a burnup calculation.
In this study,burnup optimization with the mole concentration of heavy nuclei fuel in the initial molten salt and the volume fraction of molten salt in the active core was carried out.To restrain the increase in heavy nuclei fuel during the operation,feeding fuel under different uranium enrichments,including more than 20at%,was analyzed.In addition,a detailed comparison between232Th and238U as a startup breeder fuel was conducted under various structural parameters to determine the optimal burnup region.Finally,the reactor size was changed to evaluate its effect on burnup considering the size limit of the reactor vessel from modular assembly,transportation,and replacement.
2 Calculation model and method
Sections 3.1-3.4 of this study use a hexagon lattice with total reflection boundary conditions as the calculation model,and Sect.3.5 uses the whole reactor core as the calculation model.The lattice model is illustrated in Fig.1a.The lattice pitch was 20 cm to ensure a sufficient negative temperature reactivity coefficient [18,32] and better space self-shielding effect on burnup[31].The outer layer was a graphite moderator,the inner layer was a molten salt channel,and the carrier salt was a FLiBe molten salt (a mixture of LiF and BeF2).The main parameters of the lattice model are listed in Table 1.

Table 1 Main parameters of the single lattice calculation model
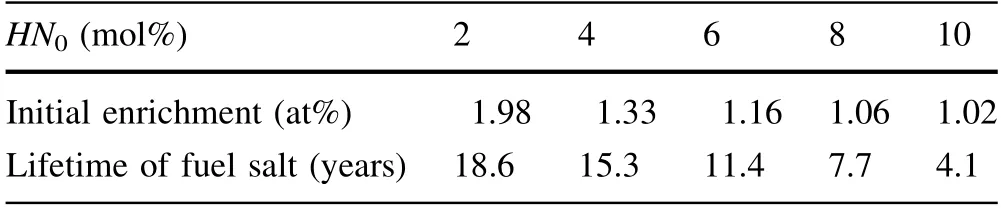
Table 2 Initial fuel enrichment and lifetime for different HN0s for 10% VF
The core model is shown in Fig.1b.The graphite reflectors were 30 cm thick to prevent neutron leakage,and the outer vessel of the reactor core was made of Hastolly-N alloy with a 5 cm thickness.The core model had the same diameter and height.The diameter of the core was calculated as 2,3,4,5,6,and 10 m,respectively.

Fig.1 (Color online)a Section of the single lattice calculation model. b Section of the whole core calculation model
In this study,the volume fraction of molten salt in the active core (VF),the mole concentration of heavy nuclei fuel in the initial molten salt (HN0),the enrichment of feeding uranium (EFU),the core diameter,and using LEU startup fuel or Th-U startup fuel can be changed to obtain optimal burnup with the once-through cycle.
VFandHN0are defined as:

whereVfuelis the volume of molten salt,Vgraphiteis the volume of graphite,nU(0 ),nTh(0 ),nLi(0 ),andnBe(0 )are the initial moles of U,Th,Li,and Be,respectively.HNrefers to the accumulated concentration of heavy nuclei in the core,including the initial amount and the added amount,and does not consider the evolution of the nuclide.HNremrefers to the concentration of heavy nuclei remaining after evolution.They can be expressed as:

whererU(t),rTht(),rLi(t)andrBe(t)are the addition mole rates of U,Th,Li,and Be,tis the time,andnU(t),nTh(t),nLi(t)andnBe(t)are the moles of U,Th,Li,and Be,which vary with time,taking the addition and consumption into account.
Burnup (BU) is defined as the energy produced by the unit mass of fuel added to the core,including the initial loading fuel.WUis the total uranium mass,which also changes with the operation time.BUcan be expressed as:

Reactor cores with different enrichments were studied,and natural uranium burnup (NBU) was used to compare burnup with different enrichments [28].Other types of reactors also use uranium at different levels of enrichment,and the use ofNBUis easy to compare with that of other reactors (Sect.3.5).NBUis defined as the total output energy divided by the total amount of natural uranium fed,which includes enriched uranium fed into the reactor and depleted uranium outside the reactor.The natural uranium enrichment was 0.714at%.NBUcan be expressed as:

whereCNis the conversion factor of natural uranium andEUis the uranium enrichment supposing 0.25at% tails.
The capture to fission ratio is defined as the ratio of the capture cross-section to the fission cross-section,which can be expressed as:

As shown in Fig.2,the initial fuel is enriched uranium mixed with natural uranium or enriched uranium mixed with thorium.Fuel is mixed with the carrier salt at the beginning of life (BOL) to achieve criticality,followed by continuous fuel feeding to maintain reactivity near the criticality.The process of continuous feeding involves adding some UF4fuel according to reactivity consumption.During the operation of the reactor,it was assumed that all fission gases generated were removed.

Fig.2 (Color online) Reactor core operation diagram
In this calculation,the fission gases are Xe and Kr.It is also assumed that all the insoluble noble metals (Se,Nb,Mo,Tc,Ru,Rh,Pd,Ag,Sb,and Te)in molten salts can be removed by bubbling.
In this study,a tool called MSR-RS [30] was used,which is an online processing program for MSRs based on the FORTRAN language,which is developed by adding an external processing program based on SCALE6.1 [33].Figure 3 shows a flow chart of the MSR-RS.
MSR-RS uses the three-dimensional Monte Carlo critical calculation module KENO-VI to perform critical calculations.Couple calculation is used to generate a nuclear database of Origen-s by combining the associated singlegroup cross-sections with the ENDF/B-VII nuclear data and fission product yields.The single-group cross-section was generated using a cross-section library of multiple groups and multigroup fluxes prepared in the 238-group ENDF/B-VII database.Origen-s was used for burnup calculations,including online feeding and post-processing.Then,the multiplication factor was obtained based on the KENO-VI module to determine whether the feeding amount met the critical condition.If the multiplication factor was within the required range,the next calculation proceeded in the same way until all the burnup steps were completed.

Fig.3 (Color online) Schematic coupling of MSR-RS
3 Results and discussion
3.1 Once-through MSR burnup characteristics varied with operation time
The fuel cycle of the once-through MSRs is different from that of the breeder MSRs or once-through PWRs.Online feeding leads to different burnup characteristics.Therefore,this section focuses on analyzing the parameters that change with time,such as burnup,heavy nuclei concentration,and online feeding rate,and on the general characteristics of once-through online feeding of the MSR.The following are the model conditions and results.
To simplify the optimization,a lattice model analysis was first carried out.We considered one condition (VF=10%,HN0=10 mol%,EFU=20at%) as an example to analyze the characteristics of a once-through fuel cycle using enriched uranium.
To achieve criticality at the BOL,the initial enrichment of235U was adjusted under a fixed HN0condition.The initialkinfwas approximately 1.05.The standard deviation of thekinfwas approximately 0.0005.The process of continuous feeding involved adding some UF4fuel according to reactivity consumption.Because the reactor ran for a relatively long time whenkinffirst fell below 1,the initial feeding rate was low,as shown in Fig.4a.Then,kinfwas automatically fed to 1.05 when it reached 1 (Fig.4b).The time taken by each step was relatively stable,so the feeding rate was relatively stable.Owing to the accumulation of heavy nuclei and the hardening of the energy spectrum,the feeding rate increased slightly,as shown in Fig.4a.With continuous feeding during the operation of the reactor,continued to increase until it increased to 12 mol%,which was the solubility value of heavy nuclei in the carrier salt,as shown in Fig.5.The end of the operation is the time required to reach 12 mol%HN.
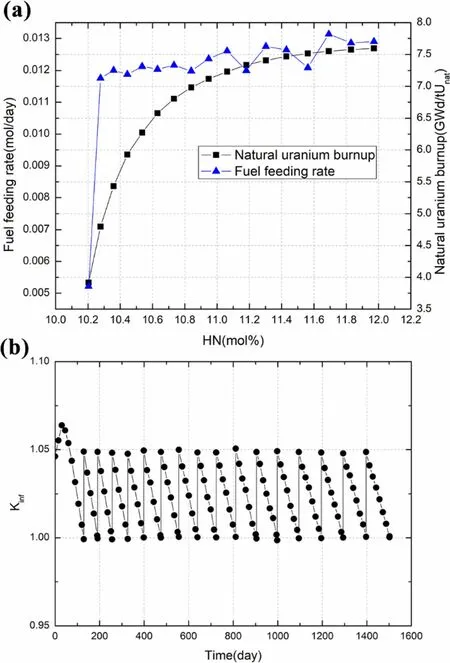
Fig.4 (Color online) a The fuel feeding rate and natural uranium burnup varying with HN. b kinf varying with reactor operating time

Fig.5 (Color online) HN varying with reactor operating time
The change in burnup was caused by the inadequate burning off the initial heavy nuclei.The feeding rate was relatively stable in the later stages,indicating that the burnup was relatively stable.The proportion of initial fuel decreased with operation,so burnup got closer to the burnup of online feeding,which tended to be saturated.The burnup reaches the maximum value at the end of life(EOL),and this value is taken as the optimum burnup.When the initial condition is changed,the maximum burnup will appear before the EOL,and this burnup will be taken as the optimum burnup.HNis an important index for determining the operation life because of the limitation of the solubility of heavy nuclei.In view of its approximate linearity with time and its ability to separate from the core power density,fuel volume,and other related parameters,HNcan be used to replace the time coordinate in the following analysis.
The largest contribution to burnup is the fission reaction rate.The most important fission nuclides were235U and239Pu.The single-group fission microscopic cross-section and the inventory of nuclides affected their fission rates.As shown in Fig.6,235U is approximately four times the amount of239Pu.In the initial stage,the amount of235U decreased due to fission and then increased with feeding.Meanwhile,238U also increased due to feeding,and239Pu generated by238U conversion also increased,but the trend gradually slowed down.The single-group fission microscopic cross-section was also affected by the neutron energy spectrum.As shown in Fig.7a,the neutron spectrum gradually hardened from the BOL to the EOL.As shown in Fig.7b,the single-group fission microscopic cross-section of239Pu was several times that of235U owing to the first resonance peak difference of the fission crosssection near the Maxwell peak of the neutron energy spectrum(Fig.7a).Both decreased with operation time,as the Maxwell peak had a decline at the EOL.
Finally,the fission reaction of235U and239Pu and the capture reaction of the other major nuclides were studied,as shown in Fig.8.The neutron absorption proportion refers to the proportion of different neutron absorption reactions of different nuclides.All neutron absorption proportions increased to 1.The amount of235U was several times greater than that of239Pu,as shown in Fig.6.In contrast,the cross-section of235U was much smaller than that of239Pu,as shown in Fig.7b.Therefore,the fission reaction proportion of235U was slightly higher than that of239Pu.The fission of235U decreased at the initial stage and slowly increased under the combined effect of the amount and the single-group fission microscopic cross-section.However,the fission of239Pu first rapidly increased and then slowly decreased.Owing to the large initial loading of238U,the capture reaction proportion of238U was the highest,but it decreased with operation time owing to its strong space self-shielding effect and weak competition with235U and fission products.Further,VFis 10%,which indicates that the fuel proportion in the reactor core is small,and the neutron absorption of graphite and carrier salt is large at the BOL,and it gradually decreases with the increase in heavy nuclei during operation.The fission products increased significantly with operation,which may exceed the total decrease of neutron absorption of graphite and carrier salt,and burnup also grew more slowly and finally became stable.
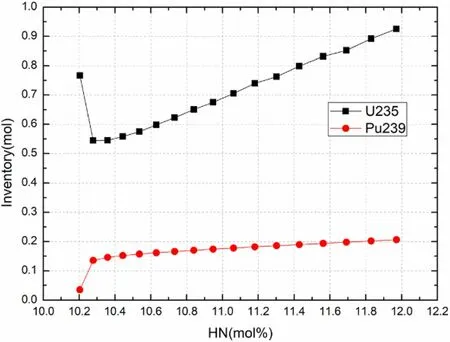
Fig.6 (Color online) Fission nuclides evolution varying with HN
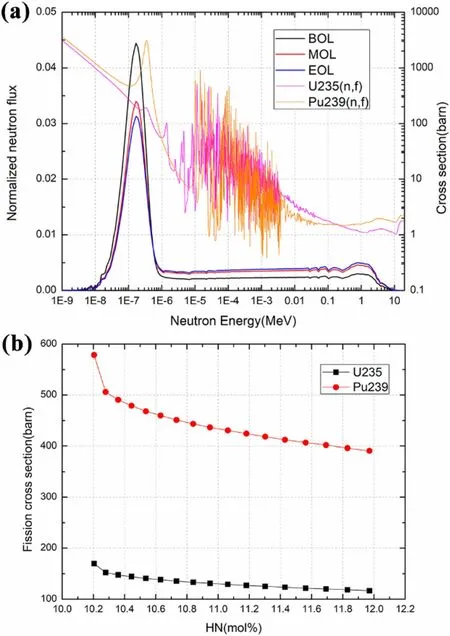
Fig.7 (Color online) a Fission cross sections of 235U and 239Pu and energy spectrum and at the beginning,middle,and end of life.b Single group fission microscopic cross-sections of 235U and 239Pu varying with HN

Fig.8 (Color online) Major neutron absorption proportions varying with HN
3.2 Effects of VF and HN0 on burnup
To study the influence ofVFandHN0on burnup,different conditions ofVFandHN0were analyzed.HN0s were set as 2,4,6,8,and 10 mol%.VFs were set as 5,10,15,20,25,and 30%.EFUwas set as 20at%.The natural uranium burnup is shown in Fig.9.The results show that natural uranium burnup first increased then decreased with an increase inVF,and increased with an increase inHN0.Maximum optimum natural uranium burnup occurred in the 10-15%VFand 7-10 mol%HN0range.

Fig.9 (Color online) Optimum natural uranium burnup for different VFs and HN0s
To analyze the impact ofVF,we compared the cases whereEFUwas 20at%,HN0was 10 mol%,andVFs were 5,10,15,20,25,and 30%.With the increase inVF,natural uranium burnup first increased and became largest whenVFwas 10% (Fig.10a).The maximum was very close to that whenVFwas 15%,and the curve of the previous burnup almost coincides.AsVFincreased,the natural uranium burnup decreased.

Fig.10 (Color online) a Natural uranium burnup varying with HN for different VFs. b Major neutron absorption proportions for different VFs
Figure 10b shows the neutron absorption proportions of different nuclides averaged by operation time under differentVFconditions.WhenVFwas 5%,the reactor core was in over-moderated state,and the graphite absorption reaction proportion was approximately 10%,which is not conducive to burn up.The larger theVF,the harder the spectrum.WhenVFwas greater than 20%,the absorption of238U caused by neutron spectrum hardening obviously increased,which was to the disadvantage of the absorption of fission elements,so burnup also began to decrease.Therefore,whenVFvaries from 10 to 15%,the burnup is optimal.
Next,the effects of differentHN0s on the burnup were studied.We compared the cases whereEFUwas 20at%,VF was 10%,andHN0s were 2,4,6,8,and 10 mol%.WhenHN0increased,the burnup increased.As shown in Fig.11a,the shapes of the burnup curves are very similar for differentHN0s.Burnup rapidly increased at the first 2 mol%HNchange (for 20 at%EFU),and then tended to saturate.Therefore,the saturation burnup was determined by the initial burnup.Initial burnup had a positive relationship withHN0.As a result,the saturation burnup is larger for higherHN0.
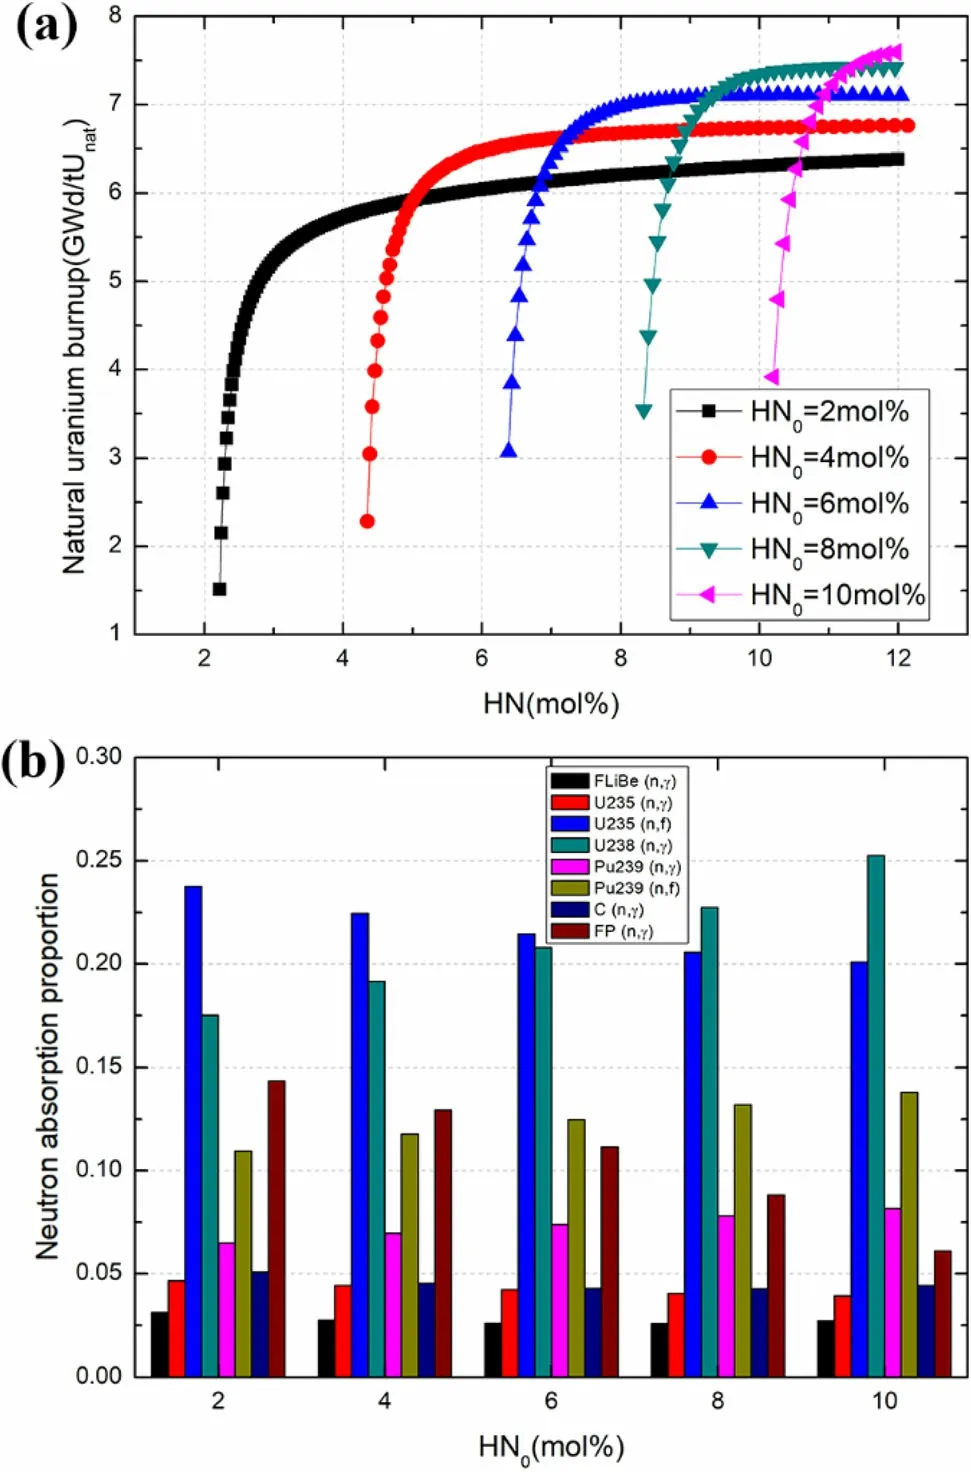
Fig.11 (Color online) a Natural uranium burnup varying with HN for different HN0s. b Major neutron absorption proportions for different HN0s
As shown in Table 2,the initial enrichment degree was lower for higherHN0because of the larger fuel load.Therefore,the higher the proportion of238U in the initial fuel for the higherHN0,the more239Pu is converted.WhenHN0was small,not only was the burnup low but also the lifetime was long.The physical property changes and accumulation of fission products were large (Fig.11b).Therefore,there are great uncertainties and challenges in engineering implementations.If post-processing is not considered,a scheme with a highHN0is preferred.
3.3 Effect of uranium enrichment on burnup
The conditions under which theEFUs were 3,5,10,20,40,and 60at%for differentVFs andHN0s were calculated.As shown in Fig.12,whenVFwas large,the feeding uranium with low enrichment could not meet the requirement of 5000 pcm excess reactivity,so whenEFUwas 3at%,onlyVFless than 20%could be calculated,and whenEFUwas 5at%,onlyVFless than 25%could be calculated.The results show that the maximum optimal natural uranium burnup was in the 10-15%VFrange.With an increase in uranium enrichment,the optimalHN0increased.WhenEFUwas 3at%,the optimal HN0was approximately 3-6 mol%.WhenEFUreached 20at%,the optimalHN0remained around 7-10 mol%HN0.The maximum value of the optimal natural uranium burnup tended to be stable.
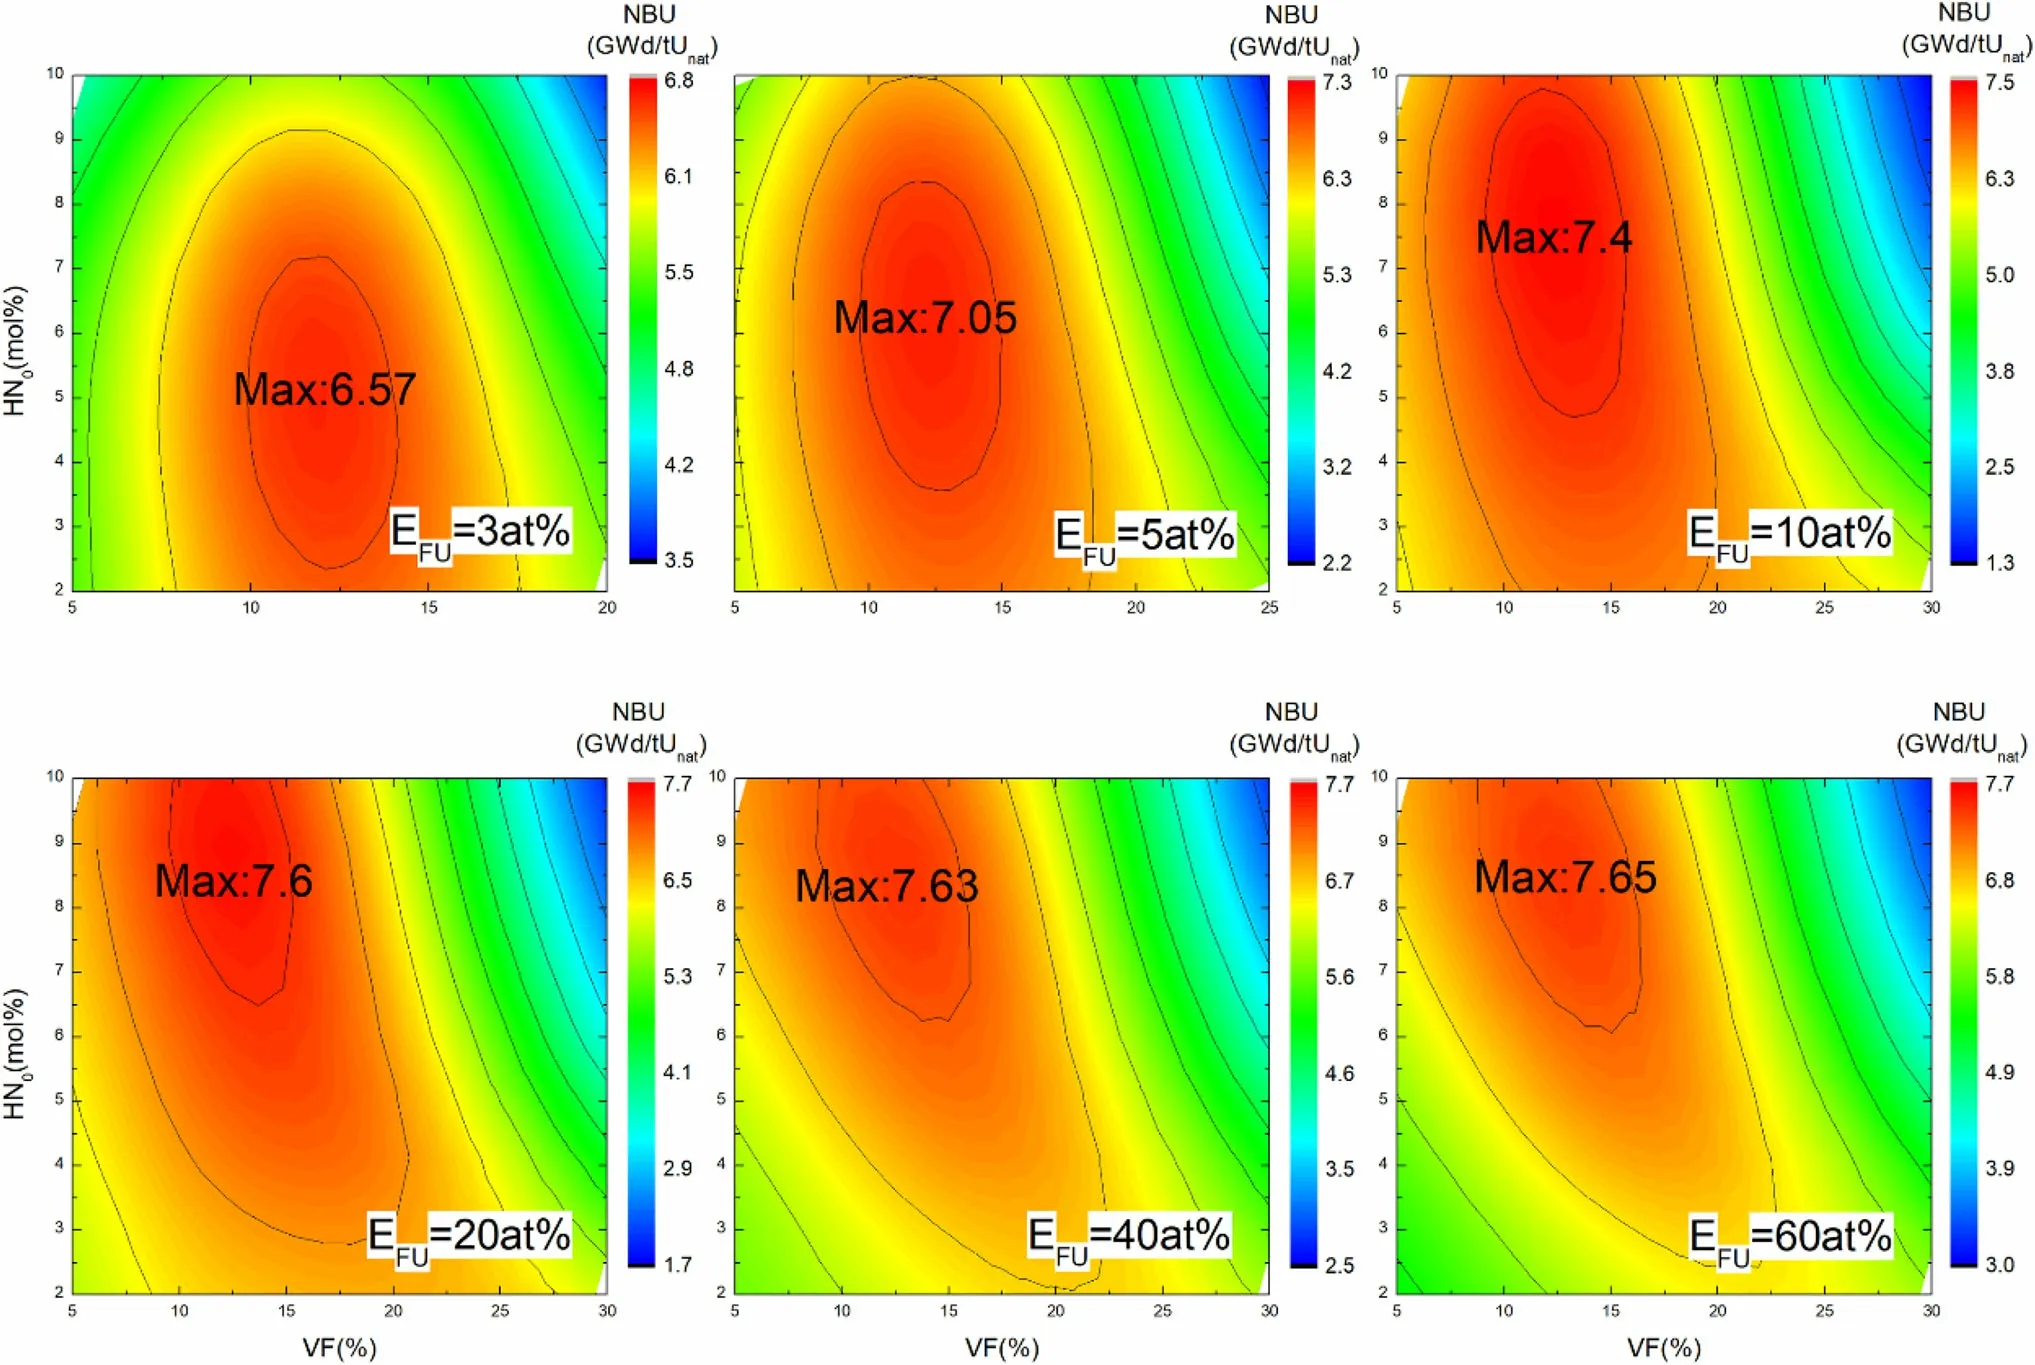
Fig.12 (Color online) Optimum natural uranium burnup for different EFUs
The situations in which differentEFUs reach the maximum burnup were analyzed.Figure 13a shows that the natural uranium burnup varies withHN.WhenEFUwas less than or equal to 20at%,the burnup reached the maximum at the EOL,whereas whenEFUwas greater than 20at%,burnup reached the maximum and decreased before the EOL.The decreasing trend of burnup indicates that without sufficient supplementation of breeding material238U,the supplement of235U cannot offset the toxicity of fission products.As shown in Fig.13b,the relationship between maximum burnup and enrichment was basically linear.However,when converting to natural uranium burnup,owing to the partial loss of235U in the process of fuel enrichment,the utilization rate of natural uranium was reduced at a high enrichment degree,as shown in Eq.(7).AfterEFUreached 20at%,natural uranium burnup was basically stable,approximately 7.6 GWd/tUnat,and did not significantly increase.Therefore,the 20at%EFUis sufficient.
The major neutron absorption proportions for differentEFUs with the sameVF(10%) andHN0(10 mol%) are shown in Fig.14.When theEFUwas low,the neutron absorption of238U was high,but plutonium fission was low.Because of the limit of dissolution,saturated burnup could not be reached(Fig.13a).However,at highEFU,the absorption of fission products increased rapidly,and burnup was difficult to improve further.Therefore,the 20 at%EFUscheme is better.

Fig.13 (Color online) a Natural uranium burnup varying with HN for different EFUs. b The maximum burnup and natural uranium burnup varying with EFU
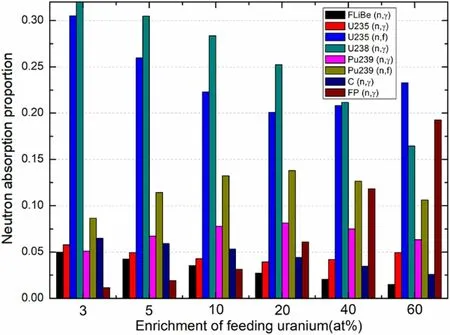
Fig.14 (Color online) Major neutron absorption proportions for different EFUs
The region of maximum burnup shifts from lowHN0to highHN0as theEFUincreased was considered in this study.As shown in Fig.15a,when theEFUwas 3at%,the burnup curves all showed an upward trend.To achieve a more saturated burnup,the initialHN0should be smaller,so maximum burnup is achieved at lowerHN0,such as 2 mol% and 4 mol%.However,whenEFUwas large (take 20at% as an example),the burnup curve was saturated quickly with a small increase inHN,as shown in Fig.11a.WhenHN0was low,the absorption of graphite and carrier salt was larger,so the burnup was not high.A largerHN0is required to obtain a higher burn up in the case of a largeEFU.

Fig.15 (Color online)a For 3at%EFU and 10%VF,natural uranium burnup varying with HN for different HN0s. b HNrem varying with time when HN0 is 10 mol%,VF is 10%and EFU is 20,40,and 60at%
The conservation of heavy nuclei concentration in the molten salt reactor is an important factor in maintaining the stability of the molten salt.This concentration must change within a limited range to control the melting temperature of the fuel salt and to reduce the operation deviation of the pump and heat exchanger in the fuel loop.The conservation of heavy nuclei concentration in the once-through cycle mode means that the mass of feeding uranium is equal to the fission assumption of heavy nuclides in the reactor.In this study,whenEFUreached 60 at%,HNremwas no longer increasing all the time and basically stabilized under the conditions of 10 mol%HN0and 10%VF,as shown in Fig.15b.If less than 20at%enriched uranium is advocated for nonproliferation of nuclear weapons,a higher operation temperature and thus more than 12 mol%HN0will be required to achieve a conservation of heavy nuclei concentration.
3.4 Scheme comparison of startup by uranium fuel and uranium-thorium mixed fuel
Adding thorium into the initial fuel instead of natural uranium can increase burnup,as concluded in our previous work.In this section,we further find the best burnup region of thorium mixed with 20 at% enriched uranium as the initial fuel.The ratio of thorium to 20 at% enriched uranium was adjusted to reach criticality.The model and method were the same as those described in Sect.3.2.Using Th-U as startup fuel had significantly greater burnup,with a maximum value of about 3.1 GWd/tUnathigher than using LEU as startup fuel (Fig.16).The position of maximum burnup with Th-U startup fuel was similar to that of the LEU startup fuel,which was in the 10-15%VFand 7-10 mol%HN0range.

Fig.16 (Color online) Optimal burnup with start-up fuel of a low enriched uranium, b 20at% enriched uranium mixed with thorium in the lattice model
We considered 10%VFand 10 mol%HN0,which is the maximum burnup for analysis.The variation ofkinfwith time is shown in Fig.17a.Similar to the LEU model,for the Th-U startup fuel,kinfwas automatically fed to 1.05 when it reached 1.Unlike the LEU startup fuel model,where the initialkinfrised slightly,the initialkinfof the Th-U model decreased directly to 1.Figure 17b shows that the conversion ratio (CR) of the Th-U startup fuel model is significantly higher than that of the LEU startup fuel model,which means that the Th-U startup fuel has a stronger ability to regenerate neutrons and requires less fuel.The reasons for this are as follows:First,the capture to fission ratio of233U is much less than that of239Pu,as shown in Tables 3 and 4.Second,the effective fission neutron number of233U in the range of 10-8-10-6MeV is larger than that of239Pu.Moreover,the resonance selfshielding of238U is more serious than that of the uranium and thorium mixture.As shown in Tables 3 and 4,the single-group capture cross sections of232Th and238U with the Th-U startup fuel are larger than that of238U with the LEU startup fuel,which is more conducive to the conversion of the breeder nuclides.
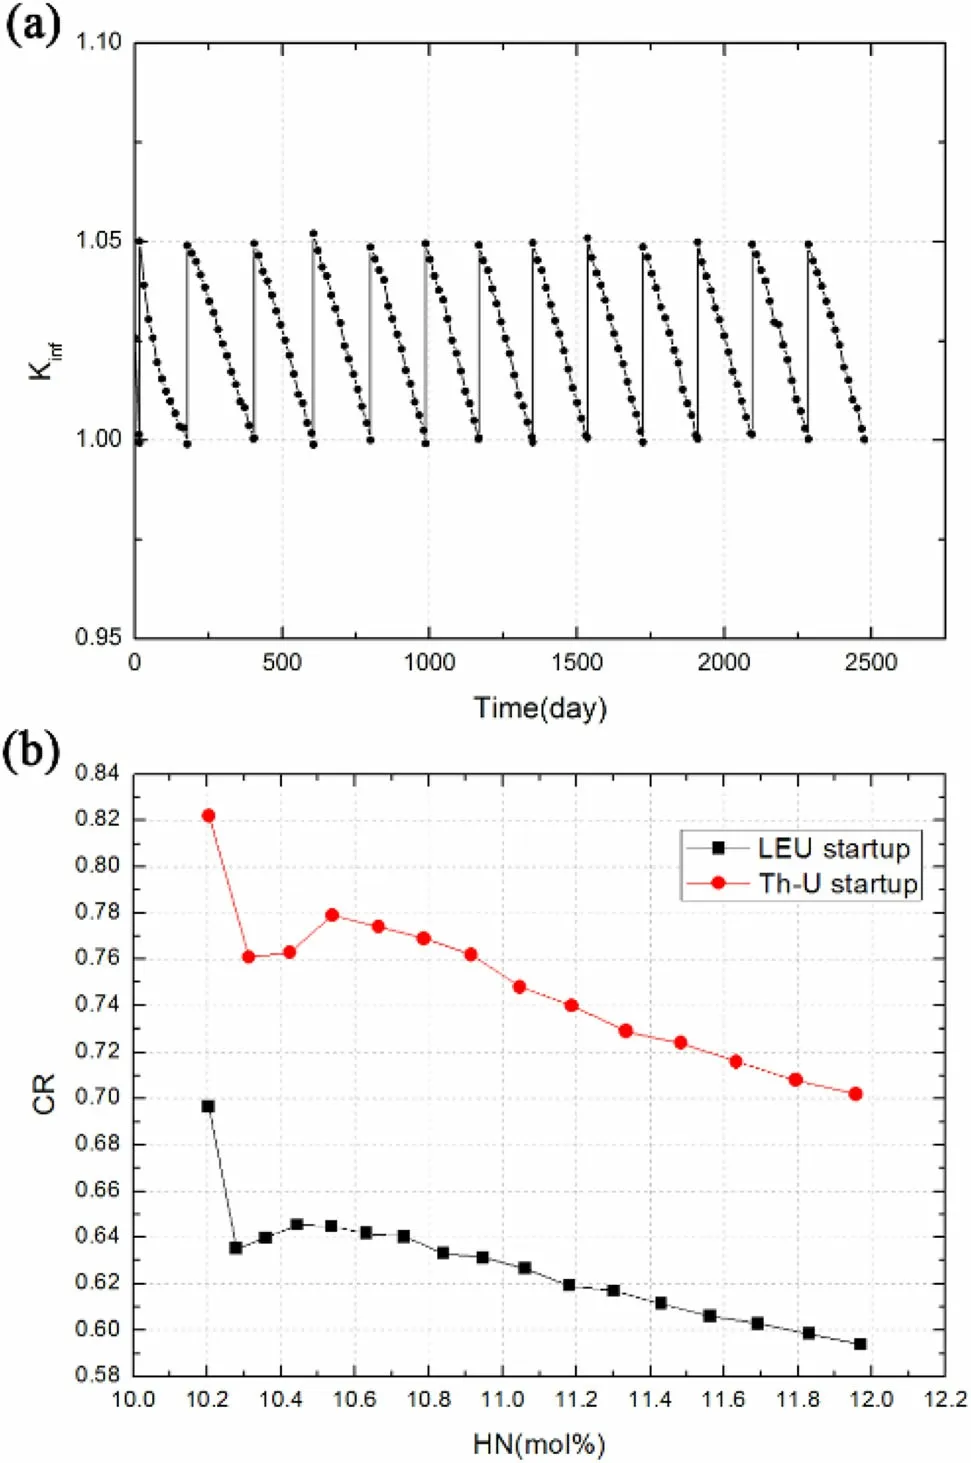
Fig.17 (Color online)a kinf of LEU startup fuel model varying with reactor operating time.b Conversion ratio of the LEU startup fuel and the Th-U startup fuel model
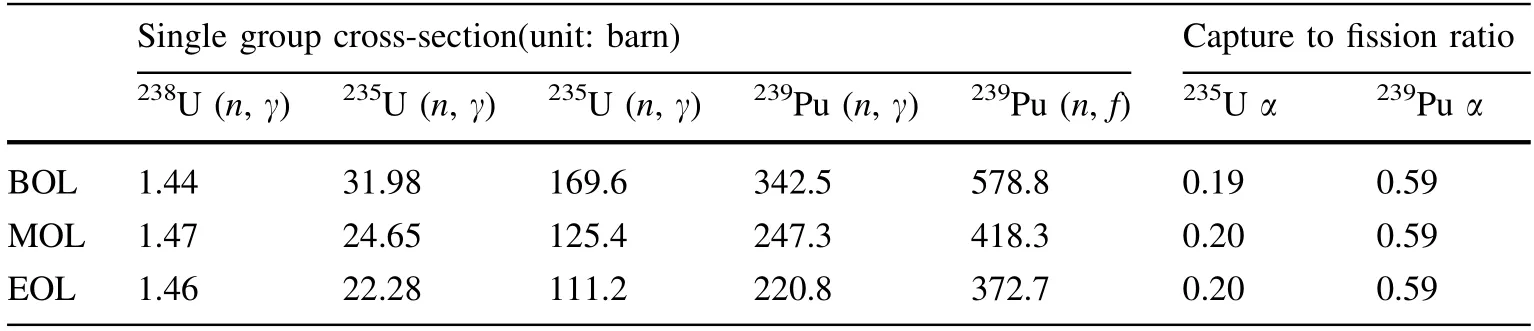
Table 3 Single group crosssection and capture to fission ratio of different nuclides at different stages in the LEU startup fuel model
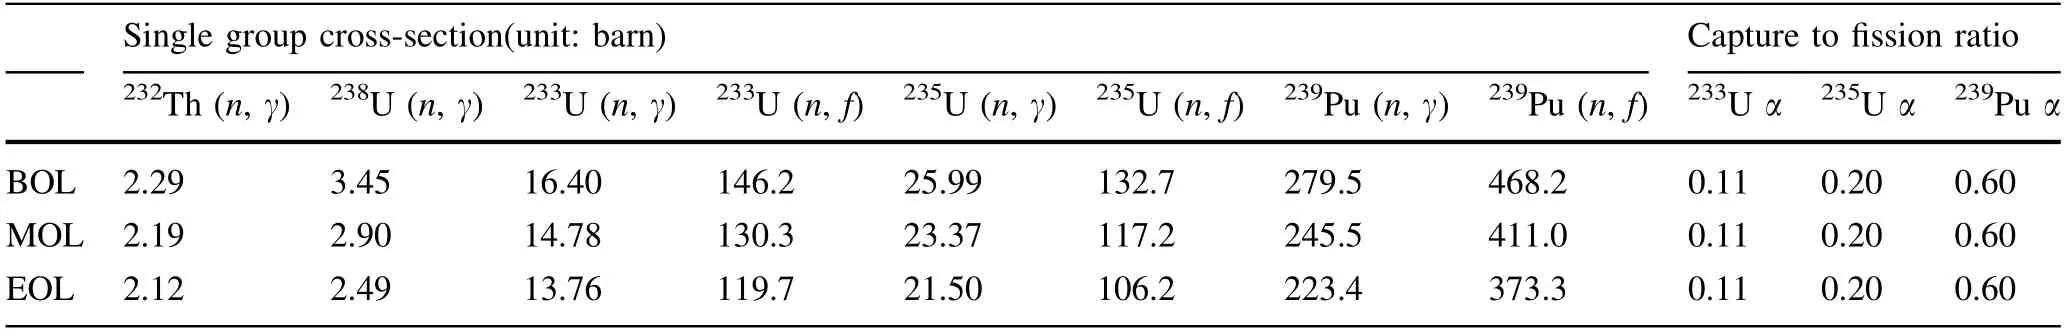
Table 4 Single group cross-section and capture to fission ratio of different nuclides in the Th-U startup fuel model
In the Th-U startup fuel model,fission was mainly contributed by235U and233U.As shown in Fig.18,the fission reaction rate of233U was higher than that of235U,indicating that the reactor operation was dominated by233U.The neutron absorption proportion of233U obviously increased in the early lifetime and then gradually decreased owing to the decrease in thorium.The neutron absorption of235U declined in the early stage and tended to strike a balance between self-consumption and continuous feeding.The neutron absorption of232Th was larger than that of238U,which is due to the large initial amount of232Th.
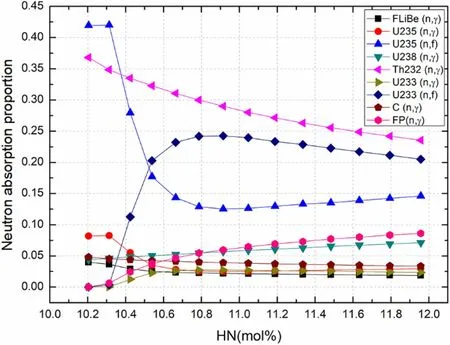
Fig.18 (Color online) Major neutron absorption proportions of the Th-U startup fuel model varying with HN
3.5 Effect of core volume on burnup
Neutron leakage does not occur in the lattice model,and the impact of neutron leakage should be considered in the core model.The neutron leakage rate of the reactor is related to the shape and volume of the reactor core.The influence of different core volumes on burnup is considered below.
The burnup calculation results for the different core volumes are shown in Fig.19.VFs were 5,10,15,20,25,and 30%,HN0s were 2,4,6,8,and 10 mol%,andEFUwas 20 at%.The burnup increased with an increase in the core volume.Moreover,the positions where the maximum burnup appeared were basically between 10 and 15%VF,moving towards the direction of increasingHN0as the volume increased.

Fig.19 (Color online) Optimum natural uranium burnup for different core volumes with the LEU startup fuel
The neutron absorption proportions for 10%VF,8 mol%HN0,and different core volumes are shown in Fig.20a.The leakage involved alloy barrel neutron absorption and neutron loss from the reactor core.The proportion of leakage was negatively associated with volume.For the core diameter of 2 m,the leakage proportion was more than 15%.The increase in leakage requires an increase in the fission of235U,which further requires an increase in the capacity of235U in the reactor core,and the uranium fuel cannot be effectively utilized.
For different volumes,the burnup curves of the schemes with maximum burnup all reached saturation (Fig.20b).For smaller volumes,theHN0of the scheme was also lower.When the core diameter reached 4 m,HN0stabilized at 8 mol%.The burnout at the EOL is greater for a larger volume.

Fig.20 (Color online) a Major neutron absorption proportions for different core volumes. b Natural uranium burnup varying with HN for different volumes
For the core diameter of 2 m,the initial fuel enrichment was greater whenHN0was smaller,as shown in Table 5.Therefore,during operation,the average fuel enrichment is also higher,increasing the burnup.As shown in Fig.21,the absorption of fission products also increased whenHN0was smaller,which is not conducive to burn up.The sum of the two causes the maximum burnup whenHN0was 4 mol%.With an increase in the core volume,the difference in the initial fuel enrichment decreased and the effect of fission products increased,so the optimal point of burnup moves towards theHN0increase with the increase in the volume.

Fig.21 (Color online) Major neutron absorption proportions for different HN0s when the core diameter is 2 m and VF is 10%
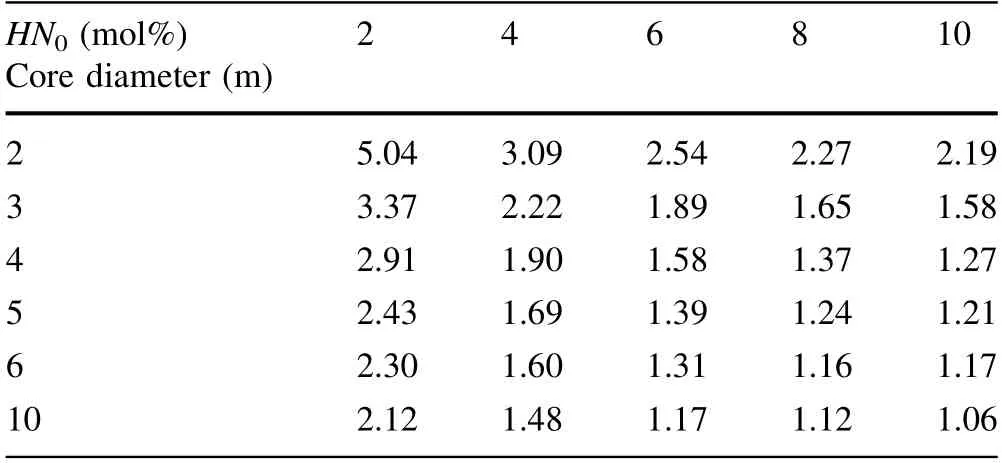
Table 5 Initial fuel uranium enrichment for different volumes,10%VF and different HN0s
As shown in Fig.22,in the Th-U startup fuel model,the position change of the maximum burnup with increasing volume was similar to that of the LEU startup fuel model,but the value and the gradient of burnup were larger than those of the LEU startup fuel model.
Fig.22 (Color online) Optimum natural uranium burnup for different core volumes with the Th-U startup fuel
Similar to the LEU startup fuel model,the neutron absorption proportions for 10%VF,8 mol%HN0,and different core volumes were analyzed.As shown in Fig.23,the absorption of non-fission nuclides in the Th-U startup fuel model was similar to that of the LEU startup fuel model.In the Th-U startup fuel model,the fission proportion of233U was significantly larger than that of239Pu in the LEU startup fuel model when the core volume was large.For the core diameter of 10 m,the fission of233U was almost the same as that of235U,which was slightly smaller than the fission of235U of the LEU startup fuel model.Therefore,the larger the core volume,the more favorable the thorium that contributes to burn up.

Fig.23 (Color online) Major neutron absorption proportions of the Th-U startup fuel model for different core volumes
Compared with general water reactors,molten salt reactors using the Th-U startup fuel have a greater advantage on burnup,and the sizes of the reactors are different.For the core diameter of 6 m,natural uranium burnup can reach 8.66 GWd/tUnat,which is larger than HWRs (about 7.5 GWd/tUnat) [34].Currently,small modular reactors(SMRs)need to meet the requirements of modular assembly,transportation,and replacement,and the diameter of the reactor core is generally required to be less than 3.5 m considering transportation,so it has a certain impact on burnup.Take the core diameter of 3 m as an example,for the Th-U startup fuel model,natural uranium burnup can reach 7.44 GWd/tUnat,which is better than PWRs (less than 5 GWd/tUnat) [35].
3.6 Temperature reactivity coefficient
Considering the inherent safety of the reactor,the temperature reactivity coefficient(TRC)must be negative.The TRC can be decomposed into fuel TRC (FTRC) and graphite TRC (GTRC).The FTRC was divided into the TRC caused by the density effect (fuel density coefficient)and the TRC resulted from the Doppler effect (the fuel Doppler coefficient) [32].
With the LEU startup fuel and the Th-U startup fuel,the Doppler TRCs,GTRCs,and total TRCs for 10%VFand 8 mol%HNwere calculated when natural uranium burnup was the largest for different core volumes.The standard deviation ofkeffwas about 0.00005,resulting in a statistical error of 0.12 pcm/K for the total TRC.The results are presented in Fig.24.

Fig.24 (Color online) Density,Doppler,Graphite,and total TRCs for a 4 m core diameter,LEU startup fuel;b 6 m core diameter,LEU startup fuel;c 10 m core diameter,LEU startup fuel;d 4 m core diameter,Th-U startup fuel;e 6 m core diameter,Th-U startup fuel;f 10 m core diameter,Th-U startup fuel
Different startup fuels lead to different trends in TRCs changing with time.The total TRC was mainly affected by GTRC.With the LEU startup fuel,the GTRC increased quickly and then decreased.With the Th-U startup fuel,the GTRC took more time to reach its maximum and then slowly declined.For the same volume,the Th-U startup fuel model had a more negative total TRC than the LEU startup fuel model.For the same startup fuel model,the larger the volume,the more positive the total TRC was.
When the core diameter is greater than 4 m with the LEU startup fuel,the total TRC can be positive during the operation time.For the Th-U startup fuel schemes,the total TRC can be positive when the core diameter is greater than 6 m.Therefore,it is recommended to use the scheme less than or equal to 6 m core diameter with the Th-U startup fuel.
4 Conclusion
A once-through molten salt reactor using enriched uranium and thorium was examined in this study.Different molten salt volume fractions (VFs),initial heavy metal concentrations (HN0s),feeding uranium enrichments(EFUs),core volumes,and thorium addition have varying effects on burnup.The conclusions are as follows:
WhenVFis between 10 and 15%,the natural uranium burnup is maximum.WhenVFis very small,the neutron absorption of graphite is large,which is not conducive to burn up.WhenVFis large,the energy spectrum is hard,and the fission cross-section decreases,which is unfavorable for burnup.Therefore,the burnup is at its maximum at 10-15% ofVF.
The maximum burnup area is usually concentrated in the 7-10%HN0range.The region moves towards the smallerHN0as theEFUand core volume decrease.
WhenEFUis greater than 20at%,the burnup reaches saturation.This is because when theEFUis too small,the neutron absorption of238U is too high,which is not conducive to fission.When theEFUis too large,the increase in the number of fission products is not conducive to burn up.
The Th-U startup fuel provides a higher conversion ratio and burnup than the LEU startup fuel.Maximum natural uranium burnup increases by 3.1 GWd/tUnatfor the single lattice model.This is because the conversion of232Th replaces238U,and the neutrons absorbed by233U fission are higher than239Pu.Therefore,the Th-U startup fuel model has a stronger neutron regeneration capacity and requires less fuel,which is better than the LEU startup fuel model in terms of burnup.The volume of the reactor core has a positive relationship with burnup because of the negative relation of neutron leakage with the core volume.
The reactor core with the maximum natural uranium burnup calculated in this study was 10%VF,8%molHN0,20at%EFU,10 m core diameter,and with the Th-U startup fuel.Combined with the analysis of the TRC,based on ensuring that the total is negative and considering the selection of calculation points and the different volume requirements of actual reactor cores,we recommend core schemes with 10-15%VF,7-9 mol%HN0,20 at%EFU,less than or equal to 6 m core diameter,and the Th-U startup fuel.
This study provides a reference for the core design of a once-through molten salt reactor.Compared with other optimization studies on the burnup of molten salt reactors,the parameters studied in this study are more comprehensive.Considering this,we will carry out further calculation of the main safety parameters,such as the temperature reactivity coefficient and the effective delayed neutron fraction,so as to select the scheme that meets the safety requirement and achieves the maximum economic efficiency.
Author contributionsAll authors contributed to the study conception and design.Material preparation,data collection,and analysis were performed by Meng-Lu Tan,Gui-Feng Zhu,and Zheng-De Zhang.The first draft of the manuscript was written by Meng-Lu Tan and all authors commented on previous versions of the manuscript.All authors read and approved the final manuscript.
杂志排行

Nuclear Science and Techniques的其它文章
- Calibrating the linearity between grayscale and element content for X-ray KES imaging of alloys
- High RF power tests of the first 1.3 GHz fundamental power coupler prototypes for the SHINE project
- Studies of the radiation environment on the Mars surface using the Geant4 toolkit
- Evaluation of neutron beam characteristics for D-BNCT01 facility
- Modular next generation fast-neutron detector for portal monitoring
- A novel 4D resolution imaging method for low and medium atomic number objects at the centimeter scale by coincidence detection technique of cosmic-ray muon and its secondary particles