A novel 4D resolution imaging method for low and medium atomic number objects at the centimeter scale by coincidence detection technique of cosmic-ray muon and its secondary particles
2022-02-23XuanTaoJiSiYuanLuoYuHeHuangKunZhuJinZhuXiaoYuPengMinXiaoXiaoDongWang
Xuan-Tao Ji • Si-Yuan Luo • Yu-He Huang • Kun Zhu • Jin Zhu • Xiao-Yu Peng • Min Xiao • Xiao-Dong Wang
Abstract The muon radiography imaging technique for high-atomic-number objects (Z) and large-volume objects via muon transmission imaging and muon multiple scattering imaging remains a popular topic in the field of radiation detection imaging.However,few imaging studies have been reported on low and medium Z objects at the centimeter scale.This paper presents an imaging system that consists of three layers of a position-sensitive detector and four plastic scintillation detectors.It acquires data by coincidence detection technique of cosmic-ray muon and its secondary particles.A 3D imaging algorithm based on the density of the coinciding muon trajectory was developed,and 4D imaging that takes the atomic number dimension into account by considering the secondary particle ratio information was achieved.The resultant reconstructed 3D images could distinguish between a series of cubes with 5-mm-side lengths and 2-mm-intervals.If the imaging time is more than 20 days,this method can distinguish intervals with a width of 1 mm.The 4D images can specify target objects with low,medium,and high Z values.
Keywords Image reconstruction · Monte Carlo simulation · Non-destructive detection
1 Introduction
In 1936,a cosmic-ray muon was discovered in an electromagnetic field[1].A muon is a particle produced by high-energy cosmic rays interacting with atoms in the earth’s atmosphere through cascade clustering,with a mass of 105.7 MeV/C2,which is 207 times the mass of an electron,and a lifetime of approximately 2.2 microseconds.It reaches the earth’s surface with an average energy of approximately 3-4 GeV(maximum energy can reach TeV)and a flux scale of 1 cm-2min-1.The angular distribution of the muon intensity is approximately proportional to cos2θ,whereθis the zenith angle [2].Cosmic-ray muons lose their kinetic energy by Coulomb scattering,which is described by the Bethe-block formula [3].Apart from the cosmic-ray muon source,the determination of an artificial muon source is a popular research topic [4-7].

Cosmic-ray muons have the unique advantage of being highly penetrating and non-destructive.Therefore,they can be used in imaging techniques.Current muon imaging technologies can be divided into muon multiple scattering imaging and muon transmission imaging.Muon multiple scattering imaging was first applied to detect high-atomicnumber (Z) objects in a short period of time by analyzing the scattering angle of muons together with the point of closest approach (POCA) algorithm in 2003 [8].Subsequently,this technology is primarily applied for imaging high-Zobjects.A large-area muon detector system named CRIPT was constructed,which is based on scintillators and wavelength-shifting fibers to detect potential uranium or plutonium material in a container [9,10].After the Fukushima nuclear accident,nuclear material debris inside the reactor were imaged using the muon scattering imaging technique [11].It can also be used to identify different materials [12-14].For muon transmission imaging,this technology reconstructs the image of the target objects by analyzing the change of muon flux after muons penetrate objects and is generally aimed at a large volume and natural terrain.In 1970,hidden chambers in pyramids were discovered by applying the muon transmission imaging technique [15].Various research groups have investigated the application of similar techniques to volcano monitoring[16-21],bulk ship imaging [22],and lunar shadow observations [23].In 2017,the study on the imaging of a large void in Khufu’s pyramids using muon transmission imaging was published [24].Furthermore,significant progress was made in China in 2020,where a research team completed the muon transmission imaging of the Changshu Underground Trench [25].In addition,many types of position-sensitive detectors to detect muons have been designed to adapt to different target objects.For the imaging of targets with large volumes,such as volcanoes and pyramids,many research teams have applied scintillation detectors as position-sensitive detectors[17,26,27].These detectors have very large sensitive volumes (more than 1000 mm×1000 mm),but their position resolution is relatively poor (less than 10 mm).For imaging materials with a highZ,a series of gas detectors with a high position resolution (better than 0.5 mm) has been constructed[28-30],and Micromegas detection with a position resolution of 0.075 mm was introduced [31].
Both muon transmission imaging and muon multiple scattering imaging essentially reconstruct images based on the change in muon trajectory or flux before and after the muon penetrates the target objects.They are more adaptable for reconstructing high-Zobjects and imaging largevolume objects.The secondary particles produced by the muon also carry information about the target object.If the information carried by these secondary particles can be fully utilized,more characteristics of the target object can be observed in a single experiment.Based on secondary particle information,the Muon Camera (MUCA) was designed and used for experiments on imaging bovine bones [32-34],compensating for the insufficient imaging of low and mediumZobjects.However,the information implied by secondary particles should be further explored for muon imaging.
A new imaging system based on muons and its secondary particle detection technique is proposed and designed in this work.The system consists of three layers of a position-sensitive detector and four fast time response plastic scintillation detectors with a total volume of 0.125 m3.It fully combines the advantages of a high position resolution and fast response time.Incident muon trajectories have been obtained using position-sensitive detectors,and secondary particles have been measured using plastic scintillators.In terms of the imaging principle,an algorithm was developed for 3D imaging based on the coinciding muon trajectory density.The resolution of the atomic number dimension is accomplished by secondary particle information,that is the reconstruction of 4D images.
2 Secondary particle production and performance
The physical processes,energy spectra,and polar angle distributions of the secondary particles are studied in this section.It should be noted that secondary particles include secondary gamma rays,electrons,and a few positrons.As the number of positrons is several orders of magnitude lower than the those of the other particles,only secondary gamma rays and electrons were considered here.
2.1 Geant4 simulation
2.1.1 Geometry of the detector system
Simulations were performed using GEANT4.10.6p-03.The generic model was visualized using the Geant4 OpenGL interface,as described in Fig.1.The detector system consisted of two parts.The first part was the muon trajectory detector module,which was made up of three layers of position-sensitive detectors and used to obtain the precise position of muon hits and reconstruct muon trajectories.Each detector was 400 mm×400 mm×10 mm in size,with a distance of 50 mm between the bottommost top detector and the topmost bottom detector.This part was located at the top of the detector system.They consisted of micro-filter gaseous detectors.The second part was defined as the secondary particle detector module,which was used to detect secondary particles.It consists of four EJ200 scintillation detectors and has a boxlike shape surrounding the target object.This module was designed to be very large to detect as many secondary particles as possible.The dimensions of each scintillation detector were 500 mm×500 mm×50 mm.Compared with the muon multiple scattering imaging system,the new imaging system only added four scintillation detectors;thus,the two can be readily adapted to each other.The white cube at the center was a target object with dimensions of 20 mm×20 mm×20 mm.When an incident muon penetrated the cube,there was a certain probability that secondary particles would be produced and recorded by the secondary particle detector module.A series of Geant4 simulations were developed to study secondary particle generation processes and to carry information about the target objects.

Fig.1 (Color online) The geometry of the detector system.(Color figure online)
2.1.2 Primary particles
The G4VUserPrimaryGeneratorAction class in Geant4 defines the primary particles.The particle name was defined as the mu-,and the energy spectrum obeyed the natural distribution;more detailed information can be found in Tanabashi,Grp,Hagiwara et al.[3] (The average energy is 3-4 GeV,and the maximum energy can reach the TeV level).In order to simulate the zenith angle of the cosmic-ray muon,the momentum direction was selected from the cos2θdistribution.Therefore,the larger the polar angle and the smaller the amount of incident muon,the more the amount of the initial muon that is inserted in the vertical angle will be.Each initial position of the muon is chosen as follows:Thez-coordinate was fixed above the muon trajectory detector module.Thex-coordinate and y-coordinate were selected from the uniform range,fromxmintoxmaxandymintoymax,respectively.
2.1.3 Physics lists
Physical processes can be defined by the G4VModular Physics class in Geant4.There were four modules of physics in the simulation:G4DecayPhysics,G4RadioactiveDecayPhysics,G4EmstandardPhysics,and G4OpticalPhysics.
2.1.4 EventAction
The event action class is defined based on G4User-Event Action.At the beginning of each event,the muon trajectory detector module and secondary particle detector module were assigned a value of 0.When the secondary particles passed through the scintillation detectors,the value of the secondary particle detector module was assigned as 1,and the information of the secondary particles was recorded.
2.2 Secondary particles produced by a muon
Ionization,bremsstrahlung,and pair production are the three principal types of interactions between muons and the target objects.When the target object’s material is Fe,the energy loss of the muon by different interactions with limited physical processes is shown in Fig.2.It can be seen that the ionization energy loss varies little with the change in its energy,and this is the primary means through which muons lose their energy below 570 GeV.In addition,the energy loss caused by the bremsstrahlung and pair effect increases rapidly with the increase in muon energy and finally takes the dominant position after the muon energy goes beyond 570 GeV.Thus,for cosmic ray muons with an average energy of approximately 3-4 GeV,the secondary electrons are primary ionized δ electrons and secondary ionized electrons.Secondary gamma is produced by the bremsstrahlung of the secondary electrons.

Fig.2 The energy loss of a muon with different interactions [35]
2.3 Secondary particle energy spectrum
Figure 3 a and b shows the secondary electron and gamma energy spectra derived from the Geant4 simulation results,respectively.In terms of the secondary electrons,the energy spectrum did not vary significantly for different materials.The counts first increase and then decrease withZ,owing to ionization and self-absorption effects that vary withZ.Therefore,a target objects with a mediumZhave the highest secondary electron count.As for the secondary gamma,because the δ electrons produced by muon ionization can continue to ionize with the target object,and then bremsstrahlung,the peak of the secondary gamma energy spectrum is primarily concentrated at below 1 MeV.Furthermore,with an increase inZ,the peak shifts to the right,and the counts increase owing to the growth of ionization energy loss and the weak self-absorption of the gamma rays.It can be seen that the counts of secondary particles vary considerably in the energy range of 0.1-100 MeV.Therefore,the counts of secondary electrons and secondary gamma in this range can potentially distinguishZof the target object.

Fig.3 (Color online)The energy spectrum and polar angle distribution of secondary particles.a The secondary electron energy spectrum.b The secondary gamma energy spectrum. c The polar angle distribution of secondary electrons. d The polar angle distribution of secondary gamma.(Color figure online)
2.4 The polar angle distribution of secondary particles
Figure 3c and d show the polar angle distribution of the secondary particles.To obtain the angle information of all secondary particles,the angle leaving the target object was recorded in place of the information recorded by the scintillators.The horizontal coordinate represents the angle between the secondary particle and the muon trajectory.It can be seen that both the secondary electrons and gamma rays are most likely to exit along the muon trajectory.For Pb and U,the probability of the secondary electrons being emitted in the direction opposite to the incident muon is higher than that of other materials.This is because the secondary electrons are more likely to be deflected at a large angle for target objects with a higherZ.In addition,Zof the target objects has a limited effect on the polar angle distribution.
3 Principle
3.1 Coinciding muon trajectory
In the Geant4 simulation,the incident muon trajectory is only recorded as a coincident muon trajectory if both the muon trajectory detector module and the secondary particle detector module respond in a short time window.Because the speed of muons and their secondary particles is very close to the speed of light,this short time is approximately 1 ns.Furthermore,the EJ200 scintillator for secondary particle detection has fast response time (rise time 0.9 ns,decay time 2.1 ns) and short pulse width (FWHM=2.5 ns) to distinguish secondary particles from background noise.Because secondary particles are generated by the process in which muons pass through the material and then ionize,the coinciding muon trajectory is a line that penetrates the target material in an ideal environment.Considering that an actual experimental environment exists in air,the coinciding muon trajectory has a high probability of passing through the target object.Because the muon trajectory changes very little when penetrating the low and mediumZobjects,it is assumed that the incident muon trajectory does not change;that is,the trajectory is a straight line.If sufficient coincident muon trajectories have been obtained,the target object can be reconstructed.
3.2 Imaging algorithm
The section where a large number of coinciding muon trajectories cross each other reflects the area where the target object is located.A method to confirm this is shown in Fig.4.The first step is to set a series of mathematical planes and then calculate each coordinate of the intersection points of all coinciding muon trajectories with all given mathematical planes,as shown in Fig.4a.The second step is to select the highest density area of the intersection points,as shown in Fig.4b.The intersection point is represented by a dot.The hollow white dot indicates that the intersection point is outside the object,and the solid green dot indicates that it is inside the object or it indicates a good reconstruction event.The third step is to convert the selected point into the assignment of each voxel,as shown in Fig.4c.As a result,by showing the assignment of each voxel,the 2D and 3D images of the target object can be reconstructed.
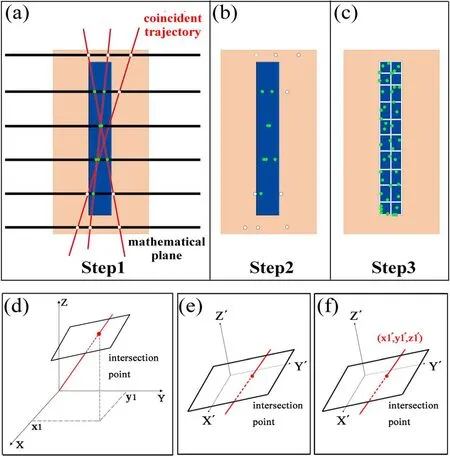
Fig.4 (Color online) The schematic of the imaging algorithm principle. a Step1:calculate each coordinate of the intersection points of all coincident muon trajectories with all given mathematical planes. b Step2:select the highest density area of intersection points. c Step3:convert the selected point into the assignment of each voxel.d The schematic that the given mathematical plane is not perpendicular to the Z-axis.e Establish a new coordinate system X′ Y′ Z′. f Convert the coordinates of the intersection point to the original coordinate system XYZ.(Color figure online)
When each given mathematical plane is perpendicular to theZ-axis,the method of calculating the intersection point coordinates is equivalent to calculating the intersection of a three-dimensional line with a plane perpendicular to theZaxis.The distribution of the intersection points along theZaxis is different,and the highest density of intersection points reflects theZ-value of the target object’s height.The production of secondary particles was dominant during this interval.When the given mathematical plane is higher or lower than the height of the target object,the distribution of the intersection points shows a radial and mesh pattern.Thus,if we select a high-density intersection area by a certain threshold,the height of the target material will be determined.This algorithm can be modified one step further.The given mathematical planes are not perpendicular to theZaxis,as shown in Fig.4d.Similarly,the target objects distribution along the direction of the normal vector to the mathematical plane can be obtained.Furthermore,it is possible to obtain the distribution of the object along different normal vectors by continuously changing the given mathematical plane,which can increase the accuracy of the tomography.However,it is more complex to calculate the intersection point coordinates when the given mathematical plane is not perpendicular to theZ-axis.A less complicated calculation method is displayed as follows:First,we establish a new coordinate systemX′Y′Z′,whoseZ′-axis is perpendicular to the given mathematical plane,as shown in Fig.4e.The basis vectors(i,j,k) of the original coordinate systemXYZcan be converted to the basis vectors (I′,j′,k′) of the new coordinate systemX′Y′Z′using the following equation:

whereα1,α2,andα3denote the angle between theX-axis andX’-axis,Y’-axis as well asZ′-axis,respectively.Similarly,β1,β2,β3,γ1,γ2,andγ3represent the angles between theY-axis,Z-axis,and the axes of the new coordinate system.Thus,in the new coordinate systemX′Y′Z′,the coordinates of the intersection point system can be calculated by imitating the method in which the given mathematical plane is perpendicular to theZ-axis.Second,as shown in Fig.4f,the coordinates of the intersection points in the new coordinate systemX′Y′Z′are converted to the coordinates in the original coordinate systemXYZusing the following equation:

wherex1,y1,andz1are the intersection coordinates when the given mathematical plane is not perpendicular to theZaxis.
4 Reconstruction of 3D image
4.1 The result of 3D imaging
As ionization loss and self-absorption effects are influenced by theZof the target object,the imaging effects of various materials will be different.Figure 5a and b show the 3D image and top view image of five cubes with a volume of 20 mm×20 mm×20 mm.The materials of the cubes were H2O,Al,Fe,Pb,and U,respectively.It is important to note that because the amount of data of U is much more considerable than that of H2O,direct imaging will not show water.Hence,simulations were performed for each of the five materials under the same conditions and then converged to compare the imaging effect.As for the images of Pb and U,due to the strong self-absorption effect of the high-Zmaterial,secondary particles generated inside the cube are difficult to penetrate,and there are large voids in the Pb and U images at the center of the cubes.Therefore,while imaging a high-Ztarget object,there is a chance that the central part’s information of the object will be lost.In addition,when the muon passes through the high-Ztarget object,it cannot be assumed that the muon trajectory is a straight line.Therefore,when applying this algorithm to objects with a higherZ,the error will be larger than that of other materials.As for Al and H2O,since the ionization loss increases withZ,meaning that low-Zmaterials have a smaller amount of data of the coincident muon trajectories,there are also some voids in the images of Al and H2O.However,because this problem is caused by insufficient data,it can be solved by extending the imaging time.Moreover,Fe has the best imaging result compared to the above materials.In summary,this method can be used for imaging objects of medium and lowZ,with mediumZimaging being the best,but not perfectly applicable to highZ.
4.2 3D imaging accuracy
To better study the imaging accuracy of this method,Fe was used for the eight cubes because it provides the best imaging effect.Figure 5c and d show a 3D image and a top-view image of eight iron cubes with a height of 20 mm.For one column,the intervals of the cubes gradually decreased to 4,2,and 1 mm.For the other column,the volume of cubes progressively decreased in the order of 20,15,10,and 5 mm.All eight cubes were imaged simultaneously.Because the best position resolution achievable in the experiment is approximately 0.1 mm,in order to simulate the actual experimental condition,the position information of the muon trajectory detector module randomly added 0.1 mm position resolution with a Gaussiandistribution.There were approximately 9×10⁶muons generated in the muon trajectory detector module,which was equal to 4 days muon flux.As a result,the size and position of all the other restricted cubes match the modeling of Geant4.A cube with a side length of 5 mm and an interval of 2 mm were clearly visible.However,a 1-mm-interval of cubes in the first line cannot be observed.In addition,because the volume of the cube with a side
length of 5 mm is too small,after determining the height of the target object using the threshold value,the height of the reconstructed image is approximately 4 mm shorter than that of the other cubes.As a result,after setting the muon flux to a 4 days imaging time and adding a 0.1-mm position resolution to the imaging system,this method can accurately reconstruct the size and position of the target object,and its accuracy reaches a level that targets objects with a side length of 5 mm,and an interval of 2 mm can be easily distinguished.
4.3 Influence of position resolution to 3D imaging
Position resolution is a very important property for detectors with a good sensitivity to position.This means that the minimum interval between two incident particles can be distinguished by a position-sensitive detector.Because of this,position resolution directly influences the quality of the reconstructed image.Considering that the position resolution is no better than 0.1 mm on most occasions,the imaging quality of poorer position resolution has been studied.In the Geant4 simulation,maintaining the muon flux to a 4 days level,the reconstructed images with position resolutions of 0,0.2,and 0.4 mm are shown in Fig.5e,f,and g.As the position resolution increases,the edge of the reconstructed image becomes increasingly dim,and its volume increases slightly.The perfect position resolution was 0 μm.Based on this condition,the 2-mminterval of cubes in the first line was clear,but the 1-mminterval remained invisible.When the position resolution grew to 0.2 mm,the 2-mm-interval was mostly filled,making them difficult to distinguish.Finally,at 0.4 mm,the widest 4-mm-interval can hardly be distinguished.In addition,among the four cubes of the second line,the last cube with a side length of 5 mm was reconstructed to an image that is close to a circle,which is not equal to the modeling.However,the same distortion did not occur in the three bigger cubes in front of it.A conclusion can be drawn by referring to the imaging effect with a position resolution of 0.1 mm shown in Fig.5d.That is,when the position resolution is better than 0.1 mm,the 2-mm-interval can be distinguished,but as it falls to 0.2 mm,the minimum distance between two distinguishable objects has to grow to 4 mm.If the position resolution is only 0.4 mm,the 4-mm-intervals and 5-mm-side length will all be indistinguishable.However,despite the poor position resolution,cubes with side lengths of 20,15,and 10 mm can still be correctly reconstructed.

Fig.5 (Color online)Reconstructed 3D images and top view images of targeted objects. a 3D image of various materials. b Top view image of various materials.c 3D image of cubes with different side lengths and intervals.d Top view image of cubes with different side lengths and intervals. e 0-mmposition resolution’s imaging result. f 0.2-mm-position resolution’s imaging result.g 0.4-mm-position resolution’s imaging result. h 20 days’imaging result. i 1 day’s imaging result. j 0.25 day’s imaging result.(Color figure online)
4.4 Influence of imaging time to 3D imaging
The imaging time directly influences the number of acquired data.After adding a 0.1-mm-position resolution to the muon trajectory detector,the imaging results with imaging times of 20 days,1 day,and 0.25 days were simulated,as shown in Fig.5h,i,and j.With 20 days imaging time,the minimum distinguishable interval is 1 mm,because there are approximately 5×10⁷muons injected in the detector.When the imaging time is 4 days or 1 day,the 2-and 4-mm-interval can be distinguished.However,if the imaging time to 0.25 days,a significant shower distortion will occur on the reconstructed image,and the 4-mm-interval together with the cubes in the first line will be difficult to discern.Overall,if the imaging time is 20 days,4 days,and 1 day,respectively,this method will accurately distinguish cubes with a side length of 5 mm and respective intervals of 1,2,and 4 mm.If the imaging time is no longer than 0.25 days,reconstructing objects at the centimeter scale in three dimensions would be challenging.
5 Reconstruction of 4D image
5.1 The ratio of secondary electron to secondary gamma
According to Fig.3a and 3b,the counts of the secondary electrons and gamma vary with theZof the target object.Thus,it is possible to study the likeliness of secondary particle generation to distinguish theZof the target objects in the 0.1 to 100 MeV range,as shown in Fig.6a.For Pb,100 incident muons produce approximately 17 secondary electrons and 74 secondary gamma rays.It can be seen that the ratio of these two secondary particles varies with the material.Thus,the ratio of secondary electron counts to secondary gamma counts with various values ofZwas calculated,as shown in Fig.6b.As Z increased,the ratio consistently decreased.Therefore,theZof the target object can be determined by the section in which the ratio lies.

Fig.6 (Color online)The variation of secondary electrons and gamma counts with various Z.a The likeliness of secondary particle generation.b The variation of the ratio of secondary electron to secondary gamma with various Z.(Color figure online)
5.2 Result of 4D imaging
4D imaging adds atomic number dimension resolution to 3D imaging.The 4D images were reconstructed as follows:First,secondary electrons and secondary gamma are used to reconstruct the coinciding muon trajectories and reconstruct the 3D images,respectively.In this way,two three-dimensional matrices can be obtained.Then,we divide the corresponding voxels in the two three-dimensional matrices and obtain a new three-dimensional matrix.The assignment of voxels in this new matrix is the ratio of secondary electrons to secondary gamma.If these voxels are converted into colors,a 4D image is achieved.The 4D imaging results of an imaging time of 20 days and a 0.1-mm-position resolution are shown in Fig.7a and b.The target objects were five cubes with dimensions of 20 mm×20 mm×20 mm,whose materials were H2O,Al,Fe,Pb,and U,respectively.All five cubes were imaged at the same time.From the top view,it is apparent that the five materials can be distinguished by the ratio of secondary electrons to secondary gamma.However,loops with different colors surround the cubes because the secondary electrons generated on the surface of the target objects are not easily absorbed,leading to a higher voxel ratio compared to that on the interior.It should be noted that the ratio also varies with volume.Therefore,a database that includes different volume ratios and different material ratios can better specify the target objects.

Fig.7 (Color online)Reconstructed 4D images and top view images of target objects.a 4D image of five materials. b Top view image of five materials. c 5 days imaging result. d 12 h imaging result. e 3 h imaging result.(Color figure online)
5.3 Influence of imaging time to 4D imaging
The 4D imaging results for different imaging times are shown in Fig.7c,d,and e.When the imaging time is 5 days,the imaging system can distinguish objects with low,medium,and highZ.If the imaging time decreases to 12 h,the target objects of medium and highZwill be difficult to discern,but the target objects with lowZcan be clearly visualized.As the imaging time decreases to only 3 h,the reconstructed 4D image fails to distinguish the shape of target objects,but is still available to specify low-Ztarget objects from those with mediumZ.Therefore,target objects with low and mediumZcan be easily distinguished,but those with medium and highZare less distinguishable.Furthermore,it is widely known that muon multiple scattering imaging is more applicable to target objects with medium and highZ.Considering that these two imaging systems can adapt to each other,a much better imaging result will be achieved by combining them.
6 Conclusion
A muon imaging method based on the coincident muon trajectory was studied,which includes the physical processes of secondary particle generation,3D imaging,and 4D imaging.Secondary particles are primarily produced by muon ionization and δ electron bremsstrahlung,including electrons and gamma rays.The secondary electron energy spectrum does not vary much withZ,while the peak of the secondary gamma energy spectrum gradually moves to the higher energy part asZincreases.For the imaging result,for the condition of 0.1-mm-position resolution on the muon trajectory detector module,3D images with an acceptable level of accuracy of 5-mm-side length and 2-mm-intervals can be obtained.If the imaging time is longer than 20 days,this method can characterize a 1-mminterval.In 4D imaging,low-,medium-,and high-Ztarget objects can be distinguished.However,when the imaging time is less than 0.5 days,it can only distinguish target objects with lowZbetween those with medium or highZ.Moreover,a database of different volumes and different materials would perform better.
Author contributionsAll authors contributed to the study conception and design.Material preparation,data collection,and analysis were performed by Xuan-Tao Ji,Si-Yuan Luo,Yu-He Huang,and Xiao-Dong Wang.The first draft of the manuscript was written by Xuan-Tao Ji,and all authors commented on previous versions of the manuscript.All authors read and approved the final manuscript.
杂志排行

Nuclear Science and Techniques的其它文章
- Calibrating the linearity between grayscale and element content for X-ray KES imaging of alloys
- High RF power tests of the first 1.3 GHz fundamental power coupler prototypes for the SHINE project
- Studies of the radiation environment on the Mars surface using the Geant4 toolkit
- Evaluation of neutron beam characteristics for D-BNCT01 facility
- Modular next generation fast-neutron detector for portal monitoring
- Improved formation density measurement using controllable D-D neutron source and its lithological correction for porosity prediction