壁面结构对三维可压缩气泡群影响的数值模拟研究*
2022-02-18王金城卫志军吴锤结
王金城,关 晖,卫志军,吴锤结
(1.大连理工大学 航空航天学院,辽宁 大连 116024;2.国防科技大学 气象海洋学院,长沙 410073;3.大连理工大学 海岸和近海工程国家重点实验室,辽宁 大连 116024)
(我刊编委吴锤结来稿)
Introduction
Dam-break hydraulics is an increasingly critical topic in the fields of water resources development,environmental protection and ecological management.Over the last several decades,people have been attempting to deepen their understanding of dam-break hydraulics.Because real-time field measurement is difficult to achieve,major dam-break research is carried out in laboratories or on high performance computers[1-2].
The previous experimental studies primarily focused on dynamics and kinematics of the dam-break flow.Lobovský et al.mainly analyzed the pressure loads on the downstream vertical wall during the wave impact[3].Martin et al.investigated the evolution of the collapsing water column’s height and the position of the wave front[4].
The numerical researchers often applied different kinds of numerical methods to simulate dam-break freesurface flow and compared their results with an experiment to prove the capability of the numerical methods,including the moving-particle semi-implicit method (Koshizuka and Oka[5]),the finite element method (Cruchaga et al.[6]),the constrained interpolation profile method (Hu and Sueyoshi[7]),the SPH method (Colagrossi et al.[8]),the finite volume method (Ma et al.[9]) and so on.All these works dealt with the classical configuration with the downstream vertical wall on which the wave front impact was flat.To the best of our knowledge,however,the relevant study on dam-break flow dynamics with structures on downstream vertical walls has rarely been reported.Besides,in almost all previous works[10-12],the flow dynamics was analyzed with the pressures at several points on the downstream vertical wall.The characteristics of local points’ pressures can not represent the whole wall’s pressure characteristics perfectly.In this paper,the average spatial pressure was chosen to analyze the flow dynamics.
In recent years,numerical simulation of the interaction between bubbles and wall structures has developed rapidly,which introduces new research directions to the study of the dam-break problem.Wang et al.[13]studied the effect of the distance between the cavitation bubble and the solid wall on the collapse of a single cavitation bubble.Li et al.[14]studied the interaction between a fiercely vibrating bubble and a movable sphere near a plane rigid wall by conducting experiments and numerical simulations.Beig et al.[15]investigated the fluid and solid temperatures generated during the collapse of a single gas bubble near a rigid wall for different initial stand-off distances and driving pressures.
In this paper,the VOF method was used to simulate a compressible 2-phase dam-break problem based on a compressible 2-phase solver from the open-source OpenFOAM[16],in which a compressible air cavity can be seen as a compressible bubble and a bubble group will form when a bubble divides into several sub-bubbles by the solid wall structures.Due to Newton’s third law,in every interaction,there is a pair of forces acting on the 2 interacting objects.So,during the process of the interaction of bubbles and wall structures,the average spatial pressure on the wall structures can be used to estimate the effects of the wall structures on the bubble group.The shapes (cuboid,ellipsoid and cone) and geometric parameters (height and length) of the wall structures were changed in order to transform the topology of the bubbles and the way the bubbles collapse.The layout of this paper is as follows:in section 1,governing equations for the compressible 2-phase flow and the algorithm of solving governing equations were described;the case configuration,the post-processing method and the validation of the solver were presented in section 2;the effects of ellipsoidal,cuboidal and conical wall structures on the bubble groups were depicted in section 3;conclusions were given in section 4.
1 Numerical Formulation
1.1 The VOF Method
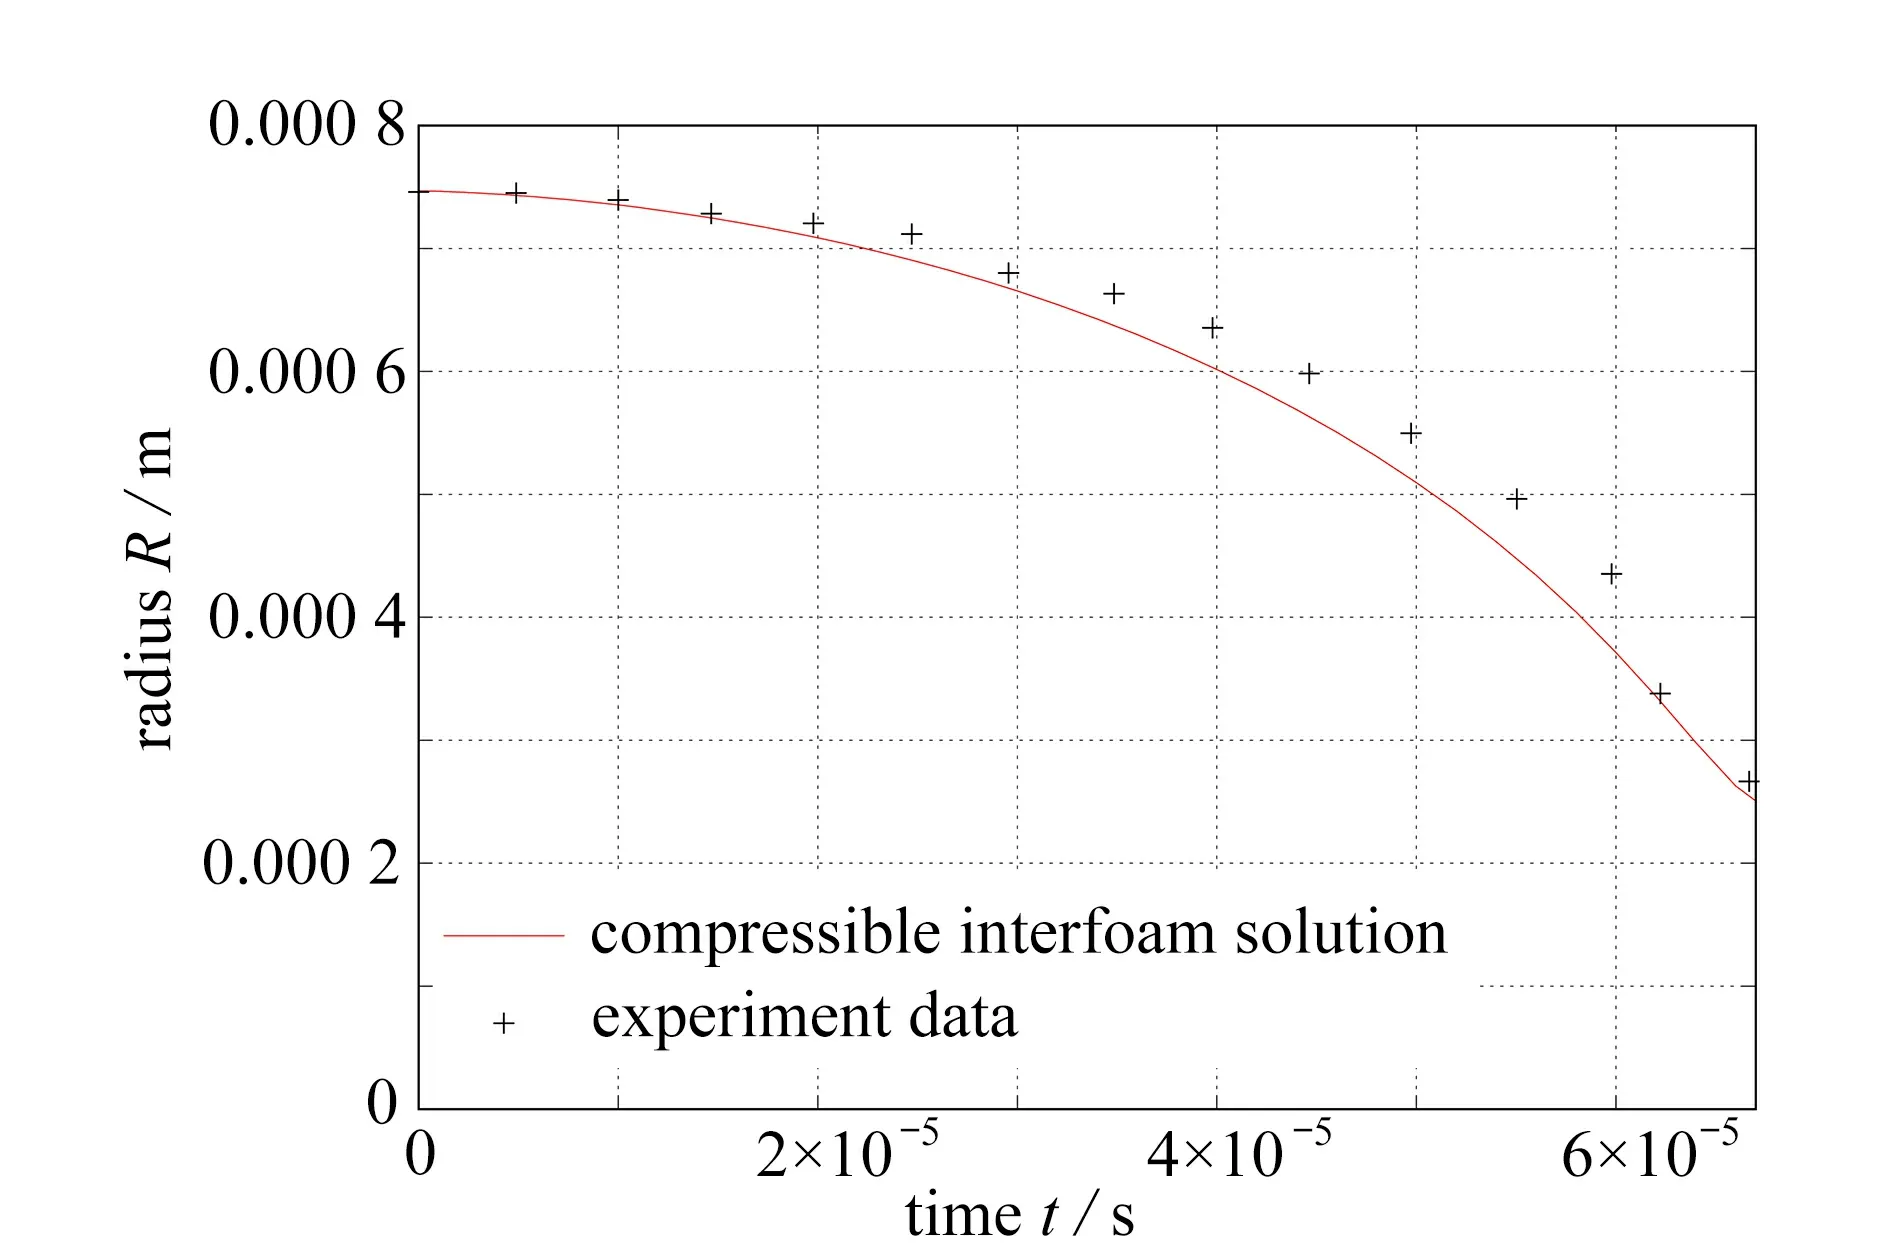
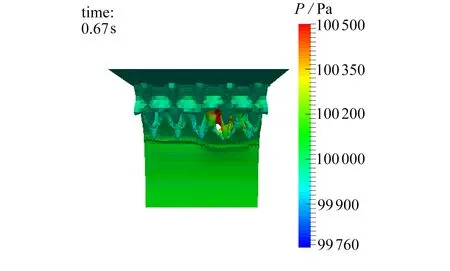
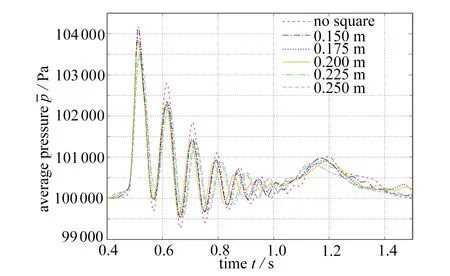
The VOF method[17]is a numerical method for processing 2-phase flow,which generally includes a gas phase and a liquid phase.The basic idea of the VOF method is the use of a function to represent the type of fluid that is referred to as “volume function”F.Fand 1–Frepresent the volume fractions of gas and liquid,respectively,in the computational domain.In terms of a certain computational element,one of the following 3 situations may occur for the volume fraction:(ⅰ) forF=0,the element is completely filled with gas;(ⅱ) forF=1,the element is completely filled with liquid;(ⅲ) for 0 In this study,governing equations were combined with the VOF method used in the simulation of the bubble expansion and collapse process.The continuity equation,the compressible momentum conservation equation,and the state equation of each phase are,respectively, wherei=1 represents the liquid phase,i=2 represents the gas phase;ρiis the density of each phase;αiis the phase fraction of each phase;Uis the velocity;µ is the kinetic viscosity;pis the pressure;gis the acceleration of gravity;σ is the surface tension coefficient;∇α(x) is the outward normal vector of the interface between the 2 phases;ρoiis the initial density of each phase;ψirepresents the compressibility of each phase. The phase fraction satisfies The total density and viscosity can be calculated as To capture the position of the gas-liquid interface,reformulate continuity equation eq.(1) by substituting eq.(3)for ρito get a transport equation for phase fraction α1: The last term on the right hand side of eq.(6) is an artificial term,which restrains the numerical diffusion of the interface[18]. To resolve the pressure,sum up 2 individual equations of eq.(1) and substitute eq.(3) for ρito get a transport equation for the pressure: The PIMPLE algorithm[19],a PISO-like algorithm,in the FVM was used to solve eq.(6),eq.(2) and eq.(7) to get the evolution of variables α1,Uandp. This algorithm has a 2nd-order spatial precision and a 1st-order temporal precision.The governing equations were discretized like these:the time derivative was discretized with the 1st-order implicit Euler scheme,the pressure and velocity gradients with the linear Gaussian schemes,the Laplace operator with the Gaussian linear correction scheme,the convection term with the 1st-order Gaussian upwind scheme,the surface normal gradient term with the 1st-order non-orthogonal correction scheme,and the interface difference with the central difference scheme. For the discretized coupling governing equations,the PISO[20]algorithm for pressure-velocity coupling in the calculation of the transient flow has the following processes: (ⅰ) Momentum prediction:using the pressure field of the previous time step to solve momentum equation (eq.(2)) and obtain the predicted velocity field; (ⅱ) Pressure solution:using the predicted velocity field to solve pressure equation (eq.(7)) and obtain the 1st estimate of the new pressure field; (ⅲ) Explicit velocity correction:using the new pressure field to solve momentum equation (eq.(2)) again and correct the velocity field; (ⅳ) Repeating the above steps until the allowable error is reached. During the momentum prediction,the new density and the surface density meeting the mass continuity equation were needed,and they can be obtained with the old volume flux of the previous step to solve α1equation (eq.(6)).Given that the time step required by the compressed differential scheme[21]is sufficiently small and the change in the density field generated by the new volume flux obtained with the PISO algorithm is negligible,the solution process has substeps including: (ⅰ) Initializing the variables; (ⅱ) Calculating the Courant number and adjusting the time step; (ⅲ) Solving α1equation (eq.(6)) according to the volume flux of the old-time level; (ⅳ) Obtaining new estimates of the viscosity,density,and surface density according to the value of α1and the constitutive relationship; (ⅴ) Conducting momentum prediction according to the new values and continue the PISO algorithm; (ⅵ) At the final moment,entering the next time step and returning to (ⅱ). The computational domain in this study is rather complex.The computational domain without wall structure is a rectangular parallelepiped with a length,a width and a height of 1 m,1 m and 2 m,respectively.For simulations related to the cuboidal wall structure,topological changes were made to the original computational domain and the grid nodes renumbered,where structured grids were still applied.However,for simulations related to the conical and ellipsoidal wall structures,given that the geometric characteristics of hexahedrons are different from those of cones or ellipsoids,pure structured grids cannot be used any longer,and non-structured grids need to be generated near the conical and ellipsoidal wall structures.As are shown in fig.1,the grids are hexahedral structured ones in the domain far from wall structures and hexahedral unstructured grids in the domain near wall structures,except that the grids near cuboidal wall structures are still structured grids. All the boundaries were set to be wall boundary conditions,except that the top boundary was set to be the outlet boundary condition.The boundary conditions of phase fractions,pressures and velocities are listed in table 1. Pressure boundary conditions:the pressure gradient of wall boundary is determined according to the density field at the boundary (buoyant pressure),and the pressure of outlet boundary was the total pressure of the boundary(total pressure). Velocity boundary conditions:the velocity condition of wall boundary was fixed value condition set as 0 in this research,also called the non-slip boundary condition (fixed value).The specific implementation of outlet boundary condition is that when the fluid flows out of the boundary,the velocity at the boundary has a zero gradient;the velocity value at the boundary is the normal component of the internal element value when the fluid flows from the outside (pressure inlet outlet velocity). Table 1 Boundary conditions of each variable Initial conditions:the liquid in the computational domain is a static water column with a length,a width and a height of 1 m,0.187 5 m and 1.5 m,respectively.The rest is static gas.Fig.2 shows the initial configuration of the water column in the case of ellipsoidal wall structures and the initial conditions of the other 2 cases are the same.The dynamic pressure of the liquid and gas are both 105Pa.The gravity accelerationg=9.81 m/s2;the liquid density is 1 000 kg/m3;the gas density is 1 kg/m3. Fig.1 Geometry and mesh of the computational domain with ellipsoids,cuboids and cones:(a) ellipsoidal wall structures;(b) cuboidal wall structures;(c) conical wall structures Fig.2 Initial configuration of the static water column (ellipsoidal wall structures) The algorithms and the codes were validated through simulation of a collapsing laser-induced bubble[22].Compare our results of the bubble radius evolution with the experimental data in the literature[23] in fig.3,one can find that the 2 curves are almost coincident.The discrepancy between the 2 radius curves was introduced by the calculation method for the volume of the numerical bubble.The volume of the numerical bubble is represented by the integral of gas volume fractionFover the whole computational domain,so the accuracy of the numerical bubble volume relies on the size of the smallest grid element. Fig.3 Comparison between the results of the codes used in this study and the experimental data[23] In this validation case,the size of the smallest grid element is 0.16 mm,which is much larger than 0.05 mm,the largest discrepancy of the 2 curves.It means that the discrepancy of the validation case is reasonable under its grid configuration.As a result,fig.3 verifies the effectiveness of the codes and algorithms used in this study. All numerical simulations in this study were carried out on the high-performance parallel cluster at the School of Aeronautics and Astronautics of Dalian University of Technology. The left wall opposite to the initial water column was selected as the pressure-monitoring wall,and the spatial average value of the wall pressure exerted by the bubble and water was taken as a parameter to measure the influence of wall structures on the bubble group.The formula of average pressure is In this expression,subscriptirepresents the index of the cell on the wall,nrepresents the total number of cells on the monitoring wall,Sirepresents the contact area between theith cell and the wall,andpirepresents the pressure of theith cell. With the ellipsoids,cuboids and cones put on the wall,the normal directions of the boundaries on wall structures are no longer the same as that of the original wall boundary.Only the pressure in the direction perpendicular to the original wall boundary is valued,so the value of pressure is projected in the normal direction of the original wall boundary.The projected pressure is Except for special instructions,the pressure in the following articles refers to the average spatial pressure after projection. Numerical experiments were conducted with 3 kinds of grid configurations,in which the numbers of elements in the length direction were 32,64 and 96,respectively,and comparison of the wall pressure evolutions of the 3 was shown in fig.4.It can be found that,although the occurrence time of the peak pressure of the 32-element case is different from those of the 64-element and the 96-element cases,the results of the 32-element grid configuration meet the requirement of the research.Because the goal to get qualitative laws of the effects of wall structures on bubble groups and the oscillation characteristics of pressures is fully achieved in the 32-element case,the 32-element grid configuration was selected to carry out the subsequent simulation. Five equally spaced ellipsoidal wall structures were set up in the computational domain as are shown in fig.1(a).The semi-major axis length of each ellipsoid is 0.05 m and the semi-minor axis length is 0.25 m.The height of the ellipsoidal wall structure is defined as the vertical distance from the bottom boundary to the lowest point of the wall structure,denoted asLz. Fig.4 Comparison of the results from cases where grid numbers are 65 536,524 388 and 1 769 472,respectively:(a) 0~5 s;(b) 0.4~1.5 s Fig.5 The impact process of wall structures,water and bubbles:(a) initial state;(b) before generation of bubbles;(c) generation of bubbles As is shown in fig.5,forLz=0.1 m,driven by gravity,the water hits the step at the bottom and then the wall structures.During this process,air bubbles are generated and the pressure on the wall changes.The evolution of the wall average pressure is shown in fig.6. Fig.6 Wall pressure evolution in the case where ellipsoid height Lz=0.1 m It can be seen that the pressure oscillation tends to subside after 2 s.For the sake of reducing the computational time,the total simulation time was set to 0~2 s. 3.1.1 Analysis for the Mechanism of Pressure Oscillation The peak of pressure oscillation occurs att=0.5 s in fig.6.In fig.7(a),a white sample line was drawn from the bottom of the domain to the top in the flow field att=0.5 s.The pressure and the density along the sample line were shown in fig.7(b) and (c),respectively.The pressure here is no longer the average pressure but the total pressure at a certain point on the sample line.In the combination of the pressure,the density and the flow field at 0.5 s in fig.7,it can be found that the maximum pressure is located at the bottom of the sample line,which indicates that the peak value of pressure oscillation in fig.6 is mainly caused by the compression of the bubbles at the bottom of the domain. Fig.7 Pressure and density distributions along the sample line at 0.5 s:(a) the sample line (white);(b) the pressure along the sample line;(c) the density along the sample line Similarly,in the combination of the pressure,the density and the flow field at 0.57 s in fig.8,it can be found that the minimum pressure is also located at the bottom of the sample line.This indicates that the trough value of pressure oscillation in fig.6 is mainly caused by the rebound (expansion) of the bubbles at the bottom of the domain.The above analysis shows that the compression and expansion of compressible bubbles are the main cause for pressure oscillation on the wall. Fig.8 Pressure and density distributions along the sample line at 0.57 s:(a) the sample line (white);(b) the pressure along the sample line;(c) the density along the sample line 3.1.2 Effects of the Ellipsoidal Wall Structure Height on Pressures and Bubble Groups For a series of heightsLz=0.2~0.8 m (the increment is 0.1 m) of the ellipsoidal wall structures on the left wall,the pressure evolutions are shown in fig.9(a).It can be found that forLz=0.4 m,the pressure is the smallest and is the closest to the pressure curve in the case without ellipsoidal wall structures,as is shown in fig.9(b). Comparison of fig.10 and fig.11 indicates that,the pressure oscillation lasts longer forLz≥0.5 m.The analysis of the flow field reveals the underlying mechanism:forLz <0.5 m,the ellipsoid wall structure is partially wrapped in bubbles,destroying the closure of bubbles,which is essential for oscillation of bubbles.As a result,forLz <0.5 m,the oscillation of pressure subsides ahead of time.Instead,in the case ofLz≥0.5 m,the ellipsoids are not in contact with the bubbles during the process of bubble formation and bubble fragmentation.So the bubble is kept in integrity,leading to longer pressure oscillation. 3.1.3 Effects of the Ellipsoidal Wall Structure Semi-Major Axis Length on Pressures and Bubble Groups The mechanism behind the minimum amplitude of the pressure curve atLz=0.4 m was studied with different semi-major axis lengths of ellipsoids,denoted asLs.Five cases withLschanging from 0.2 m to 0.4 m (length increment is 0.05 m),were set up.It can be seen from fig.12 that the oscillation of pressure subsides earliest forLs=0.4 m.The mechanism behind this phenomenon is shown in fig.13,in which the closure of bubble is destroyed by ellipsoids at 0.67 s (the white part in fig.13 is the connection between the bubble group and the atmosphere).As a result,the ellipsoidal wall structure can reduce the average pressure amplitude and the oscillation time of the pressure.It means that the ellipsoidal wall structure can influence the dynamic behavior of bubbles effectively. Fig.9 Wall pressure evolutions:(a) the cases with ellipsoid height Lz=0.2~0.8 m;(b) the case with Lz=0.4 m and the no-ellipsoid case Fig.11 Wall pressure evolutions and flow fields in the cases with ellipsoid height Lz=0.5~0.7 m Fig.12 Wall pressure evolutiond in the cases with ellipsoid height Ls=0.2~0.4 m Fig.13 The flow field in the ellipsoid wall structure case with ellipsoid height Ls=0.4 m Five cuboids were generated on the left wall of the original computational domain and the geometry and mesh were shown in fig.1(b).The length of the cuboid is 0.25 m and the width is 0.1 m. 3.2.1 Effects of Cuboidal Wall Structure Height on Pressures and Bubble Groups For a series of heightsLz=0.1~0.8 m (increment is 0.1 m) of cuboidal wall structures on the left wall boundary,the results of pressure evolution are shown in fig.14.It is found that,forLz=0.2 m,the pressure oscillation amplitude on the wall with cuboidal wall structures is surprisingly smaller than that of the no-cuboid wall. Fig.14 Wall pressure evolution in cases with cuboid height Lz=0.1~0.8 m Fig.15 Wall pressure evolution in cases with cuboid height Lz=0.15~0.25 m Then,whetherLz=0.2 m is the very condition where the pressure amplitude is the lowest was tested through adjustment of the cuboidal wall structure height by 0.025 m for each incremental step.Five cases with wall structure heightsLz=0.15~0.25 m were handled and the results in fig.15 show that,Lz=0.2 m is the condition for the lowest pressure amplitude.The mechanism for the lowest pressure amplitude phenomenon is shown in fig.16,in which the top surface of the bubble is at the same height as that of the cuboid structure,so the oscillation amplitude of the bubble is limited by the cuboid structure and the projection area of the bubble on the wall is the smallest among all cases.As a result,the average spatial pressure of the wall is the lowest. Fig.16 The flow field in the cuboidal wall structure case with height Lz=0.2 m 3.2.2 Effects of the Cuboidal Wall Structure Length on Pressures and Bubble Groups Next,the cuboidal wall structure height is kept constant,Lz=0.2 m,and cuboid lengthLyis changing.Fig.17 shows the comparison between the pressure evolutions in 6 cases forLy=0.1 m,0.2 m,0.25 m,0.3 m,0.4 m,0.5 m,respectively.It can be found that the pressure oscillation characteristics will disappear forLy=0.5 m. Fig.17 Wall pressure evolutions in the cases with cuboid length Ly=0.1~0.5 m Analysis of the flow field forLy=0.5 m revealed the reason for the disappearance of pressure oscillation.The velocity of water in contact with the cuboids is smaller than that of water not in contact with the cuboids,so the front end of the water not in contact with the cuboids touches the left wall first and the air below the water cannot form closed bubbles at that time,as is shown in fig.18(a).When the water in contact with the cuboids reaches the left wall,the bubbles are formed,and the first peak of the pressure curve is generated at the same time.However,the pressure does not oscillate because the rebound of bubbles is interrupted by the cuboidal wall structures and the bubbles are constrained below the cuboids,as are shown in fig.18(b). Fig.18 The flow field in the cuboidal wall structure cases with cuboid heights Lz=0.2 m and Ly=0.5 m:(a) the flow profile;(b) the bubble contour As a result,the cuboidal wall structure moderates the average pressure amplitude significantly and eliminates the oscillation of pressure.It means that the cuboidal wall structure can change the dynamic behaviour of bubbles notably. Conical geometric shapes were generated with grids,as are shown in fig.1(c).The radius of the cone isRc=0.05 m and the length of it isHc=0.25 m. 3.3.1 Effects of the Height and Length of Cones on Pressures and Bubble Groups For a series of heightsLz=0.1~0.8 m (increment is 0.1 m) of conical wall structures on the left wall boundary,the results of pressure evolutions are shown in fig.19.The amplitude of pressure oscillation in the case ofLz=0.2 m is smaller than other cases,and the duration of pressure oscillation on the wall with cones is longer than that on the wall without cones. The case ofLz=0.2 m was selected to study the effects of the length of the conical wall structures on the pressure oscillation with changing lengthHcof the cones.Fig.20 shows pressure evolutions under 6 conditions:Hc=0.2 m,0.25 m,0.3 m,0.35 m,0.4 m,0.45 m.It can be seen that the pressure oscillation amplitude is the smallest forHc=0.45 m.But compared with the pressure curve of the wall without cones,the pressure amplitude in the case ofHc=0.45 m is still larger.As a result,the conical wall structure can influence the dynamic behaviour of bubbles but cannot lower the average pressure amplitude. Fig.19 Wall pressure evolutions in the cases with cone lengths Lz=0.1~0.8 m Fig.20 Wall pressure evolutions in the cases with cone lengths Lz=0.2~0.45 m In this study,the effects of wall structures on the bubble groups near the wall were explored with different shapes of wall structures (e.g.ellipsoids,cuboids and cones) and different geometric parameters (e.g.heights and lengths).The effects were indicated by the average pressures on the wall exerted by the bubble groups.Different parameters of wall structures will influence the topological structures of the compressible bubble groups,and then the oscillation characteristics of the bubbles.The changes of bubble oscillation characteristics directly lie in the changes of the pressure evolution curves.It is found,through comparative analysis,that 1) The maximum and minimum values of the average wall pressures are mainly caused by the volume oscillation of the bubbles; 2) The duration time of oscillation is related to the integrity of bubble groups; 3) Appropriate adjustment of ellipsoidal wall structure heightLzand semi-major axis lengthLscan significantly reduce the amplitude and oscillation duration of the average wall pressure; 4) Appropriate adjustment of cuboidal wall structure heightLzand lengthLycan notably reduce the amplitude of the average wall pressure and eliminate the oscillation of the wall pressure; 5) Adjustment of conical wall structure heightLzand lengthHchas no effect on reduction of the average pressure amplitude of the wall; 6) Therefore,in summary,all the 3 kinds of wall structures could change the topology of the bubble groups and influence the dynamic behaviours of the bubble groups.Cuboidal wall structures have the most significant effects. In this study,many conclusions about the qualitative effects of wall structures on bubble groups were obtained through phenomenological study.An important physical phenomenon during the bubble collapse process is the emergence of the shock wave,which could cause larger damage to the wall structure.Therefore,developing a solver capable of capturing shock waves to study the effects of wall structures on the shock waves produced by bubble groups is one of valuable research directions in the future.1.2 Compressible 2-Phase Flow Governing Equations


1.3 Numerical Implementation


2 Case Description
2.1 Mesh
2.2 Boundary and Initial Conditions


2.3 Validation of the Code

2.4 Post-Processing of Pressures


2.5 Grid Independence Test
3 Numerical Results and Discussion
3.1 Ellipsoidal Wall Structures


3.2 Cuboidal Wall Structures


3.3 Conical Wall Structures


4 Conclusions
