Transcriptome and phytochemical analyses reveal the roles of characteristic metabolites in the taste formation of white tea during the withering process
2022-02-15ZHOUChengzheZHUChenLIXiaozhenCHENLanXIESiyiCHENGuangwuZHANGHuanLAIZhongxiongLINYulingGUOYuqiong
ZHOU Cheng-zhe,ZHU Chen,LI Xiao-zhen,CHEN Lan,XIE Si-yi,CHEN Guang-wu,ZHANG HuanLAI Zhong-xiongLIN Yu-lingGUO Yu-qiong
1 College of Horticulture,Fujian Agriculture and Forestry University,Fuzhou 350002,P.R.China
2 Institute of Horticultural Biotechnology,Fujian Agriculture and Forestry University,Fuzhou 350002,P.R.China
3 Key Laboratory of Tea Science of Fujian Province/Tea Industry Research Institute,Fujian Agriculture and Forestry University,Fuzhou 350002,P.R.China
Abstract In the postharvest processing of tea leaves,withering is the first indispensable manufacturing process which produces the mellow,umami and sweet taste of white tea. In this study,we aimed to determine the dynamic changes of the main metabolites and clarify the key differentially expressed genes (DEGs) involved in forming the characteristic taste of white tea during withering. Phytochemical analyses revealed that the contents of total catechins and starch decreased continuously,whereas the contents of theaflavin,γ-aminobutyric acid (GABA),maltose,and soluble sugars increased significantly during withering (from 0–48 h). Meanwhile,the elevation of α-amylase (AMY),β-amylase (BAM),total amylase,and glutamate decarboxylase (GAD) activities may be correlated with the accumulation of GABA and maltose. By transcriptome sequencing,we detected 9 707,15 921,17 353,and 17 538 DEGs at 12,24,36,and 48 h of the withering process,respectively,compared with 0 h sample (fresh leaves). The transcript levels of most of the DEGs involved in catechin biosynthesis were significantly inhibited,whereas those involved in catechin oxidation were significantly up-regulated,which could be correlated to a decrease in catechin content and an increase in theaflavin content. The DEGs involved in GABA biosynthesis were considerably up-regulated,and the down-regulation of SPMS could reduce the competition for converting spermidine to GABA. The up-regulation of the AMY and BAM genes could trigger starch degradation,resulting in the increase of soluble sugar content. These results provide new insights into the importance of the withering process to the characteristic taste of white tea.
Keywords:white tea,withering,transcriptome analysis,phytochemical analysis
1.Introduction
Tea is made from the leaves of the tea plant (Camellia sinensis) which can be divided into six categories based on different manufacturing procedures (Chen 1979).It is well known that withering is the first essential processing step for contributing to the characteristic flavors of white tea,black tea,and oolong tea. White tea,originating and mainly produced in Fujian Province,has the simplest manufacturing processes which goes only through prolonged withering and drying,and the withering process plays a dominant role in the formation of the characteristic taste of white tea(Liuet al.2003). Compared with oolong tea and black tea,the withering degree of white tea is more sufficient (Hilal and Engelhardt 2007). The prolonged withering (approximately 48 h) means that postharvest leaves are first spread and ventilated to dehydrate the leaves,thereby improving the permeability of the cell membrane and enzymatic activity,promoting the slow hydrolysis and oxidation of the leaf contents,and providing an important basis for the formation of specific characteristics of mellow,umami,and sweet taste of white tea (Hilal and Engelhardt 2007). Taste is the most important factor influencing the sensory quality of white tea,and its peculiarities depend on a number of different metabolites,such as catechins and their oxides,soluble sugars,and free amino acids,etc. Generally,catechins are the most characteristic components of tea that offer up the bitter taste and astringent mouthfeel.By the catalytic oxidation of endogenous polyphenol oxidase (PPO) and peroxidase (POD),catechins can be further oxidized to high-molecular-weight polyphenol pigments,such as theaflavins,thearubigins,and theabrownins (Yanget al.2007;Tenoreet al.2015),of which,theaflavin is the most well studied and has been proven to elevate the umami ‘mouthfeel’ and brightness of the color of tea infusions (Verloopet al.2016). Amino acids,including proteinaceous and nonproteinaceous amino acids,are not only the basic units of protein but also important flavor substances,such as γ-aminobutyric acid (GABA),which is a key tasterelated non-proteinaceous amino acid of white tea (Yanget al.2018). Soluble sugars are thought to contribute the sweet taste of tea (Yueet al.2019). Hitherto,many published studies have given extensive attention to surveying the changes of flavor-related metabolites with the duration of withering. By and large,regardless of the contents or kinds of volatile aromas both increased significantly,but showed different changes during the withering process (Chenet al.2019;Wanget al.2019).At the same time,the major taste-related metabolites also change dramatically (Daiet al.2017;Xuet al.2020).
During withering,the leaf cells are alive with active gene expression (Wanget al.2019;Xuet al.2020),and thus,the transcriptional changes would greatly affect the formation of characteristic tea flavors. With the development of high-throughput sequencing technologies,transcriptome sequencing has become a fast and cost-effective approach to generate genomescale sequence resources (Xiaet al.2020b). In particular,after the release of the tea plant genomes(Xiaet al.2017,2020a;Weiet al.2018;Chen J Det al.2020;Wanget al.2020;Zhang Q Jet al.2020),the accuracy of transcriptome sequencing analysis has been greatly improved. By using transcriptome technology,the regulatory effect of differentially expressed genes(DEGs) on the formation of flavor-related metabolites during withering (withered for 24 h) has also been studied to a certain degree. For instance,Wanget al.(2019) found that the decrease of catechin content might have resulted from the significantly inhibited expression of key genes which encode enzymes involved in the biosynthesis of catechins,and the metabolic pathways of fatty acid derivatives and terpenoids were also studied;and Xuet al.(2020) investigated the gene transcription effect on the changes of the theanine and caffeine contents. These findings can help us to explore the effect of the withering process on the formation of the characteristic flavors of teas to some extent,but for white tea,a withering time lasting 24 h is insufficient. In addition,during white tea withering,the formation of and dynamic changes in many important flavor substances which provide the mellow,umami,and sweet taste remain unclear. For example,whether gene expression effects the oxidation of catechins into theaflavin has not yet been explored;as an important contributor to the sweet taste of tea infusions,the reason for the change of soluble sugars content has not been studied;and GABA is regarded as one of the key taste compounds of white tea,but the molecular mechanism of dynamic changes in GABA content during the withering process has not previous been studied. Thus,there are still many questions about the formation of the characteristic flavors during white tea withering that are worth studying.
In investigating the effects of withering on the formation of white tea flavor,we determined the changes in the contents of characteristic taste compounds (eight primary catachins,theaflavin,GABA,soluble sugars,maltose,and starch),and enzymatic activities of GAD,α-amylase(AMY),β-amylase (BAM),and total amylase during the withering process (withered for 0,12,24,36,and 48 h). At the same time,we pursued a comprehensive identification of DEGs during witheringviaRNA-seq technology. The expression patterns of a portion of the DEGs were further validated by quantitative real-time polymerase chain reaction (qRT-PCR) analysis. These analyses not only revealed the importance of withering to the mellow,umami,and sweet taste of white tea,but also provide a series of valuable gene resources for the formation of white tea flavor.
2.Materials and methods
2.1.Chemicals
The standard substances of epigallocatechin gallate(EGCG),epicatechin gallate (ECG),epigallocatechin(EGC),gallocatechin gallate (GCG),gallocatechin (GC),catechin gallate (CG),epicatechin (EC),catechin (C),and theaflavin were purchased from Yuanye Biology Co.,Ltd.(Shanghai,China).
2.2.Plant materials,withering treatment and sensory evaluation
This study employed the nationally improved tea cultivar ‘Fuyun6’,which was planted in a tea plantation at Fujian Agriculture and Forestry University,Fuzhou,China (26°05´N,119°18´E),as plant materials. In sunny conditions,the young shoots (composed of one bud and two leaves) from more than eight randomly selected‘Fuyun6’ plants were uniformly picked,then part of the fresh postharvest leaves was frozen in liquid nitrogen and stored at −80°C immediately as a“0 h”sample (CK).For withering treatment,residual samples (approximately 2-kg tea leaves) were layered evenly (to a thickness of 1 cm) on four independent bamboo sieves in an airconditioned room and maintained at a temperature of(25±2)°C and relative humidity of (60±3)%. Tea leaves at various withering durations (12,24,36,and 48 h)were collected by a five-point sampling method. Then,samples were frozen immediately in liquid nitrogen and stored at −80°C. Each sampling was completed with three independent biological replicates,and a total of 15 samples were acquired (0,12,24,36 and 48 h in triplicate). A portion of the tea leaves was vacuum freeze-dried for subsequent determination of metabolite contents. The phenotypes of the 0,12,24,36,and 48 h withering leaves were recorded. For the initial analysis of the taste,the withered leaves at 48 h were sequentially dried at 90°C for 10 min and at 80°C for 20 min(at a 1-h interval) to obtain finished tea. To further analyze the flavor changes of white tea during withering,the fresh leaves and withered leaves (12,24,36,and 48 h) were freeze-dried (denoted as D0,D12,D24,D36,and D48,respectively). Then,the taste of the finished tea and freeze-dried samples were evaluated by a panel composed of five tea experts according the Chinese national standard procedure for evaluating tea leaves(GB/T 23776–2018 2018).
2.3.Determination of moisture content and metabolites of withered leaves
The above-mentioned samples were used to measure the moisture content and related metabolites. The moisture content of each sample was determined by a rapid halogen moisture meter (VicoMeter,Taizhou,China). The methods for the extraction and quantification of eight primary catechins (C,EC,EGC,GC,CG,ECG,EGCG,and GCG) and theaflavin were carried out according to previous studies (Taiet al.2015)with some modifications. Specifically,the catechins were analyzed with the Rigol L-3000 High Performance Liquid Chromatography (HPLC) equipped with a 2489 UV/Visible detector (Rigol,Beijing,China). The detection wavelength was set to 278 nm,and the column temperature was maintained at 30°C.
The GABA content was measured by the GABA Assay Kit (Grace Biotechnology Co.,Ltd.,Suzhou,China) by following the manufacturer’s instructions. The content was calculated according to the following formula:

where ΔA=Absorbance (sample)−Absorbance (CK),W is the sample weight (g),and D is the dilution ratio.
The starch content was measured by the Starch Assay Kit (Grace Biotechnology Co.,Ltd.) according to the manufacturer’s instructions. The content was calculated according to the following formula:

The soluble sugar content was measured by the Plant Soluble Sugars Assay Kit (Grace Biotechnology Co.,Ltd.,Suzhou,China) according to the manufacturer’s instructions. The content was calculated according to the following formula:

The maltose content was measured by the Maltose Assay Kit (Grace Biotechnology Co.,Ltd.) according to the manufacturer’s instructions. The content was calculated according to the following formula:
Maltose (mg g–1)=1×ΔA/[A (standard)–A (blank)]/W×D
2.4.Enzymatic activity assay
The total amylase,α-amylase,and β-amylase enzyme activities were determined by the β-amylase Assay Kit (Grace Biotechnology Co.,Ltd.) according to the manufacturer’s instructions. The activities were calculated according to the following formulas:

The glutamate decarboxylase (GAD) activity was determined by the Glutamate decarboxylase Assay kit(Grace Biotechnology Co.Ltd.,Suzhou,China) according to the manufacturer’s instructions,The activity was calculated according to the following formula:

2.5.RNA extraction and transcriptome sequencing
Total RNA from the above-mentioned tea samples(three biological replicates) was extracted by using the RNAprep Pure Plant Plus Kit (Tiangen,Beijing,China). The concentration,RNA integrity number (RIN),28S/18S and fragment size of total RNA were detectedviaa Bioanalyzer 2100 (Agilent,Santa Clara,USA),while the purity of total RNA was tested by the ultraviolet spectrophotometer NanoDrop. All the eligible samples were selected for sequencing on the BGISEQ-500 platform at Beijing Genome Institute (BGI,Shenzhen,China) according to a previous report (Yaoet al.2018).Briefly,the mRNA possessing polyA was fragmented and reverse-transcribed into double-strand cDNA(dscDNA) for PCR amplification. The PCR products were denatured to the single strand,then cyclized by splint oligo and DNA ligase to format them as the final library and begin the sequencing. Afterwards,for quality control,the adaptor sequences,over 5%“N-containing”reads,and low-quality reads were removed from the raw reads. Then,the HISAT2 Program (Kimet al.2015) was used for mapping the clean reads to the genome of tea cultivar ‘Shuchazao’ (Weiet al.2018). Bowtie2 Software was used for mapping the clean reads to the already assembled sequences,then RSEM Software was used to calculate Fragments Per Kilobase Per Million Reads Mapped (FPKM) values for quantifying gene expression(Li and Dewey 2011;Langmead and Salzberg 2012). In addition,the Pearson’s correlation coefficient was used to determine the correlation of all the gene expression levels between every two samples. The clean reads data have been deposited in the BIG Data Center under accession number PRJCA004976.
2.6.Functional annotation of differentially expressed genes
DEGs analysis of each compared combination was carried out by the DEGseq method. The significant DEGs satisfy bothP-values≤0.001 (adjusted by FDR value) and|log2-transformed (fold change)|≥1 (Wanget al.2010).Referring to the annotated results of Gene Ontology (GO)and Kyoto Encyclopedia of Genes and Genomes (KEGG)of the ‘Shuchazao’ genome,the DEGs were functionally classified. The DEGs were subjected to GO and KEGG enrichment analyses,with the significant enrichment satisfying the adjustedP-value≤0.01.
2.7.Quantitative real-time PCR analysis
The detection method of qRT-PCR described in a published report (Zhuet al.2019) with minor modifications was used to verify the reliability of the DEGs. The RNA samples were reverse-transcribed to cDNA by the Hifair II 1st Strand cDNA Synthesis SuperMix for qPCR(Yeasen,Shanghai,China). The qRT-PCR reactions of protein-coding genes were performed on LightCycler 480(Roche Applied Sciences,Basel,Switzerland) with AceQ Universal SYBR qPCR Master Mix (Vazyme,Nanjing,China). The tea plant SAND family protein (CsSAND)gene was used as an internal reference for the proteincoding genes. The sequences of specific primers are listed in Appendix A. The relative expression levels were calculated using the 2−ΔΔCtalgorithm (Livak and Schmittgen 2001).
2.8.Statistical analyses
Each type of experiment was performed in triplicate,and all data are shown as mean±standard deviation(SD). The group differences were testedviaa“one-way ANOVA followed by Tukey’sposthoctest”using SPSS 25 Software. The asterisks and double asterisks represent values which are considered statistically different atP<0.05 (significant) andP<0.01 (highly significant),respectively.
3.Results
3.1.The dynamic changes in the morphology of withering leaves and sensory evaluation
The phenotype of the withering leaves was recorded at 0,12,24,36,and 48 h. Fig.1 shows that the phenotype of the leaves continues to change with the duration of withering. In the beginning (0 h),the leaves are glossy,light green,and straight. However,withered for 12 h,the leaves showing slight curling and deformation,and the leaves color turned to slight dull green;withered for 24 h,the leaves color showed a loss of luster,the leaves shape continued to curl and wilt;withered for 36 h,the luster continued to fade,the leaves color became even darker;withered for 48 h,the leaves were tarnished completely,leaves color turned to grayish green,and leaves shape was severely curled. At the same time,the water content was reduced from 71.09 to 27.57% over 48 h of withering as well(Fig.1;Appendix B).
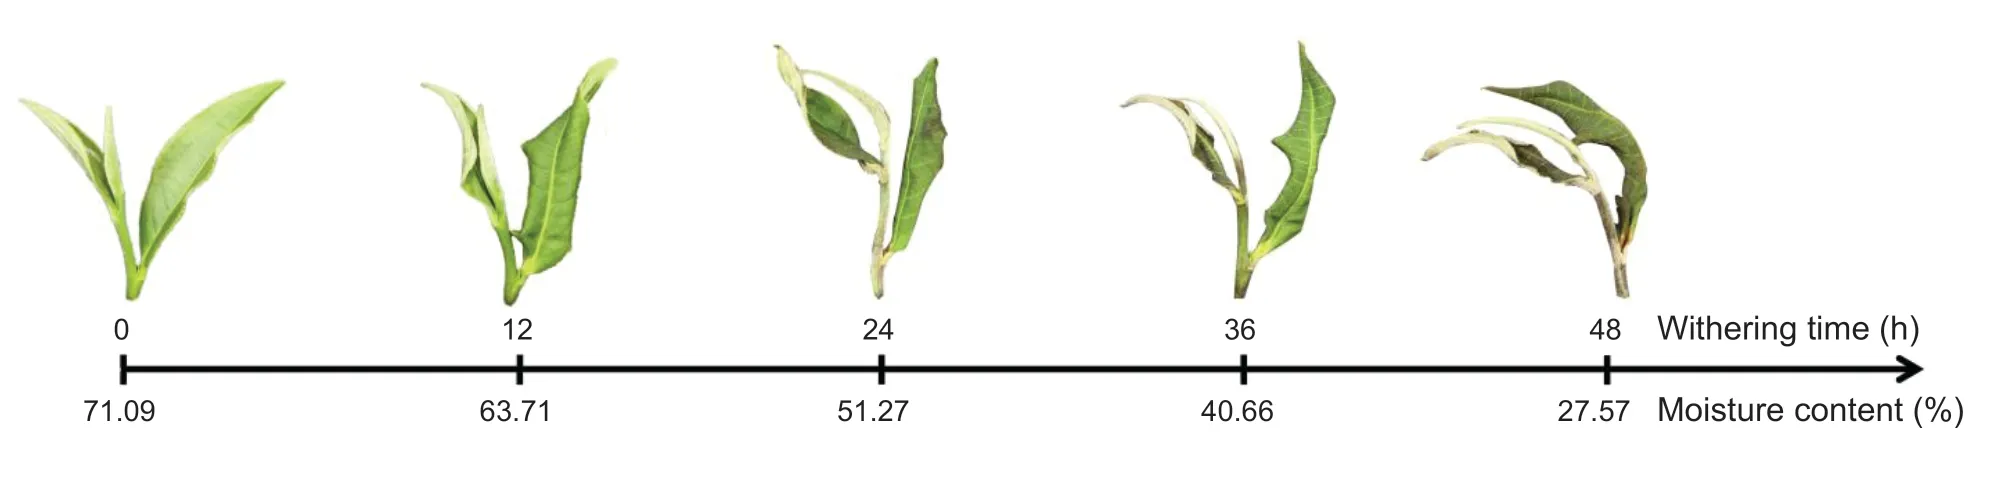
Fig.1 Phenotype and moisture content of ‘Fuyun6’ tea leaves at 0,12,24,36,and 48 h during the withering process.
The sensory evaluation revealed that the six samples differed regarding taste (Appendix C). The taste of finished tea is mellow,umami,and sweet,which meets the characteristics of white tea. The D0 sample was heavily bitter and astringent. With the duration of withering,the taste of the withering leaves gradually changed to mellow,umami,and sweet,suggesting that the characteristic taste of white tea was formed during the withering process.
3.2.The moisture content and phytochemistry components of withering leaves
To explore the components responsible for the characteristic flavor of white tea,we determined the changes in catechin,theaflavin,GABA,and soluble sugar contents during withering (Fig.2-A). With the withering time,the content of total catechins decreased dramatically in the picked tea leaves from 251.27 mg g–1(0 h) to 135.07 mg g–1(48 h). An analysis of the individual catechins identified EGCG as the most abundant catechin in leaf samples. The EGCG content at 0 h was 79.46 mg g–1and it significantly decreased to 54.56 mg g–1at 48 h of withering. Similarly,the contents of EGC,GCG,GC,ECG,EC,and CG decreased continuously with withering time,while the levels of GCG,ECG,EC,and CG showed irregular changes over time. The contents of GCG,ECG,and CG increased during 12 to 24 h of withering,but showed downward trends during the period from 0 to 48 h.The content of EC decreased,increased,and then increased during withering,and its content showed a downward trend overall. However,the catechin content significantly decreased from 0 to 24 h,then increased after 24 h and showed no obvious difference in its content between 0 and 48 h. In contrast,the theaflavin content significantly increased from 0.57 mg g–1(0 h) to 0.94 mg g–1(48 h),implying that during withering the catechins were converted to theaflavin. The GABA content continuous increased from 1.29 mg g–1(0 h) to 3.58 mg g–1(48 h). The soluble sugar content increased from 0 h(12.22 mg g–1) to 36 h (18.80 mg g–1) and decreased thereafter,but it remained significantly higher than the level at 0 h overall.
3.3.Effect of the withering process on glutamate decarboxylase,α-amylase,β-amylase,and total amylase activities
The examination results (Fig.2-B) reveal that GAD activity increased continuously during withering and reached a peak at 48 h;AMY activity increased significantly from 0 to 24 h of withering,but decreased from 24 to 36 h and then showed a small rise at 48 h;BAM activity sharply increased from 0 to 24 h of withering and decreased after 24 h,but still remained higher than the activity at 0 h overall;and the changes in total amylase activity during withering are similar to BAM’s.

Fig.2 The comparison of important compounds and enzymatic activities during the white tea withering process. A,the changes in contents of epigallocatechin gallate (EGCG),epigallocatechin (EGC),gallocatechin gallate (GCG),gallocatechin (GC),epicatechin gallate (ECG),epicatechin (EC),catechin (C),catechin gallate (CG),total catechins (the sum of the eight primary catechin),theaflavin,γ-aminobutyric acid (GABA),and soluble sugars during withering. B,the changes in the enzyme activities of glutamate decarboxylase (GAD),α-amylase (AMY),β-amylase (BAM),and total amylase during withering. Error bars indicate SD (n=3).Samples with asterisks indicate a significant difference at 12,24,36,and 48 h compared with 0 h according to one-way ANOVA.*,P<0.05;**,P<0.01.
3.4.Overview of the transcriptome data
To explore gene expression at different time-points during the withering process,the transcriptome sequencing was carried out. Overall,the Q30 values of all samples were higher than 91.88% (Appendix D). The average coverage of each transcriptome data set relative to the tea cultivar ‘Shuchazao’genome is 89.62% (88.2–90.80%),the uniform mapping rate for each sample indicates that the data are comparable(Appendix E). To reflect the correlations of gene expression,the Pearson’s correlation coefficients of all gene expression levels between every two samples were calculated. As shown in Fig.3-A,all the comparisons in the three biological replicates present high correlation coefficients (>0.90),suggesting that the sequencing in triplicate have good repeatability. A total of 33 718 genes were detected,and all five withering stages shared 31 234 common genes,and also had 83,54,42,63,and 45 specifically expressed genes,respectively (Fig.3-B). Further analyses of gene expression levels indicated that the proportion of low expression genes(FPKM≤1) was gradually increased from 26% (0 h) to 38%(48 h);whereas the change in the number of high expression genes (FPKM≥10) was the opposite (Fig.3-C). Referring to previous criteria (Yuet al.2018),the DEGs with FPKM value≥10 in at least one group were selected for further analysis.

Fig.3 The information about differentially expressed genes (DEGs) in the various samples. A,the heatmap represents Pearson correlation coefficients for all gene expression comparisons between every two samples. B,the Venn diagram represents common and specific DEGs numbers from the different combinations displayed in the overlapping and non-overlapping regions,respectively.C,the histogram indicates the percentages of genes of different FPKM values in the five samples.
3.5.Comparative analysis of DEGs in different combinations based on GO and KEGG annotations
To investigate the DEGs in the duration of withering process,we analyzed the following comparisons:0 hvs.12 h,0 hvs.24 h,0 hvs.36 h,0 hvs.48 h,12 hvs.24 h,12 hvs.36 h,12 hvs.48 h,24 hvs.36 h,24 hvs.48 h,and 36 hvs.48 h,and acquired a total of 9 707,15 921,17 353,17 538,7 686,11 286,10 674,2 351,5 359,and 3 943 DEGs,respectively (Appendix F). On the whole,the number of down-regulated genes is greater than that of up-regulated genes,except for in the 36 hvs.48 h comparison,implying that RNA degradation occurs during the withering period (Chen Q Cet al.2020). To get more information about the DEGs,we functionally annotated the DEGs according to the GO and KEGG databases. We mainly focused on the DEGs in the 0 hvs.12 h,0 hvs.24 h,0 hvs.36 h,and 0 hvs.48 h comparison combinations.
A total of 5 584,9 250,10 075,and 10 056 DEGs in the four compared combinations,respectively,were grouped into the three major GO categories (biological process,cellular component,and molecular function). Interestingly,the DEGs for the four comparisons are all grouped into the same classes of the top three subgroups of the three major GO categories (Appendix G). In the biological process category,the top three subgroups of DEGs annotations are all cellular process,metabolic process and biological regulation. In the cellular component category,most of the DEGs in the four comparisons are annotated with the cell,cell part,and membrane subgroups. Regarding the DEGs of the four comparisons in the molecular function category,most are placed into the binding,catalytic activity,and transporter activity subgroups. These results suggested that withering is a continuous biological process.
To further study the relationships between the enriched DEGs and the biosynthesis of metabolites,we then analyzed the top 20 significantly enriched KEGG pathways (Appendices H and I). In the 0 hvs.48 h comparison,2 158 DEGs were enriched in the top 20 pathways,and they belong to the genetic information processing-related pathway (homologous recombination;DNA replication;mismatch repair;nucleotide excision repair;base excision repair;RNA transport;nonhomologous;and ribosome biogenesis in eukaryotes) and the primary metabolism-related pathway (photosynthesisantenna proteins;arginine biosynthesis;porphyrin and chlorophyll metabolism;starch and sucrose metabolism;glycosaminoglycan degradation;glycosphingolipid biosynthesis-ganglio series;other glycan degradation;pyrimidine metabolism;photosynthesis;pantothenate and CoA biosynthesis;C5-branched dibasic acid metabolism end-joining;and glycosphingolipid biosynthesis-globo and isoglobo series). These pathways indicated that the prolonged withering process greatly affects the basic vital activities of tea leaves. Among which,starch and sucrose metabolism,glycosphingolipid biosynthesis-ganglio series,porphyrin and chlorophyll metabolism,photosynthesis-antenna proteins,and homologous recombination were found in the top 20 enriched pathways of all four compared combinations,suggesting that prolonged withering has a persistent effect on these aspects.
3.6.Analysis of the DEGs involved in catechin metabolism during the withering process
In our research,the total content of catechins declined dramatically with the duration of withering,while the theaflavin content gradually increased. To characterize the key DEGs involved in the biosynthesis and oxidation of catechins,we examined 48 DEGs distributed in 16 gene families,includingPAL(encoding phenylalanine ammonialyase),C4H(encoding cinnamate 4-hydroxylase),4CL(encoding 4-coumarate CoA ligase),CHS(encoding chalcone synthase),CHI(encoding chalcone isomerase),F3´H(encoding flavonoid 3´-hydroxylase),F3´5´H(encoding flavonoid 3´,5´-hydroxylase),F3H(encoding flavanone 3-hydroxylase),DFR(encoding dihydroflavonol 4-reductase),ANS(encoding anthocyanidin synthase),LAR(encoding leucoanthocyanidin reductase),ANR(encoding anthocyanidin reductase),SCPL(encoding serine carboxypeptidase-like),PPO(encoding polyphenol oxidase),POD(encoding peroxidase),andGPX(encoding glutathione peroxidase). A potential catechin metabolic pathway was constructed based on these identified DEGs(Fig.4;Appendix J).

Fig.4 The differentially expressed genes (DEGs) involved in catechin metabolism during the withering process. A,a simplified model of the catechin metabolism pathway in tea plant and the figures in brackets represent the up-regulated (red) or downregulated (green) genes compared with the 0 h sample. B,the expression profiles of DEGs involved in catechin metabolism during withering and the figures in brackets represent the number of DEGs. The expression values of DEGs were normalized by log2transformation (FPKM+1).
The expression levels of these DEGs were calculated based on FPKM values. ThreeANRand threeLARDEGs directly associated with the reduction of anthocyanins and leucocyanidins to simple catechins were significantly repressed,and the expression of six out of eightSCPLDEGs,which play critical roles in the galloylation of simple catechins to galloylated catechins (Ahmadet al.2020),was significantly down-regulated. These results implied that the reduction of anthocyanins and leucocyanidins to simple catechins and the galloylation of simple catechins to galloylated catechins were both blocked. Furthermore,most of the upstream DEGs involved in catechin biosynthesis were also inhibited significantly compared to fresh leaves (0 h),such as fourPALandCHS,four out of sixCHI,and one each ofC4H,F3´H,F3´5´H,F3H,andANS. Meanwhile,we found that twoPPO(TEA005488.1 and TEA026892.1),twoGPX(TEA024679.1 and TEA011810.1),and threePOD(TEA026798.1,TEA019411.1,and TEA027576.1) genes showed significant increases in transcription levels with the withering time. These genes have been verified to effect the transformation of catechins into theaflavin (Yuet al.2019;Zhang G Yet al.2020),implying they play crucial roles in the oxidation of catechins to theaflavin during white tea withering as well.
3.7.Analysis of the DEGs involved in GABA biosynthesis during the withering process
Next,we identified DEGs involved in the biosynthesis of GABA in the transcriptome data. Generally speaking,GABA is synthesized in both the GABA shunt and polyamine degradation pathways (Fig.5-A).In the GABA shunt,two DEGs corresponded toGAD(encoding glutamate decarboxylase). In the polyamine degradation pathways,ODC(encoding ornithine decarboxylase),SPDS(encoding spermidine synthase),andSPMS(encoding spermine synthase)each corresponded to one DEG,respectively;while more than one DEGs corresponded toGAD(encoding glutamate decarboxylase),GDH(encoding glutamate dehydrogenase),PAO(encoding polyamine oxidase),andADC(encoding arginine decarboxylase).
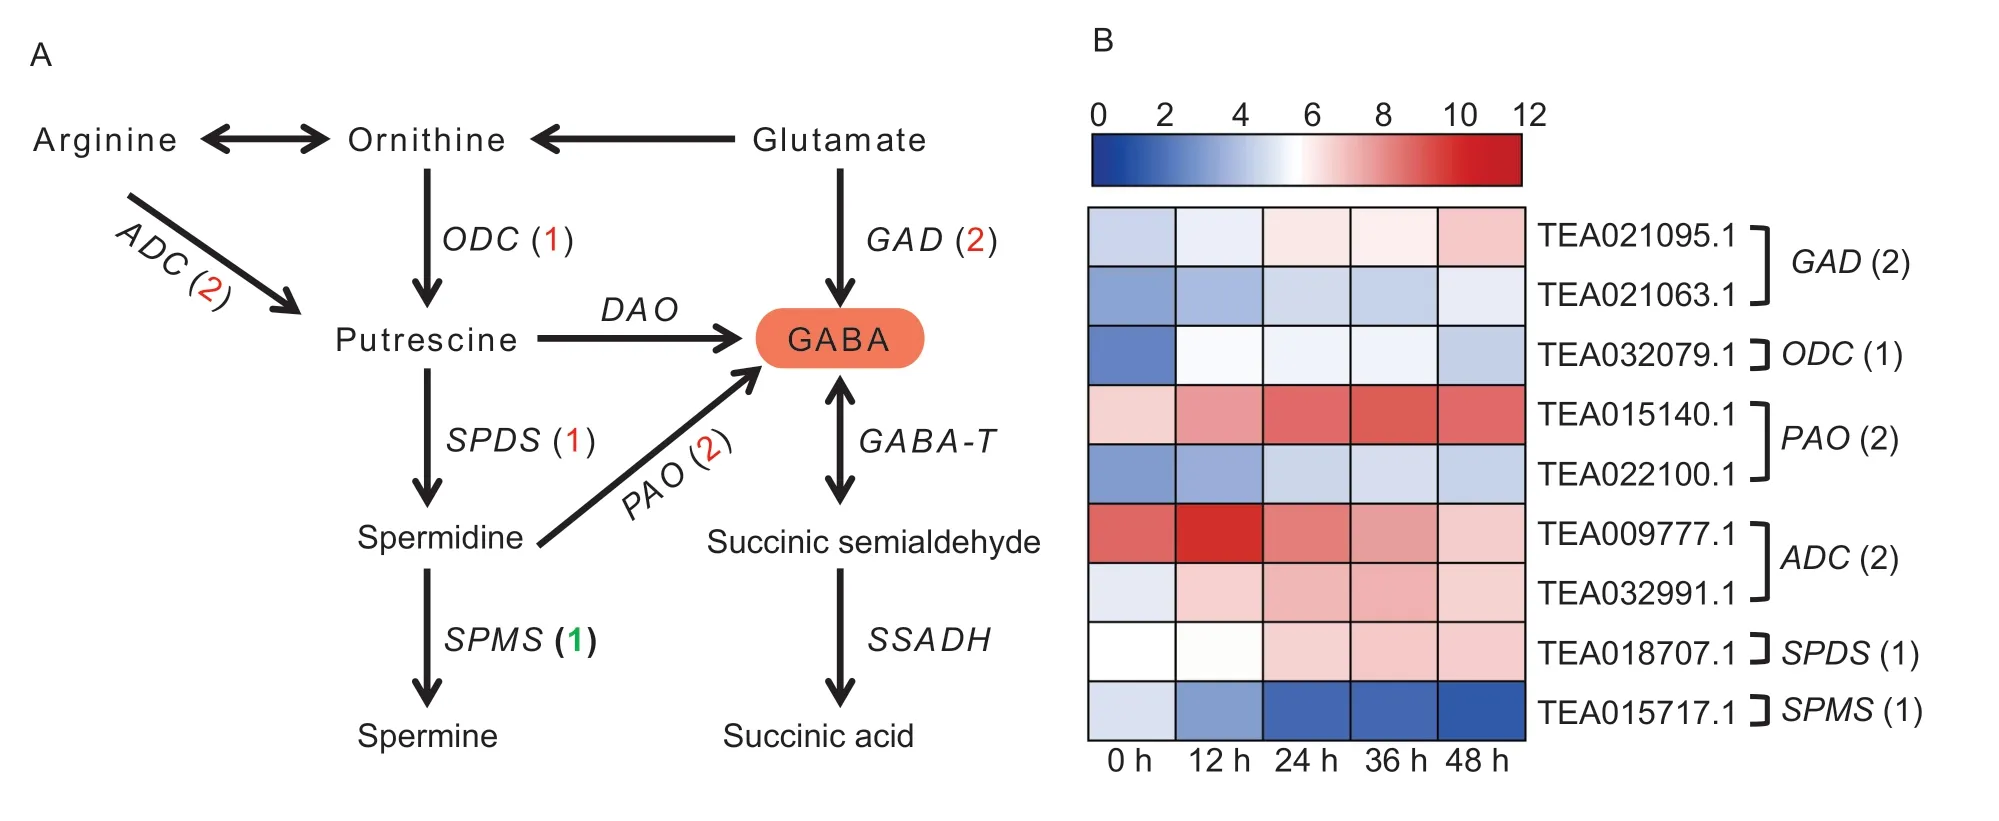
Fig.5 The differentially expressed genes (DEGs) involved in γ-aminobutyric acid (GABA) biosynthesis during the withering process.A,a simplified model of the GABA biosynthesis pathway in tea plant and the figures in brackets represent the up-regulated (red) or down-regulated (green) genes compared with the 0 h sample. B,the expression profiles of DEGs involved in GABA metabolism during withering and the figures in brackets represent the number of DEGs. The expression values of DEGs were normalized by log2transformation (FPKM+1).
Based on the FPKM values calculated from the transcriptome data,the expression patterns of these DEGs during withering were compared (Fig.5-B;Appendix K). Except forSPMS,the other DEGs were up-regulated significantly during the withering process compared with the 0 h sample. Increased transcript levels ofODC,ADC,andSPDSmay be positively correlated with the amounts of precursors for GABA metabolism,and the up-regulation ofGADandPAOmay be directly related to the accumulation of GABA. Meanwhile,the downregulation ofSPMScould reduce the competition for converting spermidine to GABA thereby affecting GABA accumulation.
3.8.Analysis of the DEGs involved in starch degradation and determination of starch and maltose contents during the withering process
On the basis of the KEGG analysis,we found that“starch and sucrose”is one of the top 20 enriched pathway in all four comparisons,therefore,this pathway was further investigated.
During withering,nine DEGs encoding important enzymes associated with the hydrolysis of starch were differentially expressed (Appendix L),including three and six genes that were identified asAMY(encoding α-amylase) andBAM(encoding β-amylase),respectively. Among them,twoAMYs(TEA006966.1 and TEA005158.1) and threeBAMs(TEA008554.1,TEA010380.1,and TEA032577.1) presented a tendency to be significantly up-regulated with withering time(Fig.6-A and B). Therefore,these genes may function as major genes for the decomposition of starch in the withering process. Indeed,an examination of starch and maltose showed that the decreased in starch content was accompanied with increases in the major starch catabolite(maltose) content with withering time,suggesting that starch degradation is an important source for the increase in soluble sugar contents (Fig.6-C).

Fig.6 The differentially expressed genes (DEGs) involved in starch degradation during the withering process. A,a simplified model of starch degradation and the figures in brackets represent the up-regulated (red) or down-regulated (green) genes compared with the 0 h sample. B,the expression profiles of DEGs involved in starch degradation during withering and the figures in brackets represent the number of DEGs. C,the changes of starch and maltose contents during withering. Error bars indicate SD (n=3).Samples with asterisks indicate a significant difference at 12,24,36,and 48 h compared with 0 h according to one-way ANOVA.*,P<0.05;**,P<0.01.
3.9.Verification of the DEGs involved in catechin metabolism,GABA metabolism,and starch degradation
To verify the reliability of the DEGs FPKM values,the transcript trends were determined by qRT-PCR forC4H(TEA034001.1),CHI(TEA013101.1),F3H(TEA023790.1),F3´H(TEA006847.1),F3´5´H(TEA013315.1),CHS(TEA034042.1),ANR(TEA022960.1),LAR(TEA027582.1),PPO(TEA026892.1),andPOD(TEA019411.1) involved in catechins metabolism;forGAD(TEA021095.1),PAO(TEA015140.1),ODC(TEA001153.1),ADC(TEA032991.1),SPDS(TEA018707.1),andSPMS(TEA015717.1) involved in GABA metabolism;and forBAM(TEA032577.1,TEA008554.1 and TEA010380.1) andAMY(TEA005158.1)involved in starch degradation (Fig.7). Generally,the expression trends of the selected genes were basically consistent with the transcriptome results. Besides,the FPKM values and qRT-PCR data showed strong correlations (R>0.60),indicating that the FPKM values from the transcriptome data are reliable.
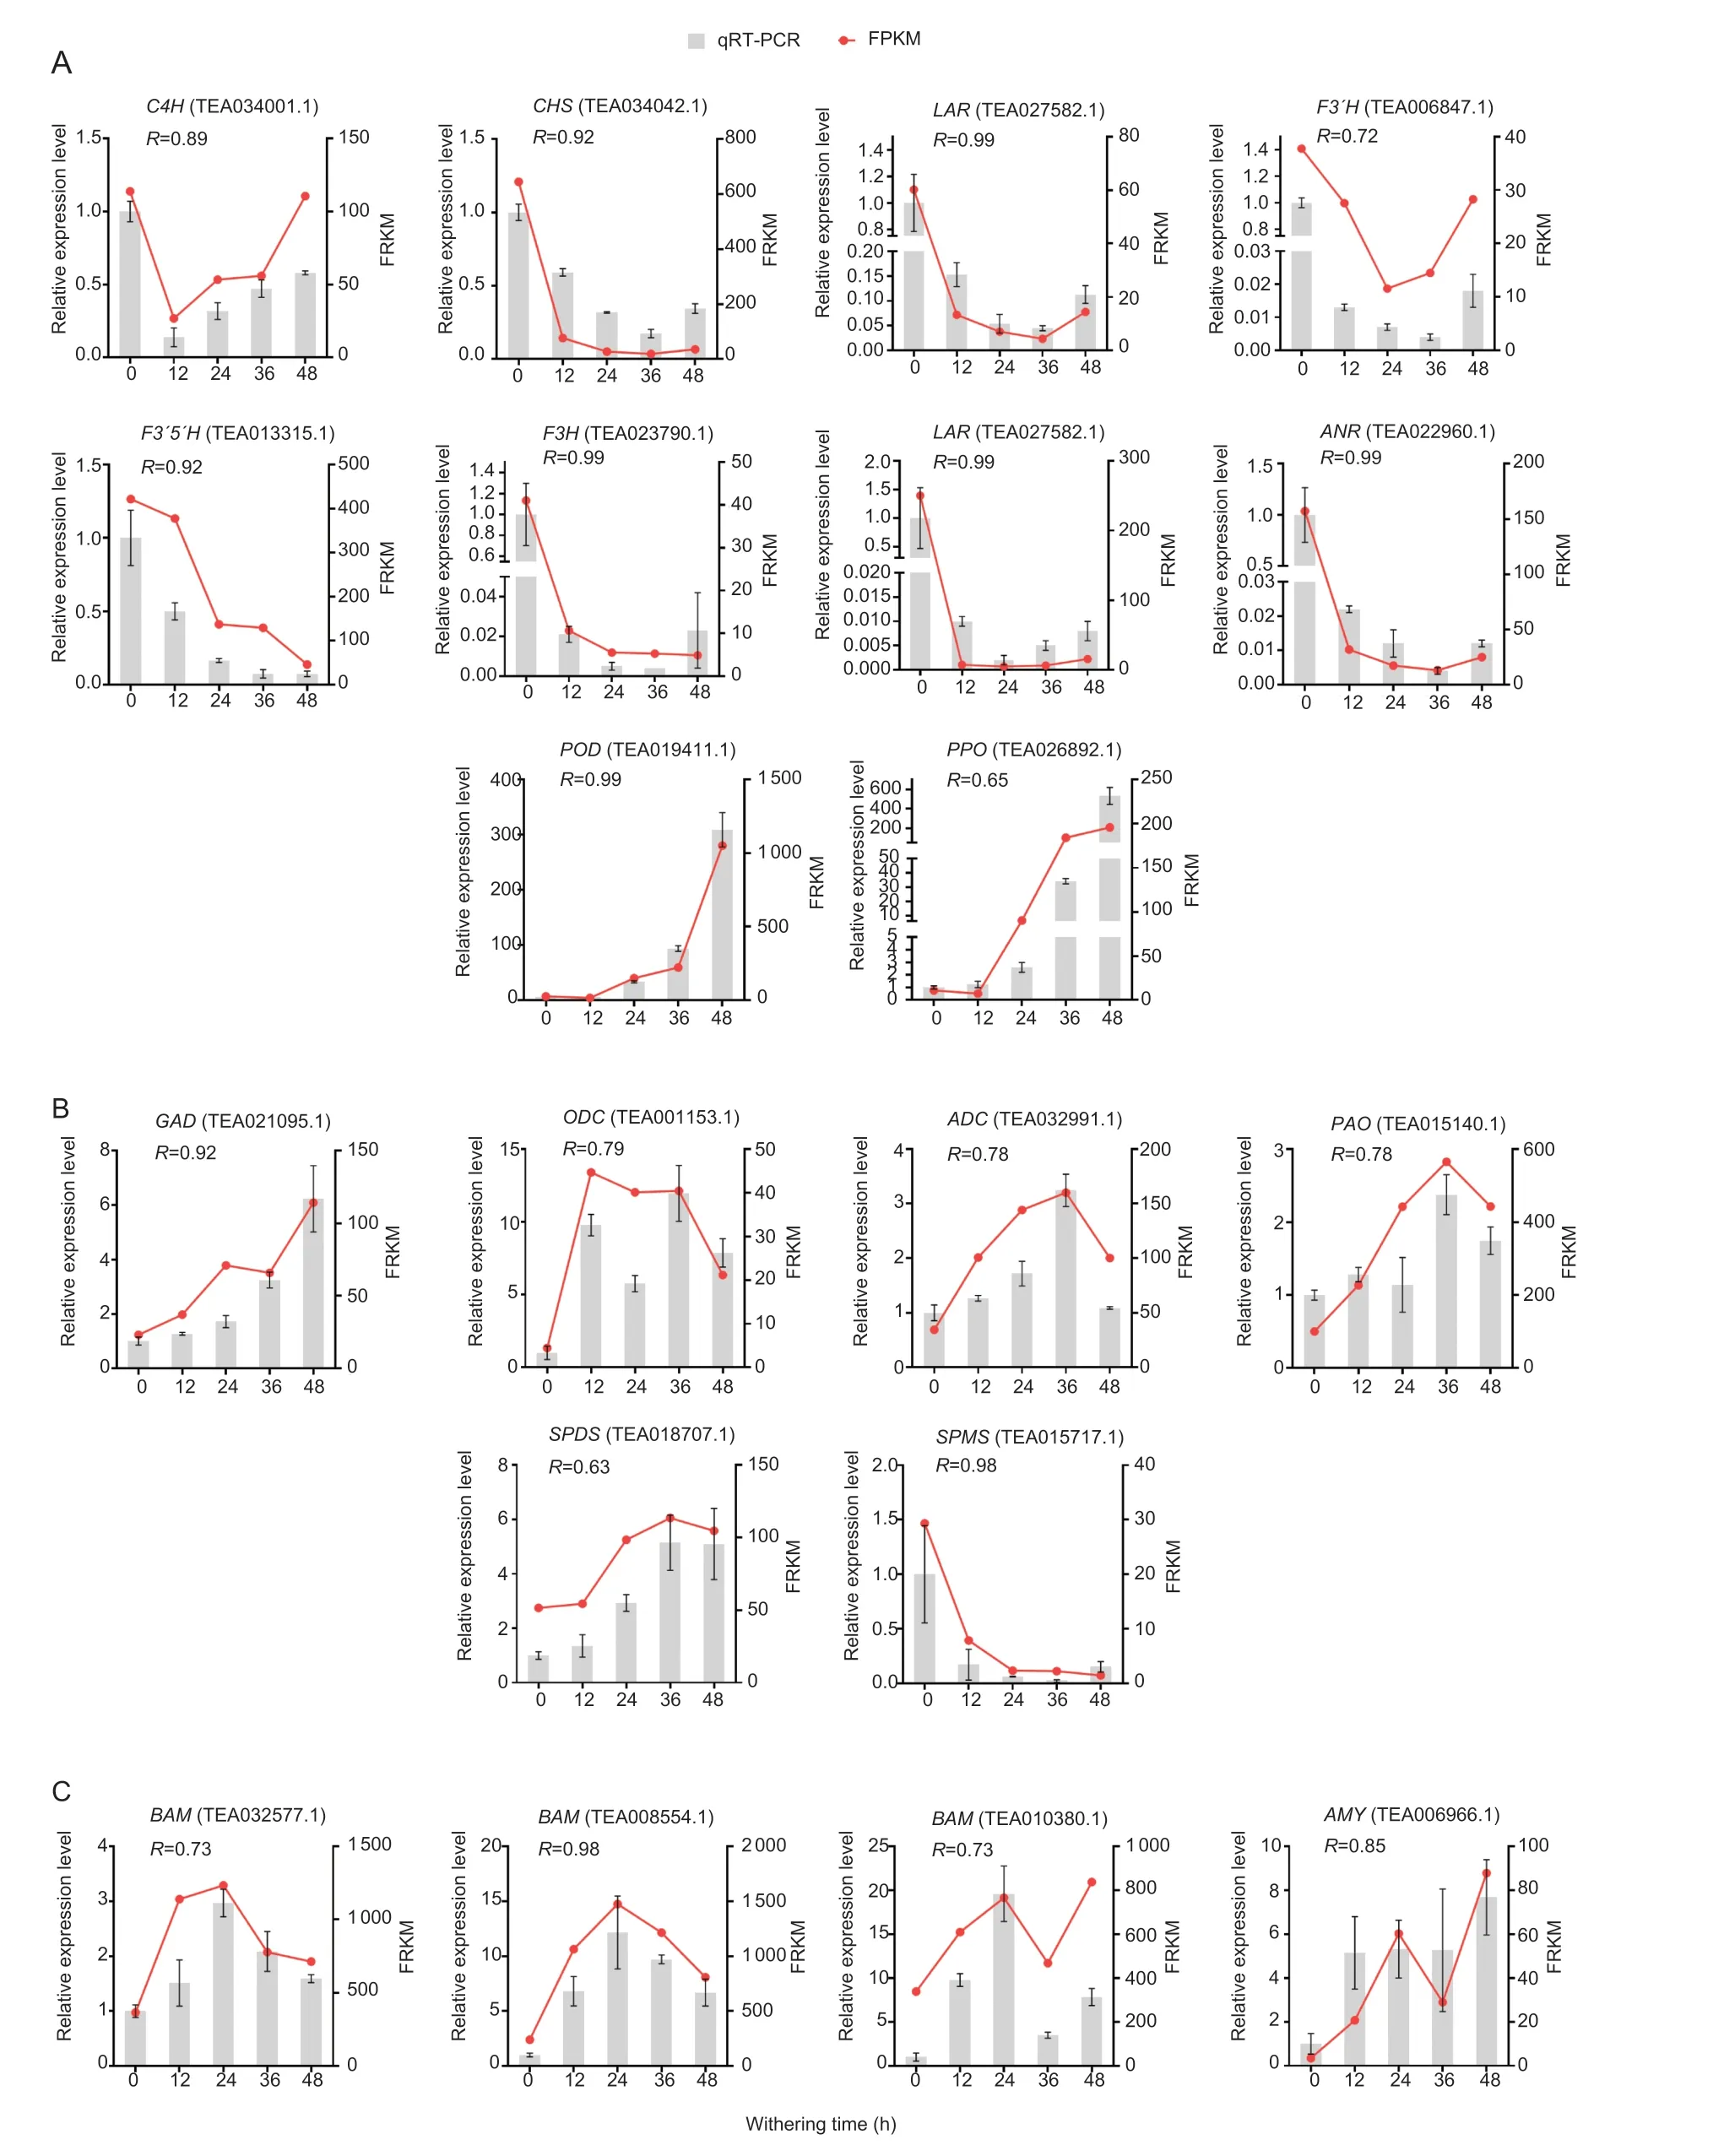
Fig.7 Quantitative real-time PCR validation:20 genes involved in catechin metabolism (A),γ-aminobutyric acid (GABA) biosynthesis(B),and starch degradation (C) were selected for RT-qPCR determination. The CsSAND gene was used as an internal reference.Error bars indicate SD (n=3). Samples with asterisks indicate a significant difference at 12,24,36,and 48 h compared with 0 h according to one-way ANOVA.*,P<0.05;**,P<0.01.
4.Discussion
4.1.The blocking of synthesis together with strengthening the oxidation of catechins during withering improve the palatability of white tea
White tea is loved by an increasing number of consumers for its unique flavor,which can be summed up as a mellow,umami and sweet taste,and this is attributed largely to the prolonged withering process. Because the postharvest tea leaves remain relatively intact with active gene expression,we thus carried out physiochemical analysis combined with transcriptome analysis to investigate the effect of gene expression on the formation of the characteristic flavor of white tea. Catechins are a class of the most important components in tea products,and white tea is no exception. However,for the mellow taste of white tea,the content of catechins is not governed by“the more the better”because of their puckering astringency and rough mouthfeel. Previous research has proven that drought stress would bring down the catechin content (Wanget al.2016),which led us to wonder whether white tea withering (a continuous dehydration process) could affect the content of catechins as well. Therefore,we investigated the changes in the contents of eight primary catechin components (C,EC,GC,EGC,CG,GCG,ECG,and EGCG) during the withering process. In this research,we determined that the content of all the catechin components (except for C)were considerably decreasing during the 48 h of withering(total catechin content decreased from 251.27 to 135.07 mg g–1),and this finding was consistent with previous research (Chen Q Cet al.2020). To further explore the cause of the decline in catechin content,we investigated the expression of genes related to the decrease of catechin contentviatranscriptome analysis. On the one hand,the evidence showed that most of the upstream genes involved in catechin biosynthesis are gradually suppressed,of which,C4H directs metabolic flux into flavonoid biosynthesis to define the size of catechin pool(Muiret al.2001;Bovyet al.2007). Thus,the downregulation ofC4Hexpression may limit the catechins pool to a low level. ANR catalyzes the conversion of anthocyanidins to corresponding 2,3-cis-flavan-3-ols (EC or EGC),while LAR converts flavan-3,4-diols,such as leucocyanidin and leucodelphinidin,into the flavan-3-ol products C or GC (Xie 2003;Punyasiriet al.2004;Wanget al.2018). In our study,ANRandLARgenes were significantly inhibited. These findings indicated that the decrease of catechin content may ascribed to the blocking of synthesis. Similar situation have been also found in previous research (Wanget al.2019). On the other hand,catechins are not the end secondary metabolites in tea,as they can be further oxidized to many important polyphenol substances. It is well known that catechins can be further transformed into theaflavin by the oxydic action of PPO and POD (Tanaka and Kouno 2003).However,whether the oxidation of catechins is facilitated or inhibited during white tea withering remains unclear.We thus further determined the content of theaflavin,and the result showed that it was constantly accumulated with the withering time. Recently,Yuet al.(2019) found that in the shade,the up-regulation ofCsPPO3(corresponding to TEA026892.1) would promote the transformation of catechins into theaflavins,and theCsPPO3recombinant protein indeed exhibited PPO function. Zhang G Yet al.(2020) proved that PODs,including POD,APX,and GPX,also play roles in theaflavin production during black tea processing. Transcriptome analysis revealed the transcript levels ofPPOs,PODsandGPXswere highly induced with the duration of withering,suggesting that the up-regulation of these genes is the main cause promoting the oxidation of catechins into theaflavin during the white tea withering process. To sum up,the prolonged withering process reduces the catechin content by both synthesis inhibition and oxidation strengthening. The reduction in catechin content during withering may improve the palatability of white tea infusion,and in addition,the increased in theaflavin content may give the white tea infusion a brighter color and umami mouthfeel.
4.2.Starch degradation may be an important resource to contribute to the sweet taste of white tea
Soluble sugars are regarded as a class of important components which contribute to the sweet taste of tea(Yueet al.2019). In the present study,we first found that the soluble sugar content increased with the withering time. Previous research showed that dehydration stress caused by withering triggers a series of gene expressions and further affects the formation of the tea characteristic taste (Wanget al.2019;Zhuet al.2020). As one of the macromolecules of sugar,starch is considered as an important molecule in mediating plant responses to water deficit (Thalmann and Santelia 2017). The fact that prolonged withering renders a severe water deficit in tea leaves led us question whether prolonged withering can induce starch hydrolysis. In plants,the regulation of starch degradation mainly depends of the action of amylases. On the basis of structure and function,amylases can be classified into AMY (endohydrolase)or BAM (exohydrolase). AMY catalyzes the hydrolysis of starch to release malto-oligosaccharides,and BAM hydrolyzes the α-1,4-glucosidic linkages of starch to release successive β-maltose units from the non-reducing end (Yueet al.2019). In consideration of their vital roles for starch degradation,we then further measured the activities of BAM,AMY,and total amylase. Undoubtedly,these enzyme activities were all up-regulated during withering,although their activities showed downward trends from 24 to 48 h of withering but were generally higher than those in fresh leaves. Meanwhile,transcriptome analysis revealed that the“starch and sucrose”pathway was presented in the top 20 KEGG enriched pathways in all four comparisons,suggesting that the effect of withering on starch metabolism was sustained. Indeed,we found that twoAMYand threeBAMgenes were remarkably induced with withering time. We then determined that the starch content decreased significantly whereas the content of the major starch catabolite (maltose) increased significantly during withering. These results suggested that starch hydrolysis is an important resource for increasing the abundance of soluble sugars. By and large,the severe loss of water during withering triggers starch degradation by promotingBAMandAMYexpression and the corresponding enzymatic activities thereby increase maltose content,which endows the sweet taste of white tea.
4.3.The increase in GABA content during withering may further improve the taste quality of white tea
So far,26 amino acids have been found in tea,six of which are non-proteinaceous amino acids,including GABA (Yu and Yang 2019). A previous study has proven that GABA is a key taste compound in white tea because of it has a low threshold concentration (Yanget al.2018).The taste of GABA is characterized by astringency,but unlike the puckering and rough mouthfeel induced by catechins,the oral sensation of GABA can be described as a“velvety-like”feel (Yanget al.2018),and as such the GABA content is positively correlated with white tea grade (Chenet al.2019). In the present study,the results indicated that the withering process promoted the accumulation of GABA. Recently,Chen Q Cet al.(2020) observed that the increases in free amino acids during the withering period may due to the degradation of proteins,but GABA is one of the non-proteinaceous amino acids,which implies that the increase in GABA content may be caused by other mechanisms. In higher plants,there are two main pathways involved in the synthesis of GABA,including the GABA shunt and polyamine degradation pathways (Liaoet al.2017). In the GABA shunt,GABA is mainly synthesized by the irreversible decarboxylation of glutamate under the action of GAD,then the GABA is reversibly converted to succinic semialdehyde by GABA-T. In the polyamine degradation pathway,ODC,ADC,SPDS,and DAO are involved in the production of precursor substances. Spermidine can also be catalyzed by SPMS and PAO to spermine and GABA,respectively. In our study,the GAD activity was significantly increased with withering time,implying that converting glutamate to GABA is one of the factors promoting GABA accumulation. Upon further analysis of transcriptome data,we found that twoGADgenes were significantly increased in expression and positively correlated with the accumulation of GABA. Previous research found that the reduction of glutamate content during withering might also prove our point indirectly(Chen Q Cet al.2020). Furthermore,increased transcript levels ofODC,ADC,andSPDSmay also be positively correlated with the amounts of the precursors for GABA metabolism. In addition,GABA and spermine are parallel metabolites,so there may be competition in converting spermidine to GABA and spermine. In our study,the expression ofSPMSwas inhibited significantly,whereasPAOgenes were highly induced,during withering. These may indirectly induce GABA biosynthesis by reducing competition for the same substrate,thereby increasing the abundance of GABA. In short,converting glutamate to GABA and polyamine degradation may jointly promote the accumulation of GABA,thereby further improving the taste quality of white tea.
Integrated transcriptome and phytochemical analyses were used to explore the formation of the mellow,umami,and sweet taste of white tea during the withering process. Our results show that the decrease in catechins and increase in theaflavin content are attributed to the down-regulation of the expression of genes related to catechin synthesis and up-regulation of the expression of genes related to catechin oxidation. The up-regulation of theBAMandAMYgenes are important for the starch degradation during withering,which is one of the important resources for increasing the abundance of soluble sugars. In addition,the DEGs in the GABA shunt and polyamine degradation pathways play crucial roles in the accumulation of GABA during white tea withering. Our study provides insights into the formation of the characteristic taste of white tea,and illuminate the regulatory mechanisms involved in taste formation.
5.Conclusion
The prolonged withering process causes tea leaves to lose large amounts of water and triggers significant changes in the contents of metabolites related to the mellow,umami,and sweet taste and gene transcription.The content of primary catechins decreased markedly,whereas the contents of theaflavin,GABA,and soluble sugars increased significantly during withering. The AMY,BAM,total amylase,and GAD activities increased significantly. Transcriptomics analysis showed that the inhibition and induction of genes involved in catechin biosynthesis and oxidation,respectively,are crucial factors for the changes in catechin and theaflavin contents. Both the up-regulation of genes involved in the GABA shunt and polyamine degradation,and the down-regulation of theSPMSgene,contribute to the accumulation of GABA.The up-regulation of theAMYandBAMgenes leading to starch degradation is crucial for increasing the soluble sugar content (Fig.8). In short,our study confirms that the prolonged withering treatment is conducive to the mellow,umami,and sweet taste of white tea.
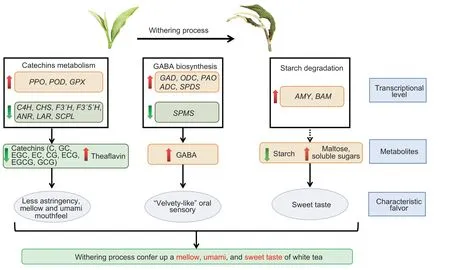
Fig.8 A summary diagram of the key differentially expressed genes (DEGs) and metabolites of catechins,theaflavin,γ-aminobutyric acid (GABA),starch,maltose,and soluble sugar metabolism during white tea withering. Red up arrows indicate DEGs with higher expression levels or metabolites with higher contents during withering;green down arrows indicate genes with lower expression levels or metabolites with lower contents during withering. Solid lines represent direct action;dashed lines represent potential action. PPO,polyphenol oxidase;POD,peroxidase;GPX,glutathione peroxidase;C4H,cinnamate 4-hydroxylase;CHS,chalcone synthase;F3´H,flavonoid 3´-hydroxylase; F3´5´H,flavonoid 3´,5´-hydroxylase;ANR,anthocyanidin reductase;LAR,leucoanthocyanidin reductase;SCPL,serine carboxypeptidase-like;C,catechin;GC,gallocatechin;EGC,epigallocatechin;EC,epicatechincatechin;CG,catechin gallate;ECG,epicatechin gallate;EGCG,epicatechin gallate;GCG,gallocatechin gallate;GAD,glutamate decarboxylase;ODC,ornithine decarboxylase;PAO,polyamine oxidase;ADC,arginine decarboxylase;SPDS,spermidine synthase;SPMS,spermine synthase;AMY,α-amylase;BAM,β-amylase.
Acknowledgements
This study was supported by the China Agriculture Research System of MOF and MARA (CARS-19),the Scientific Research Foundation of Graduate School of Fujian Agriculture and Forestry University,China(102–1122YS010),the Rural Revitalization Tea Industry Technical Service Project of Fujian Agriculture and Forestry University,China (11899170145),the“Double First-class”Scientific and Technological Innovation Capacity and Enhancement Cultivation Plan of Fujian Agriculture and Forestry University,China (KSYLP004),6.18 Tea Industry Technology Branch of Collaborative Innovation Institute,China (K1520001A),the Fujian Agriculture and Forestry University Construction Project for Technological Innovation and Service System of Tea Industry Chain,China (K1520005A01),the Construction of Plateau Discipline of Fujian Province,China (102/71201801101),the Biochemical Analysis and Biological Study of Tea Plant Germplasm Resources of Fujian Agriculture and Forestry University,China(K1518023A),and the Innovation Training Program for College Students of Fujian Agriculture and Forestry University,China (102–111ZC20061). We thank Ms.Huang Xin,from School of Foreign Languages,Fuzhou University,for editing the English text of a draft of this manuscript.
Declaration of competing interest
The authors declare that they have no conflict of interest.
Appendicesassociated with this paper are available on http://www.ChinaAgriSci.com/V2/En/appendix.htm
杂志排行
Journal of Integrative Agriculture的其它文章
- First record of the golden potato nematode Globodera rostochiensis in Yunnan and Sichuan provinces of China
- Current state and suggestions for mechanical harvesting of corn in China
- Protective effect of high-oleic acid peanut oil and extra-virgin olive oil in rats with diet-induced metabolic syndrome by regulatingbranched-chain amino acids metabolism
- The ciliate protozoan Colpoda cucullus can improve maize growth by transporting soil phosphates
- Interactions between phosphorus availability and microbes in a wheat–maize double cropping system:A reduced fertilization scheme
- Dynamics of organic carbon and nitrogen in deep soil profile and crop yields under long-term fertilization in wheat-maize cropping system