Investigation of the shock compression behaviors of Al/PTFE composites with experimental and a 3D mesoscale-model
2022-02-15XingliYngYongHeYunHeChuntingWngJieZhou
Xing-li Yng ,Yong He ,* ,Yun He ,** ,Chun-ting Wng ,Jie Zhou
a Departmentsof Mechanical Engineering,Nanjing University of Science &Technology,Nanjing,Jiangsu,210094,PR China
b Hubei Aerospace Flight Vehicle Institute,Wuhan,430040,PR China
Keywords:Al/PTFE reactive materials 3D mesoscale-model Shock-assisted reaction Shock Hugoniot
ABSTRACT The responses of Al/PTFE reactive materials (RMs) under shock compression were investigated by a single-stage gas gun.A 3D mesoscale-model was established based on micro-computed tomography(micro-CT) slice images and confirmed with experimental results.In the high-pressure stage,the composites reacted partially,whereas there were no deviations between the partially reacted Hugoniot and the inert simulation results.The simulation reveals that the Teflon matrix melting on the high shock pressure.Melts and decomposition of the PTFE accelerated the diffusion of the atoms.Thus,the reactions of the Al/PTFE composites are more like a combustion rather than a detonation.
1.Introduction
Impact-initiated materials or reactive materials (RMs) are materials that can react and release energy under shock loading while remaining inert in ambient conditions.With acceptable mechanical properties and energetic performances,Al/PTFE composites have been widely investigated for their potential use in civil and military applications.
In the past decades,there have been extensive reports on the mechanical and chemical behaviors of RMs,including theoretical analyses,experimental investigations,and numerical simulations.Batsanov et al.[1]first confirmed that the reaction occurred behind a shock front in a mixture of Sn/S components and established a model to obtain the time interval,the heat released,and the reaction extent.Song and Bennett[2,3]developed equations of state for RMs during the reaction,and both of these models accounted for the reactants and products.Zhang[4,5]developed a theoretical model to calculate the Hugoniot data,which includes the heat released from the reactions.In this model,the temperature rise due to the shock compression was calculated first,after which the Arrhenius reaction rate and Avrami-Erofeev kinetic models were used to calculate the extent of the reaction.
Taylor anvil tests,Hopkinson bars,and time-resolved measurements [6-9] have been employed to study the ignition and ratio of reaction experimentally.Aydelotte [10] and Du [11] investigated the impact initiation of explosively compacted Ni+Al,W +Al,and Ta+Al mixtures with rod-on-anvil impact tests and mesoscale simulations.The results showed that the average density,topology,and ductility in both constituents influenced the initiation of the reactions.Willis [12] tested the shock initiation of Al/PTFE mixtures under the impact velocities ranging from 104 to 963 m/s,and it was observed that there was an exponential relationship between the initiation time and the impact stress above an initiation threshold.Zhang [13] and Wang [14] established SHPB(Split Hopkinson Pressure Bar)tests to investigate the compression properties and impact insensitivities of Al/PTFE/W composites.The addition of W (tungsten) increased the reaction activities of those composites.Moreover,the composites became more brittle as the mass ratio of W increased.Zhou [15] used a quasi-sealed test chamber to study the effect of the mass ratio of tungsten and composite porosity on the reaction efficiencies of Al/PTFE composites.It was found that the combined effect of the tungsten content and the initial porosity of the composites determined the reaction efficiency.A theoretical model based on the Wu-Jing equation of state (EOS) and n-dimensional nuclear growth model was established,and the calculation accuracy was verified experimentally.
A growing body of research suggests that the mesoscaletopology and particle size have notable effects on the dynamic mechanical and reaction properties [16,17].Due to the ultra-short duration of the shock event,there is limited information that can be gathered experimentally.Therefore,computational approaches have been employed in the study of RMs [18].Herbold [19,20]investigated the particle size effect on the strengths and failure behaviors of the Al/PTFE/W composites using experiments and numerical methods.The strength and fracture model was governed by agglomerated metal particles.Qiao [21,22] established a mesoscale numerical model of Al/PTFE/W composites by assuming that the metal particles were spheres.With this model,Qiao studied the Hugoniot parameters[21]and the shock-induced chemical reaction using a multiscale modelling approach [22].Eakins [6,7] studied the Ni/Al powder mixtures with a mesoscale model based on real microstructures.The results revealed that the particle morphology and void distribution had significant influences on the shockcompression response and ignition of shock-induced reactions.There was a deviation from the inert solid mixture Hugoniot to higher particle velocities after a certain threshold.
In the present study,the shock-compression reaction mechanism of Al/PTFE composites was investigated via the Hugoniot data.Flyers with three materials,aluminum,copper,and Al/PTFE composites,were driven by a single-stage gas gun.The impact velocity ranged from 158 to 937 m/s.The measured time-resolved results with various extents of reaction were used to calculate the Hugoniot.To determine the Hugoniot in the inert state,a 3D mesoscale model without reaction was established based on images obtained by micro-computed tomography (micro-CT).The deformation of aluminum granules and the shock temperature rise were revealed by the finite element (FE) model.The shock compression reaction mechanism of Al/PTFE composites was discussed.
2.Experimental procedures
2.1.Specimen preparation
Al/PTFE composites with mass ratios of 26.5/73.5 were studied in this paper.Samples were fabricated by powder mixing,drying,cold isostatic pressing,and vacuum sintering[13,23].The mixtures consisted of aluminum powder with a size of 75 μm-150 μm and 99% purity (Sinopharm Chemical Reagent Co.,Ltd.,Shanghai,China),and the PTFE powder with a size of 150 μm (Shandong fluorine chemical Co.,Ltd.,Shandong,China),and the average density of the products was 2.235 g/cm.The surfaces of the specimens were polished to achieve satisfactory flatness.
2.2.Experimental system
As shown in Fig.1,the specimens used in this study were two semicircular columns with 50-mm diameters and 20-mm heights when a particle velocity gauge was used.To measure the pressure history,four disc-shaped specimens with diameters of 50 mm were glued (Epoxy AB glue) together,and three manganin piezoresistance stress gauges (π type,Beijing institute of Technology) [24]were fixed between them.The test objects were fixed in a ring and adjusted carefully to be horizontal.An artificial magnetic field was established normal to the surface of the particle velocity gauge.All the signals were recorded by an oscillograph (DSO5034A).Discshaped flyers with sizes of Ø52 mm × 5 mm were fabricated from aluminum,copper,and Al/PTFE composites.A flyer was fixed on the head of a projectile and was accelerated by a single-stage gas-gun.The experimental setup and projectile are shown in Fig.2.
2.3.Experimental results
The flyers were driven by highly-compressed air and the impact velocities ranging from 158 to 937 m/s.The results recorded by oscillograph were processed by the following method and listed in Table 1.A typical trace of the particle velocity uversus time is shown in Fig.3,results of the three sensors were marked as CH1,CH2,and CH3 respectively,only the CH1 and CH2 curves were considered in the processing.Signals recorded by the oscillographs were transformed into particle velocity versus time or pressure versus time data.A group of parallel lines (dot lines with dark green)along the rising edge of the trace were drawn in Fig.3.A line parallel to the X-axis was drawn that intersected the parallel lines.The distance between the intersection points was the time interval Δt of the two gauges and with the distance ΔS of the two channels in the gauge,the shock velocity uwas obtained as ΔS/Δt.The particle velocity uor pressure Pwas determined by the peak values near the parallel lines of the two traces.According to the Hugoniot relations,the pressure P,particle velocity u,and shock velocity uare related as follows:

where Pis the pressure,ρis the initial density,uis the particle velocity,uis the shock velocity,and vand vare the initial and final specific volume,respectively.All the Hugoniot parameters were obtained using these relations.
The curves shown in Fig.3 was the result of 1#with aluminum flyers,more typical curves with copper and Al/PTFE composites flyers are shown in Fig.4(a) and (b).Due to the lower sound velocities,impulses of the Al/PTFE composites flyers were sustained longer,and the resulting curves were smoother,whereas the stable stage was very short for the metal flyers.The large spikes in the curves were due to the fracture of the material [25].
Some specimens were recovered after the impact experiments,as shown in Fig.5.Under a low impact velocity (1#,158 m/s),the sample had a minor fracture.No products were found on the new surface.When the impact velocity was higher (3#,290.9 m/s;4#,240.6 m/s;6#,229.7 m/s),the specimens were more severely broken.Some black products were found on the broken surface of 3#.Wang Huaixi[26]has investigated the black products with XRD and EDS,he confirmed that the sample contains AlF,Al,and amorphous carbon.This reaction may have been caused by crack propagation and sliding interfaces in severe shear regions [27,28].This indicated that the reaction had been initiated.However,no products were found on the fragments of 6# (with manganin gauges).This may have been because the unloading wave caused detachment on the disc-shaped interfaces,which hindered the propagation of the crack.When the impact velocity was higher,the specimens reacted more severely,and no fragments were recovered in the collector.
Fig.6 shown the microstructures of the 4#fractured surface and the EDS (Energy Disperse Spectroscopy) analysis results of the reaction product on the surface.Fig.6 (a) demonstrated that a lot of cracks around the Al particles and a large number of micro product particles attachments on the Al particles surface.Fig.6 (c) and (d)given the mass ratio of C,Al,and F in the product.At point 1,the mass ratio was 62%,30%,and 8%,the major product was amorphous carbon.The mass ratio at point 2 was 50%,20%,and 30%,which indicated that the major product of the reaction was amorphous carbon and AlF.
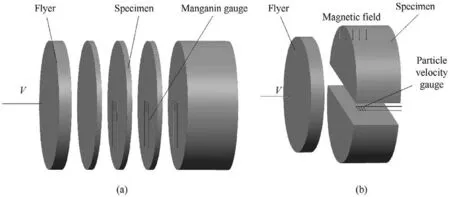
Fig.1. Schematic diagram of the specimens:(a) assembly with particle velocity gauge and (b) assembly with stress gauges.
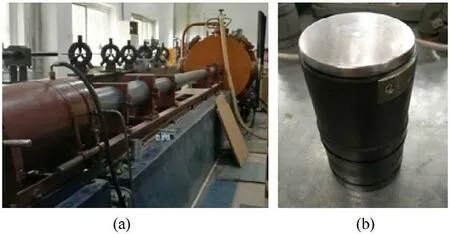
Fig.2. Experimental setup and projectile used in this study:(a) Single-stage gas-gun and (b) projectile with the aluminum flyer.
3.3D image-based finite element models
3.1.Image processing and meshing
To obtain images of the Al/PTFE composites,specimens were machined into cubes with side-lengths of 2 mm.A Zeiss Xradia 510 X-Ray Microscopy system with an effective voxel size of 2 μm was employed to scan the cubes.A region of interest (ROI) [29] with a size of 0.4 mm×0.4 mm×0.4 mm was selected,and sliced images were segmented using greyscale-based thresholding.The grey values above the threshold were regarded as aluminum particles,whereas others were regarded as the PTFE matrix.Voids were ignored in this model.Morphological operations,such as opening and closing,were used to fill holes and smooth the boundaries,Fig.7 shows the thresholding and Morphological operations result.Finally,the binary images were compressed and mapped to a homogeneous grid with a mesh size of 4 μm.All the operations were performed in MATLAB.
3.2.Numerical model
The three-dimensional numerical model was imported into ABAQUS.The volume fraction of aluminum in the model was 20.57%,which was close to the ratio of the composites.A block representing a flyer impacted the composites with a constant velocity to generate shock loading.Sliding boundary conditions were assigned to the sides normal to the impact direction to eliminate the rarefaction wave from the lateral sides.Due to the large deformation during impacting,a multi-material Euler algorithm was employed in this model.In the Euler algorithm,the grids were fixed,and materials were tracked as it flows through the mesh by computing its Eulerian volume fraction(EVF)within each element,the boundaries of each Eulerian material are reconstructed using the Volume fraction data.To investigate the Hugoniot relations,two layers of elements (see Fig.8) along the impact direction were selected.The particle velocity and pressure of one layer were calculated by averaging the results of 10,000 elements(see Fig.8).The numerical model is shown in Fig.8.
3.3.Material models
During the impact events,materials experienced high pressures and large deformation.The model describing the mechanical responses of the materials under dynamic loading included two parts:a strength model that controlled the yield stress and an equation of state (EOS) that determined the hydro pressure in terms of the density and energy [21,30].In this study,the Johnson-Cook model was employed for aluminum granules and the PTFE matrix.This model is applicable for large strains,highstrain rates,and high-temperature conditions,and it accounts for the strength of the material as a function of the strain,strain rates,and temperature.The von Mises flow stress is defined as follows[31]:

Table 1 Experimental results.
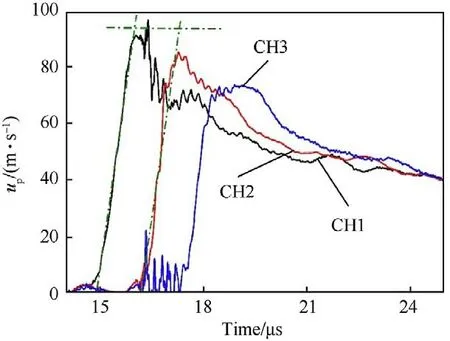
Fig.3. Schematic illustration of the particle velocity up results.


The Mie-Grüneisen EOS was used in ABAQUS,with a linear shock velocity-particle velocity relation (u-u) to define the pressure P for compressed materials:

where C,s,and γare constants,η=ρ/ρ-1,and E is the internal energy.The EOS parameters are listed in Table 3.
For the material model of the flyers,which solely provides the shock wave for the composites,the Copper model was used.
4.Simulation results
4.1.Relationship between wave velocity and particle velocity
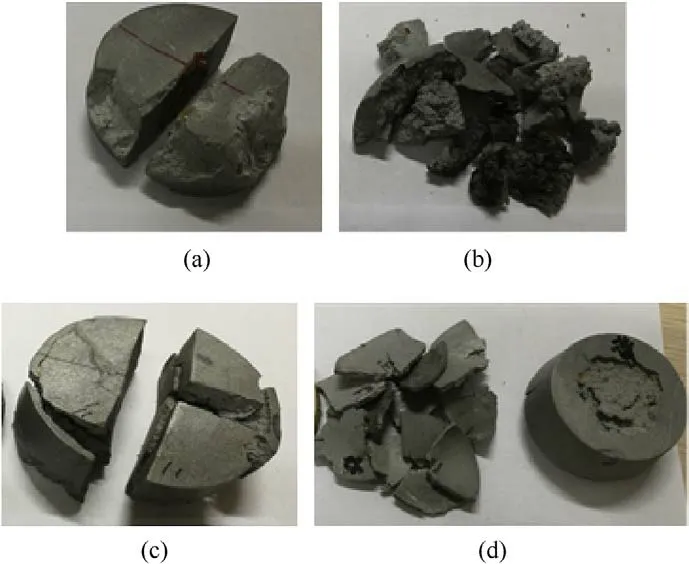
Fig.5. Specimens recovered from four tests.Some black products were found on the broken surface of 3# (a-1#,b-3#,c-4#,d-6#).
To validate the model and study the Hugoniot relation under high impact velocities,simulations with impact velocities ranging from 250 to 2200 m/s have been simulated.Under high pressures,five quantities(pressure,density,internal energy,particle velocity,and shock velocity) were used to determine the states of the materials,combined with the Rankine-Hugoniot relations and EOS.Extensive experimental results have shown that the wave and particle velocity have a linear relationship over a wide pressure range as follows:

where Cis the acoustic velocity,and S is the slope.
The results of the Hugoniot pressure P and particle velocity ufor all the elements(total 10,000)on the two layers were summed and averaged and are shown in Fig.9.The curves were processed using the same approaches as those shown in Section 2.3 with details listed in Table 4.When the particle velocity varied from 0.24 to 2.0 km/s,the pressure increased from 1.211 to 29.223 GPa.The impulses near the impact end had a flat stage,and the oscillations on the stage may have been caused by the heterogeneity of the materials on this layer.It is essential to note that due to the microscopic dimension limitation and the constant velocity of the flyers,the rarefaction wave was from the free end of the model and the shapes of the waves on the Layer 2 unloaded more quickly.
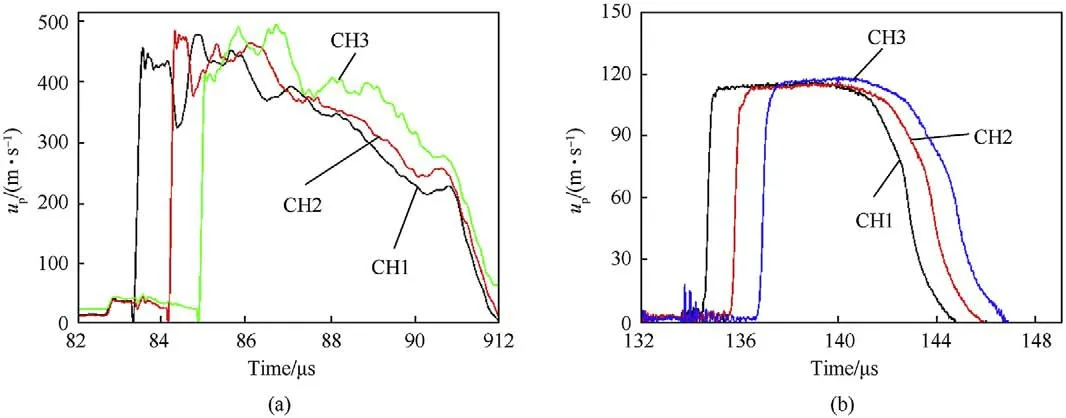
Fig.4. Typical particle velocity up vs time traces with different flyer materials:(a) 8# with a copper flyer and (b) 2# with an Al/PTFE flyer.
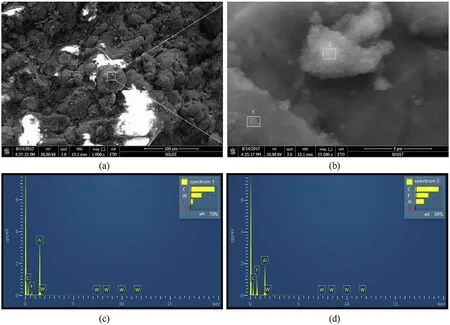
Fig.6. SEM image of the 4# fractured surface and the EDS result of the reaction product on the surface.
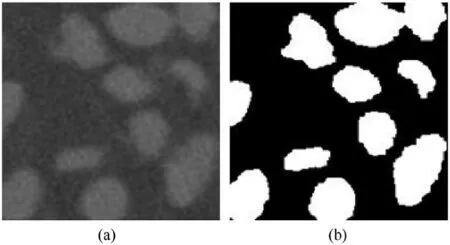
Fig.7. Schematic illustration of the CT image and binary image after thresholding:(a)Region of interest (ROI) of the 3D CT image.(b) Corresponding binary image after the image processing.
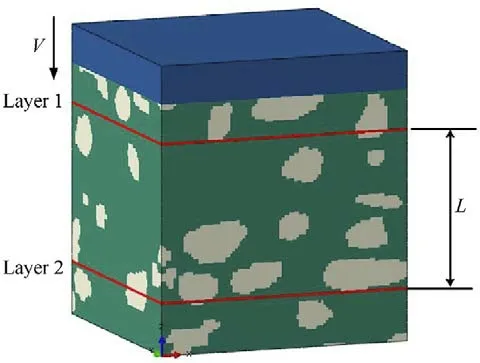
Fig.8. The full 3D FE mesoscale-model created from the CT images.

Table 2 Parameters of strength models of the materials [20,31].

Table 3 EOS parameters of the materials.
Fig.10 shows the pressure cloud diagrams at different times for impact velocity of 2200 m/s,as shown in Fig.10,the shock-front dividing the material into uncompressed and compressed regions[21].Fig.11 gives the pressure profiles with different impact velocities at three-time transients,these calculated by averaging the element results along the impact direction.The shock pressure increased with the increase in impact velocity.Due to the heterogeneity of this composite,the wavefront was uneven for all conditions,as shown by the 2D results [21];whereas the transient wave profiles as shown in Fig.11 demonstrates the shock wave propagating stably on the macroscopic.As the shock wave propagated,the materials flowed and were compressed in the impact direction,the flow of heterogeneous materials caused oscillations on the resulting curves.
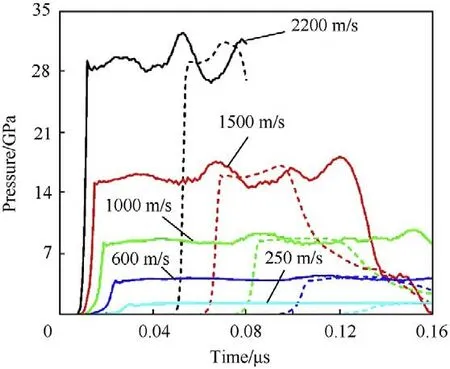
Fig.9. Hugoniot pressure results of the simulation(the solid lines indicate the mean of the elements results of Layer 1,whereas the dotted lines indicate the average results of Layer 2).
4.2.Deformation of particles
Aluminum particles inlaid in the PTFE matrix experienced compression and deformation due to the shock wave.To investigate the details,origin,and post-shock state of the particles at the same transient (t=0.06 μs) in model with different impact velocities(1000,1500,and 2200 m/s) are shown in Fig.12.The particle was compressed in the impact direction and deformed by the shock wave.Due to the fixed grids,some of the material has been pushed out of the calculation region.The deformation of particles under shock can be explained qualitatively using shock theory [32,33].Assuming that the aluminum had a round shape,the deformation process is illustrated in Fig.13(a)-(c).For a deformation at 2200 m/s,the shock pressure achieved in the model was 29.2 GPa.Using Eqs.(1)and(3),the particle velocity of PTFE was 2343 m/s,whereas the particle velocity of aluminum was 1466 m/s.As the shock wave passed through the PTFE-Al interface,the matrix was compressed and flowed around the Al granule due to its resistance.The material on the border of the granule was subsequently pushed forward.The shock velocity of aluminum was higher than that of PTFE.The wave in the aluminum arrived at the top interface first,the shock wave was reflected,and a low-pressure region emerged at the top of the granule,after which more material flowed in this region.

Table 4 The simulation results of pressure P and particle velocity up.
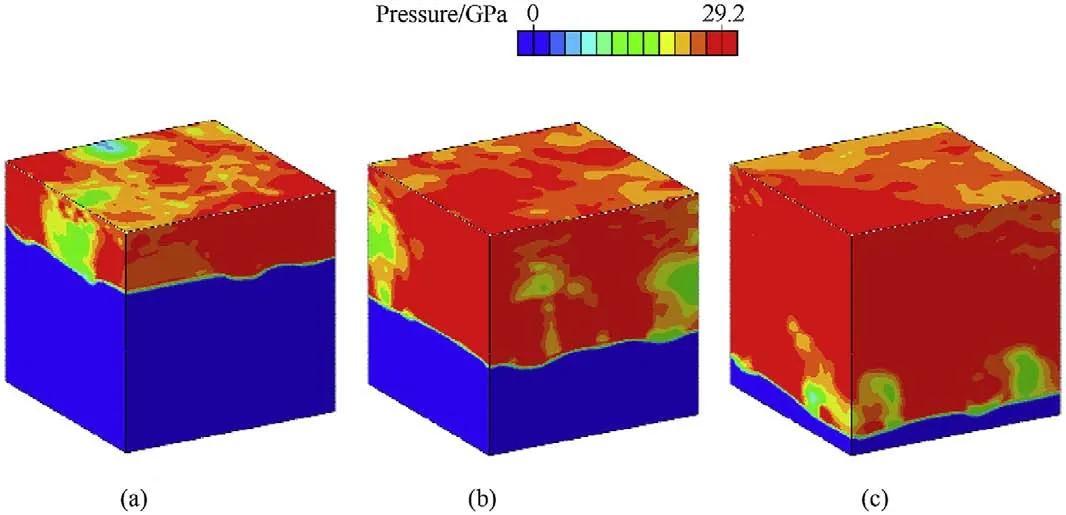
Fig.10. Pressure cloud diagrams for an impact velocity of 2200 m/s at time 0.02 μs,0.04 μs,0.06 μs,respectively.
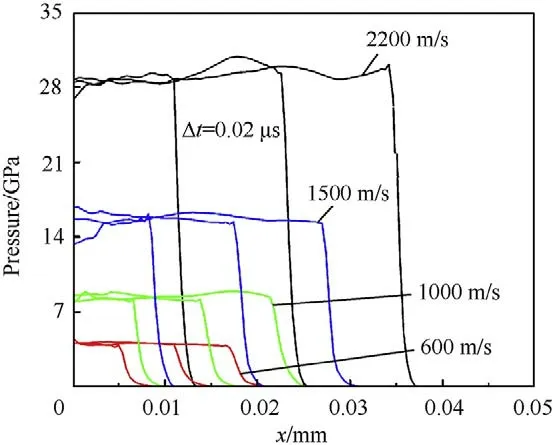
Fig.11. The average pressure curves along the impact direction at three transients.
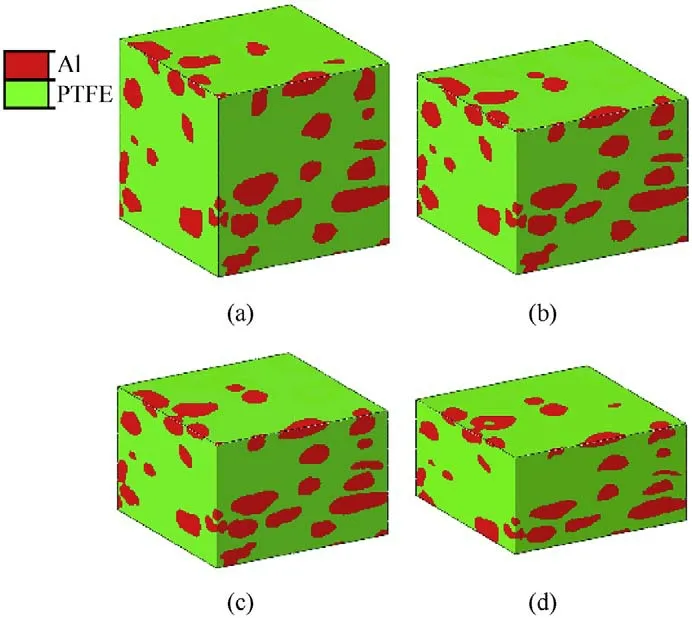
Fig.12. Deformation of the Al particles due to the shock compression;(a)original;(b)v=1000 m/s;(c) v=1500 m/s;(d) v=2200 m/s.
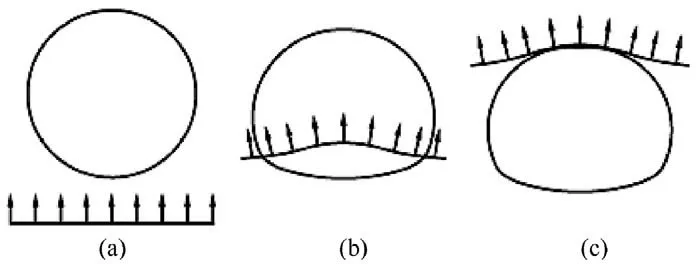
Fig.13. Illustration of the particle deformation process under shock loading.
5.Discussion
5.1.Result comparison
The experimental and numerical results obtained in this paper are shown in Fig.14,and the data for the higher-velocity stage were obtained from a previous report[8].As shown by a linear fit of Eq.(3)and numerical results,the fit values of Cand S were 1.598 km/s and 2.021.As shown in Fig.14,although there were various extents of reaction at high pressures,the simulation results agreed well with the experimental results,which verified the accuracy of the FE model proposed in this paper.The dispersion of the data points may have been caused by the different experimental methods,the particle size distribution [21],and the neglect of voids in the FE model.
5.2.Mesoscale -shock temperature field
The steady-state shock-wave propagation in solid results in bulk compression and temperature rise,the thermodynamics process under shock loading is assumed to be adiabatic,there have many theories to calculate the shock temperature rise [34,35].On the other hand,solid melts above the melting point,at ambient pressure;the melting point of Teflon and Al are about 600 K and 933 K respectively[36,37],which is higher that under high pressure.The melting temperature Tof solid under high pressure is given by a modified Lindemann law [35]:
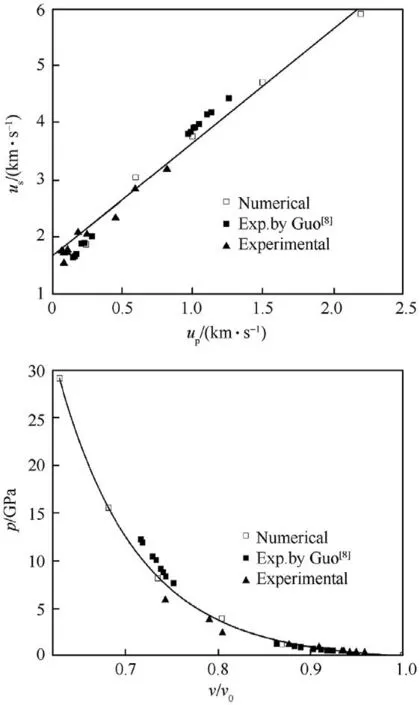
Fig.14. Experimental results and numerical results:(a) us-up and (b) P-V/V0.

By combining with Eqs.(1)-(4),the melting line of Teflon under high pressure is calculated and shown in Fig.15,the theoretical shock temperature result [38] is also plotted in the figure.It was shown that Teflon will melt about 680 K under shock loading,other research shown the shock melting point of Al exceeds 4500 K[35].
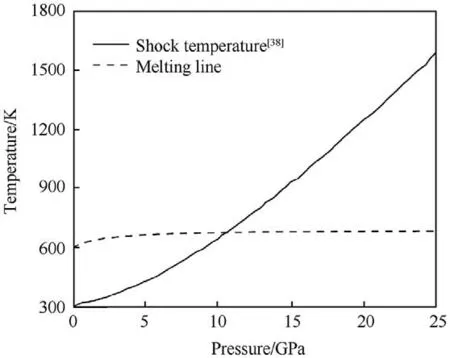
Fig.15. The shock temperature rise and the melting line of PTFE.
In the simulation,the adiabatic temperature rise of each material caused by the mechanical work is calculated directly at the material integration points and mass averaged in each element.The temperature rises under different impact velocities at the same transient(t=0.06 μs)is shown in Fig.16.At a given shock pressure,the more compressible Teflon absorbs more energy and is heated to a higher temperature than Al particles,the temperature field after the shock front can be described as cold Al particles inset in the high-temperature PTFE matrix.As Fig.16 (a) illustrated,at the impact velocity of 600 m/s,the Hugoniot pressure in Al/PTFE composite is about 3.886 GPa,there has some PTFE matrix melting after the shock wavefront.When the impact velocity reaches 1000 m/s,the PTFE matrix melting almost entirely,whereas the temperature rises of Al particles is far below the melts point of the aluminum in this research.
5.3.Discussion of the reaction mechanism
For the experimental investigation of energetic materials,another test method is the sealed chamber test[9,39,40]:launching a fragment made of energetic material to impact on the steel anvil in the sealed chamber,then the fragment reacts in the chamber and produces a global “quasi-static pressure” in the chamber.The“quasi-static pressure” can be recorded by the sensors inside the chamber,the peak value of this pressure ΔPcan be written as a function of the energy deposition in the chamber ΔQ:
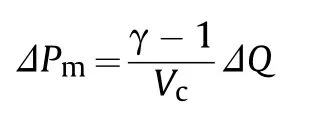
where γ=1.4 is the adiabatic index of the gas in the chamber,Vis the volume of the test chamber.
It is assumed that the energy deposition of the ΔQ only contains the kinetic energy of the fragments Eand the energy released by reaction E,the reaction efficiency y can be written as:
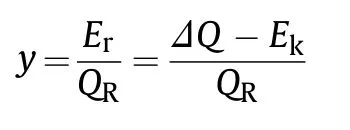
where Qis the complete reaction energy of the fragment,the kinetic energy Ecan be calculated via the impact velocity and the fragment mass,which can be obtained conveniently.
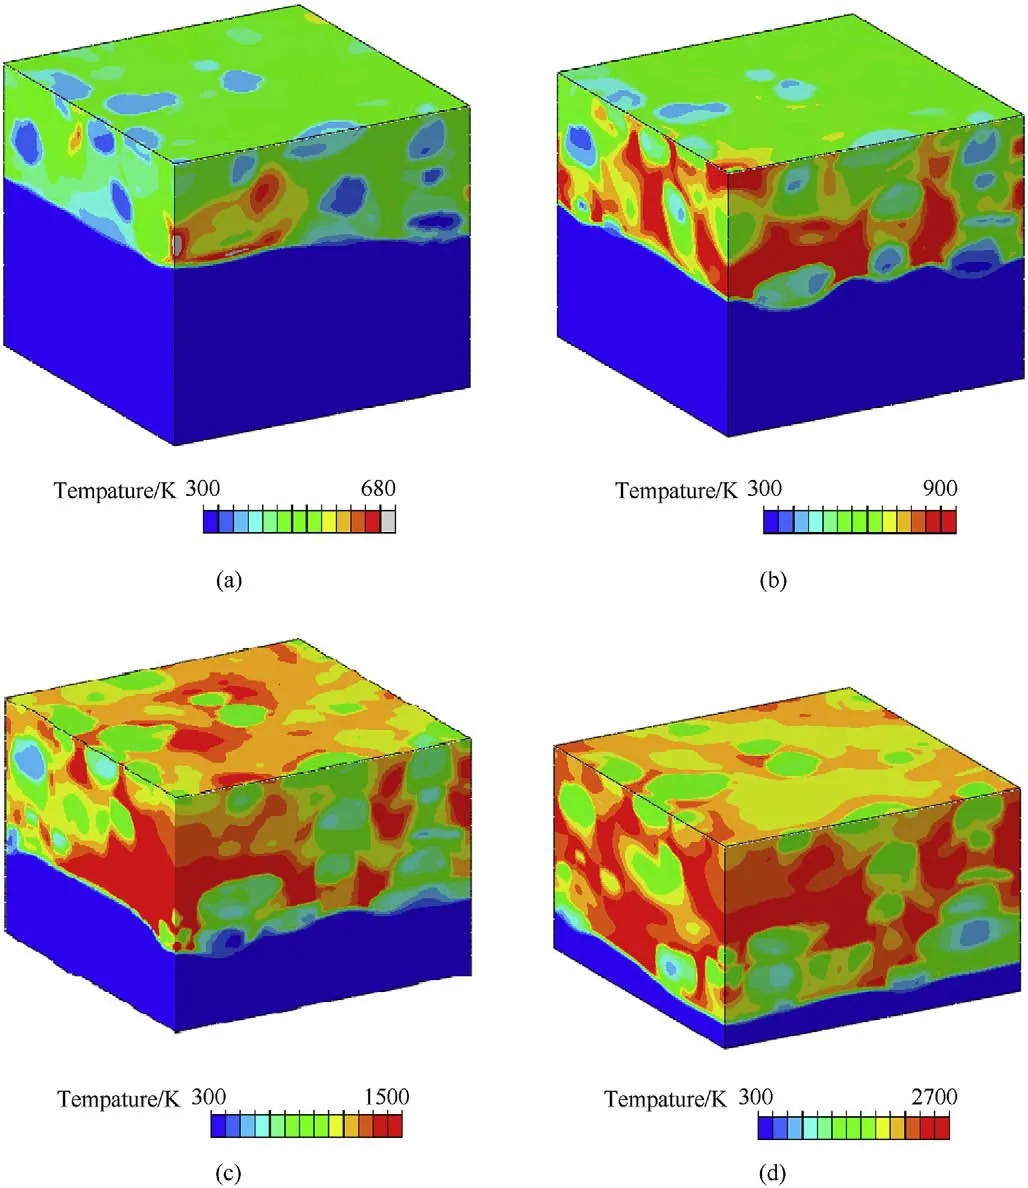
Fig.16. The mesoscale shock temperature cloud diagrams under different impact velocities:(a) v=600 m/s;(b) v=1000 m/s;(c) v=1500 m/s;(d) v=2200 m/s.
On the other hand,the impact pressure can be calculated by the one-dimensional shock wave theory[15],then we have the relation between impact pressure and reaction efficiency.
In our work recently [15],we have developed a theory to calculate the relation between impact pressure and reaction efficiency,based on the sealed chamber test of the Al/PTFE and Al/PTFE/W composites.The impact velocity of Al/PTFE composite ranges from 685 m/s to 1005 m/s,the calculated impact pressure,and the reaction efficiency range from 3.83 GPa to 6.23 GPa and 37.8%-65.3%as shown in Fig.17 The curve is the calculated result of the theory model,the reaction extent of the experiments in this research are also calculated and shown in Fig.17.
Two categories were used to describe the reaction mechanism in reactive materials due to shock-loading:shock-induced and shock-assisted mechanisms.The difference between the two mechanisms is as follows[18,41].(1)Shock-induced reactions occur within or just after the shock front,while the material is still compressed at high pressure,for a time scale of a few ns to tens of μs.Shock-assisted reactions occur following the unloading from the high-pressure state,for a time scale of tens of μs or ms.(2)Shockinduced reactions are mechanochemical reactions caused by plastic deformation,fluidlike flow,mass mixing,and dispersion of constituents in the high-pressure state,whereas shock compression simply assists (activating or modifying) the powder mixture for subsequent thermal initiation in shock-assisted reactions.(3) Due to the shock-induced reactions occurring within the pressure equilibrium time scale,the change in bulk properties caused by chemical heat can be determined by time-resolved in situ measurements,whereas they cannot be for shock-assisted reactions.
Similar to the homogeneous and heterogeneous explosives,during the shock-induced reaction of reactive mixtures,the phase transformation and energy release caused by chemical reaction arouse the Hugoniot of the mixtures exhibited a deviation from the inert solid mixture at increased volumes upon reaching a certain threshold[6,34,42],many theoretical models have been established to determine the shock induced reaction degree[2,3,34,43].For the reaction of the Al/PTEF composites in this work,according to our previous work,the minor extent of reaction in this plane-impact test is around 0.7,and the reaction ratios of plane-wave lens experiments [8] were in the range of 0.6-0.9.The reaction was ignored in the numerical model of this paper,however,the Hugoniot of the simulations was consistent well with the experimental results.It is known that PTFE will undergo a pressure-induced phase transition.However,the transformation occurs around a hydrostatic pressure of 0.6-0.8 GPa[44-46],which is not sufficient for the ignition of the chemical reaction of the composites.Many studies have indicated that the shock velocity uof PTFE maintains a good linear relationship with the particle velocity uover a wide range of pressures [44,47].Thus,the phase transition was ignored in this study.
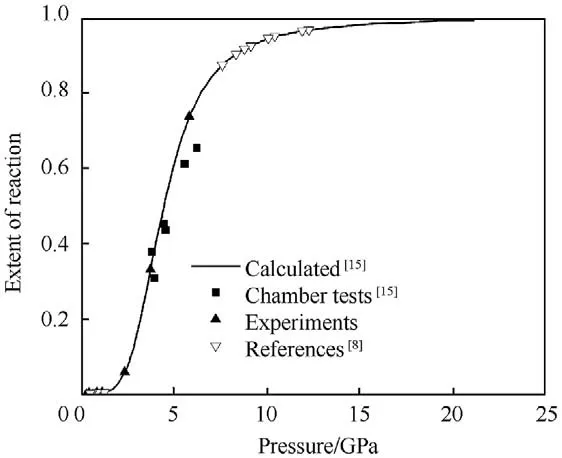
Fig.17. The reaction extent of the Al/PTFE composites.
As discussed in Section 4.2,the PTFE matrix is easier to be compressed and flowed than the Al granules,which limited the mixing between the two materials.The high theoretical maximum density(TMD)left fewer defects and voids,which was unfavorable for igniting a shock-induced reaction.The simulation reveals that the shock pressure heated the Teflon to a higher temperature than Al particles,the Teflon matrix melts on the high shock pressure.The hotter Teflon might decompose to release CF,or even F,which could diffuse through the oxide shell to react with the Al cores[38,48,49].The flow of the PTFE matrix and shear stresses from the unloading of shock pressure could crack the oxide shells and expose the Al core,which would accelerate the diffusion of atoms.Reactions via atom diffusion require longer times than mechanochemical action.All these indicate that shock waves modify,rather than induce,the shock compression reactions of Al/PTFE composites.
Unlike the shock induced reaction,the reaction of Al/PTFE in this research not fast enough to influences the equilibrium of the shock front,the reaction mainly occurred after the shock compression and is driven by thermally controlled reaction mechanisms,which is more like a combustion rather than a detonation.The shock reaction process of Al/PTFE composites might be described as the shock temperature rise led to the melting and decomposition of the matrix and accelerated the diffusion of the atoms,the tensile and shear force arouse by shock wave crack the oxide shells,after which the Al particles combust in the melting PTFE matrix.Considering that the reaction occurred after the shock front,it is inappropriate to simply focus on the peak value of the time-resolved measurements,the reaction energy may influence the unloading stage of the time-resolved profile,which needs more experimental evidence.
6.Conclusions
In this study,the shock-compression response of Al/PTFE RMs was investigated with a single-stage gas-gun.A 3D mesoscale-FE model was established based on images obtained using micro-CT and the accuracy of the model was confirmed with experimental results.With the numerical model,the deformation of aluminum granules under shock compression and the shock temperature rise were investigated.Then the shock-compression reaction mechanism of the Al/PTFE composite was discussed based on the findings.The main conclusions were as follows.
(1) The shock-compression response of Al/PTFE composites was investigated with single-stage gas-gun experiments,and the impact velocity ranged from 158 to 937 m/s.The Hugoniot results were consistent with existing work,and the reaction was observed in some tests.
(2) A 3D FE model was established based on images obtained from micro-CT.The Hugoniot of the simulation was consistent with the results of the time-resolved experiment,although there were various extents of reaction at high shock pressure.The mesoscale-model reveals that there no obvious mass mixing after the shock front,the PTFE matrix be heated to a higher temperature than Al particles,and will melt at high impact velocity.
(3) The shock compression reaction of the Al/PTFE composites was a “shock-assisted” rather than a “shock-induced”mechanism.the reaction mainly occurred after the shock front and is driven by thermally controlled reaction mechanisms,which is more like a combustion rather than a detonation.The released energy did not influence the equilibrium of the shock front,whereas the shapes of profiles may be modified.
The authors declare that they have no known competing financial interests or personal relationships that could have appeared to influence the work reported in this paper.
This work was supported by the Fundamental Research Funds for the Central Universities [grant numbers 30915118812,30915118806,and 309171B8804],the National Natural Science Foundation of Jiangsu China [grant number BK20160832],and the National Natural Science Foundation of China [grant numbers 51601095,11504173,11502118,11702145,51375244,and 51301093].
杂志排行
Defence Technology的其它文章
- Numerical investigation of the failure mechanism of cubic concrete specimens in SHPB tests
- Experimental and numerical investigation of zirconium jet performance with different liner shapes design
- Effects of module number and firing condition on charge thermal safety in gun chamber
- Controllable combustion behaviors of the laser-controlled solid propellant
- Dual-steering mode based on direct yaw moment control for multiwheel hub motor driven vehicles:Theoretical design and experimental assessment
- The investigation of NTO/HMX-based plastic-bonded explosives and its safety performance
