Effect of lmpeller Solidity on the Generating Performance for Solar Power Generation
2022-01-08JiaLiuRuiTianJingNie
Jia Liu | Rui Tian | Jing Nie
Abstract—According to current solar power research,both the generating unit’s minimum start-up speed and power generation system’s minimum flow rate for operation decrease with the increase in the impeller solidity.Ideally,a high solidity should be achieved,as this translates more power for a solar power system in the start-up and shutdown cycles.However,increasing the number of blades does not increase the impeller solidity;therefore,there is an optimal number of blades needed to achieve the preferred solidity.This paper begins by selecting the blade airfoil and then performs a theoretical analysis based on the relationship between the blade number and chord length.Experiments are conducted to measure the starting and stopping wind speeds and power characteristics for different numbers of blades.The results show that a maximum impeller solidity of 0.2862 is achieved,as well as the minimum flow speed at the start-up,and the maintenance of the solar chimney power generation system is optimized when there are four blades.
Index Terms—Blade number,impeller solidity,solar chimney power generation.
1.lntroduction
The principle design of a solar chimney power generator begins with using solar radiation to heat water in a heat collection shed.This heated water is converted into vapor,creating a local high pressure in the heat collection shed.The hot vapor then moves upward,causing the impeller to rotate.The mechanical energy of the rotating impeller is then converted into electric energy via a generator set[1],[2].
The solidity is a common metric used to determine the wind turbine performance.It is defined as the ratio between the projected area of the windward direction of an impeller blade and the sweeping area of the rotating turbine[3],[4].While the degree of compactness is the actual determinant for the power generation system,the number of impeller blades is seen as the most intuitive parameter[5],[6].When the solidity of the wind turbine is small,the force area of the impeller is also small;therefore,it is difficult to start.
Much research currently focuses on optimizing the structural parameters for a single blade[7]-[9]without considering the impact of the impeller solidity on the power generation performance of generating units[10]-[12].Additionally,current research does not consider that the change in the aerodynamic performance of the blade will affect the relevant research results,when the relationship between the impeller solidity and blade number is taken into account[13]-[19].The wind turbine used for power generation,and the shape and number of blades are essential to the impeller solidity and determine both the start-stop speeds and the efficiency of generating units.
Zhanget al.[20]proposed that the start-up characteristics of wind turbines at a low spike-to-speed ratio could be improved by increasing the solidity.Therefore,different solidities could lead to different wind-energy utilization by impellers.Further,the increase in the number of blades could reduce the peak wind-energy utilization value.Wuet al.[21]found that the efficiency of the impeller is negatively correlated with the solid degree of the impeller when the latter exceeds the optimal value.Therefore,there should be a corresponding relationship between the number of blades and the degree of compactness,so that the power generation system has both a better start-up performance and a higher wind-energy utilization rate.
2.Theoretical Analysis
The blade element theory divides the turbine blade into many micro-segments along the extension direction.Each micro-segment is called a blade element.The aerodynamic characteristics of the whole blade are then obtained by integrating those of the blade element along the radial direction[15].
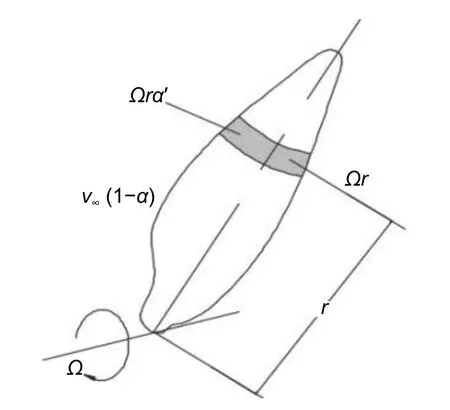
Fig.1.Schematic diagram of the speed component.
The effective wind speed of the blade element at a given distance from the rotating axisris represented asv∞(1 −α),wherev∞is the incoming wind speed as shown inFig.1.
Based onFig.1,the rotating angular speed is defined as the sum of the rotating angular speed of the turbine and the induced angular speed calculated by the conservation of angular momentum.The linear speed is expressed as

whereΩis the rotating angular speed of the blade,ωis the torsional angle,andα′is the rotating arc length.
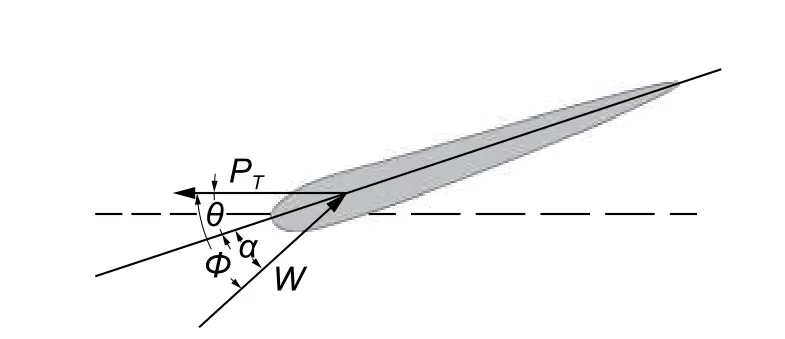
Fig.2.In-plane speed diagram of a blade element airfoil.
The blade element airfoil with the radiusris extracted based onFig.2,whereθis the local pitch angle of the blade element airfoil,Φis the angle between the blade element relative speed and rotating plane of the wind wheel,andαis the local attack angle of the blade element airfoil.
Based onFig.2,the relative speed on the airfoilWis defined as

Based on the aerodynamics of the airfoil depicted inFig.3,the lift force of the airfoil is perpendicular to the direction of the synthetic speedW,while the drag force is parallel to the direction ofW.
As shown inFig.3,the liftLand dragDforces per unit length of the blade element are calculated as

whereρis the air density,Wis the combined speed,cis the chord length atr,C1is the lift coefficient,andCdis the drag coefficient.
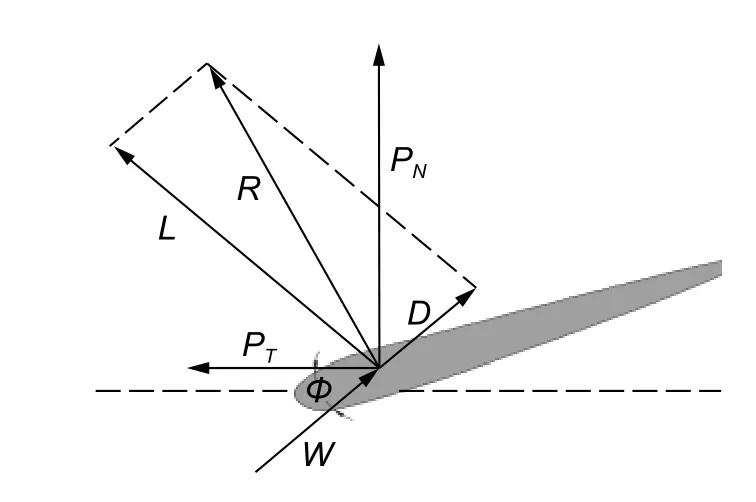
Fig.3.Pixel planar dynamics diagram
The torquedMis given as

whereBis the number of blades.
Equation (5) can be rearranged forMas torque.

The degree of compactnessσis defined as

whereSis the projection of a single blade in the rotating plane of the impeller.This projection can be computed by

Substituting (8) into (7),we get

From (6) and (9),the following is derived:

According to (10),the higher the degree of the solidity for the impeller,the greater the maximum output torque of the impeller shaft is,when the remaining conditions are unchanged.This can reduce the minimum starting speed of the wind turbine,while maintaining the minimum flow speed of the power generation system.Additionally,this can prolong the working time of the wind turbine in a power generation cycle and increase the power generation capacity of the power generation system.
3.lmpeller Modeling
3.1.Selection of Blade Airfoil
The relevant parameters of the solar chimney power generation system are shown inTable 1.
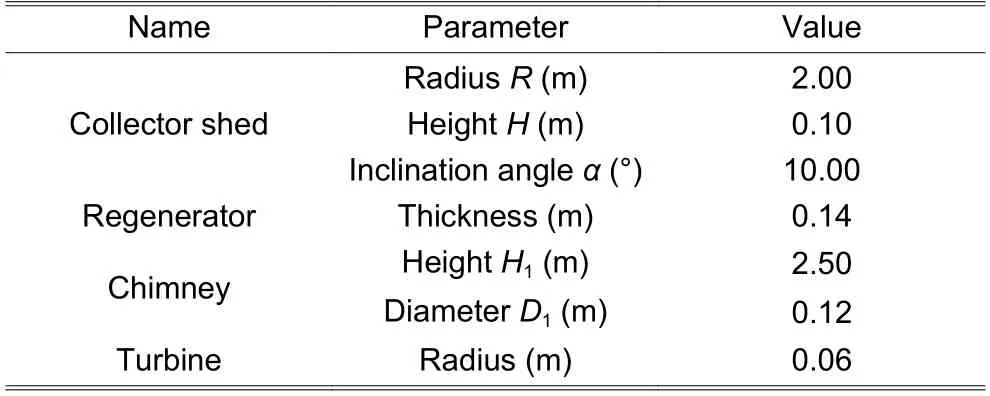
Table 1:Relevant parameters for the solar chimney power generation system
The basic principle of the speed measurement at the chimney outlet is presented inFig.4.
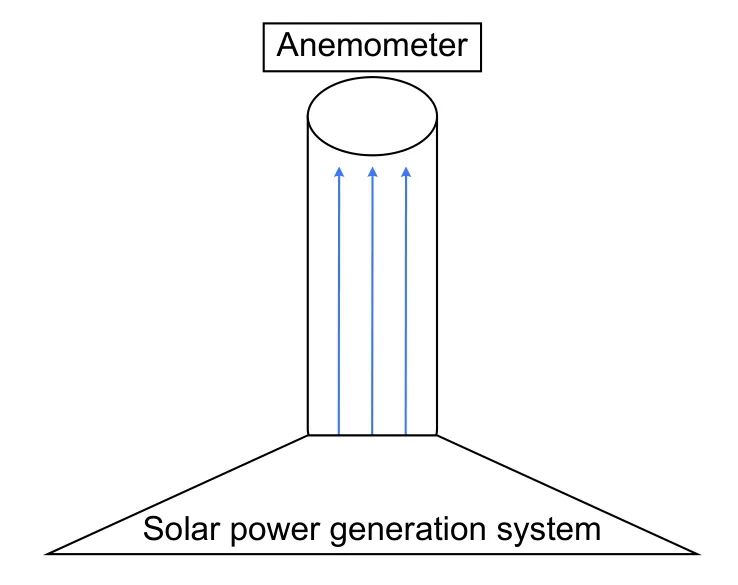
Fig.4.Speed measurement at the chimney outlet.
The flow speed at the chimney outlet was obtained based on the parameters of the chimney and the test results.The Rayleigh number in the chimney was calculated to be between 1.596 × 10⁴and 3.019 × 10⁴.The airfoil was selected using a professional airfoil design and the analysis software(Profiling 2.0).When the Reynolds number was equal to 30000,airfoils NACA1408,NACA1412,NACA2408,NACA2410,NACA2418,and others were selected for comparison in the software,as shown inFigs.5to9,whereC1is the lift coefficient andCdis the drag coefficient.It was found that the comprehensive performance of the NACA2408 airfoil was better and the lift-drag ratio of it was larger than that of the other selected airfoils.Therefore,the NACA2408 airfoil was chosen to represent the basic airfoil of the turbine blade.The maximum curvature of the airfoil was 8.01% with a 29.8% chord and a maximum surface was 3.00% with a 41.2% chord.
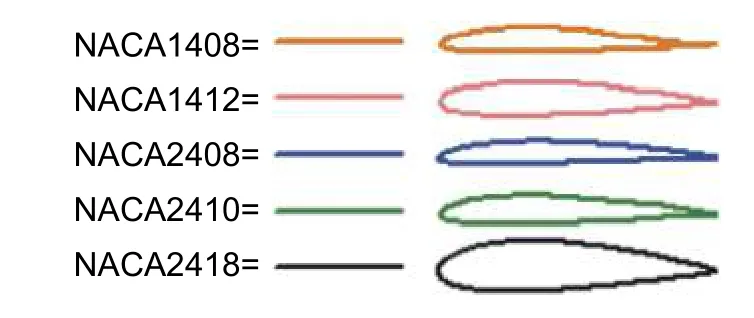
Fig.5.Cross-section of the selected blades.
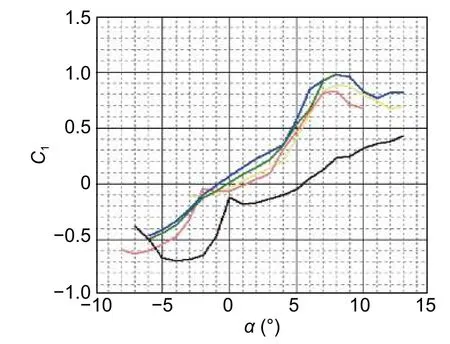
Fig.6.Lift coefficient under different angles of attack.
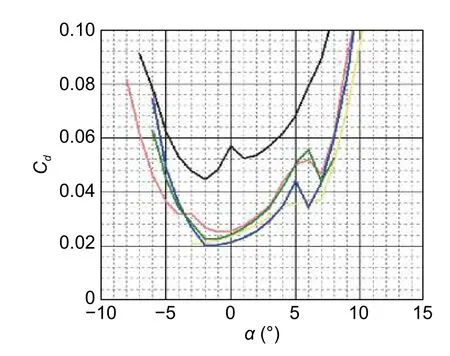
Fig.7.Drag coefficient under different angles of attack.
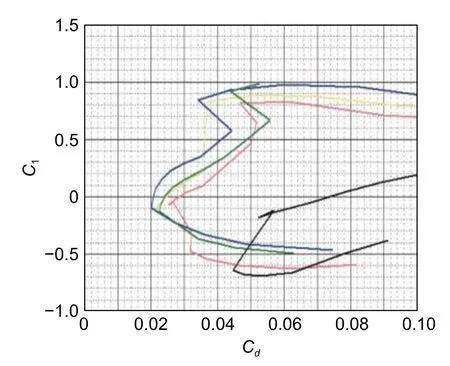
Fig.8.Comparison under lift and drag coefficients.
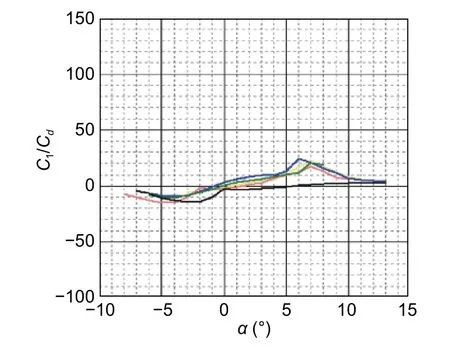
Fig.9.Lift and drag coefficients under different angles of attack.
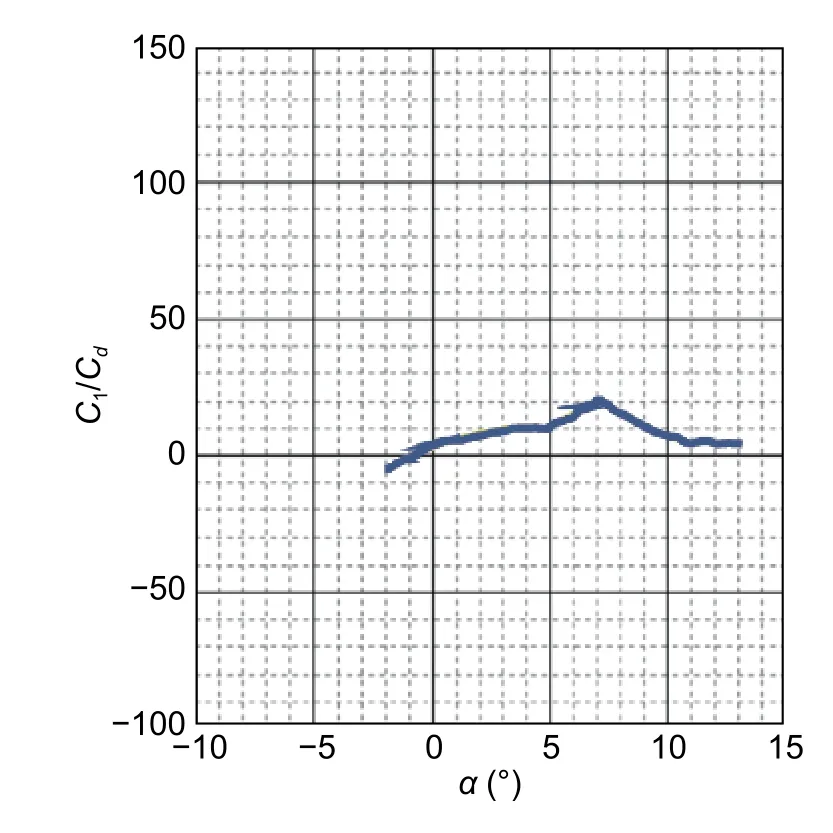
Fig.10.Relevant ratio for the NACA2408 airfoil under different angles of attack.
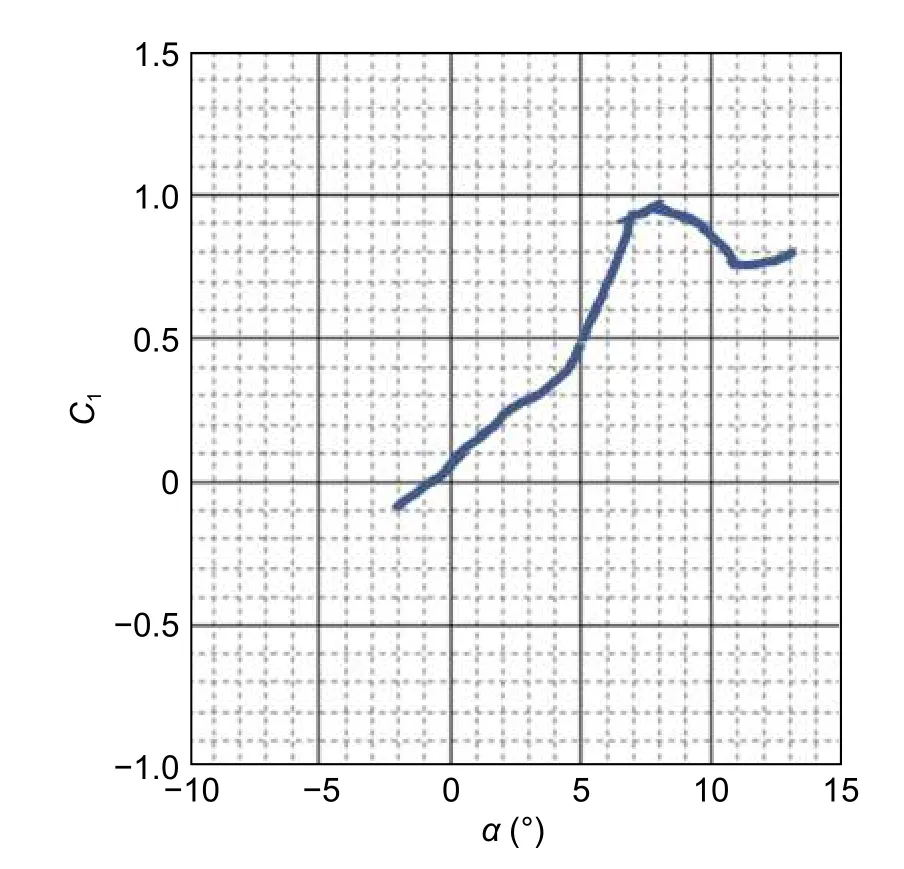
Fig.11.Lift coefficient under different angles of attack.
The ratio of lift to drag coefficients for the NACA2408 airfoil at different angles of attack is compared inFig.10.It is shown through comparison that the ratio of lift to drag coefficients is larger for an airfoil with an angle of attack of 7°.Therefore,the angle of attack for the blade should be 7°.
C1was 0.9077 andCdwas 0.0459 for the NACA2408 airfoil when the angle of attack was 7°.The relevant results are provided inFigs.11and12.
3.2.Determination of Blade Chord Length
The selection of blade numbers was different based on the sharp speed ratio (λ0) and the chord length of impeller blades.The specific selection is shown inTable 2.
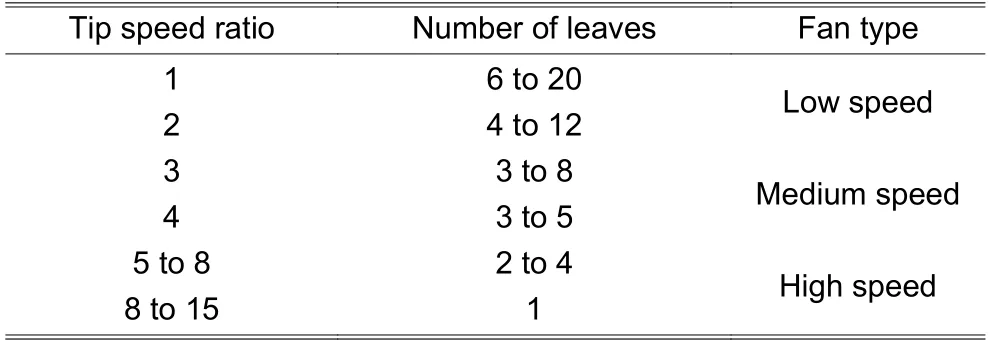
Table 2:Relationship between the blade number and tip speed ratio of wind turbines
The tip speed ratio refers to the ratio between the linear speed of the blade tip and the wind speed entering the impeller.In the design,nine sections of the airfoil were taken at the blade radiusn=10%,20%,30%,40%,50%,60%,70%,80%,90%,and 100%,respectively.The tip speed ratio of each section was then calculated by

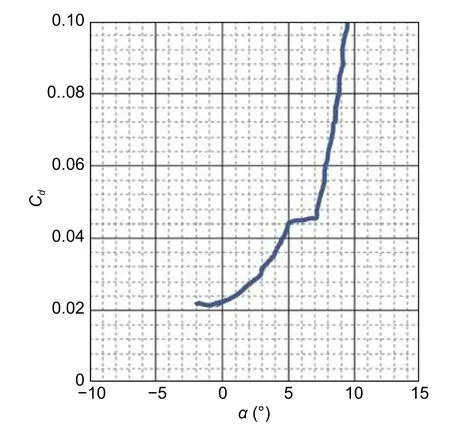
Fig.12.Drag coefficient under different angles of attack.
The chord lengths atn=10%,20%,30%,40%,50%,60%,70%,80%,90%,and 100% of the blade radius were calculated based on


whereNis the shape parameter of the airfoil,is the maximum lift coefficient,Bis the number of blades,Cl C1=0.9077,and .Cd=0.0459
The calculation results of the chord length of the impeller under different numbers of blades are shown inTable 3.
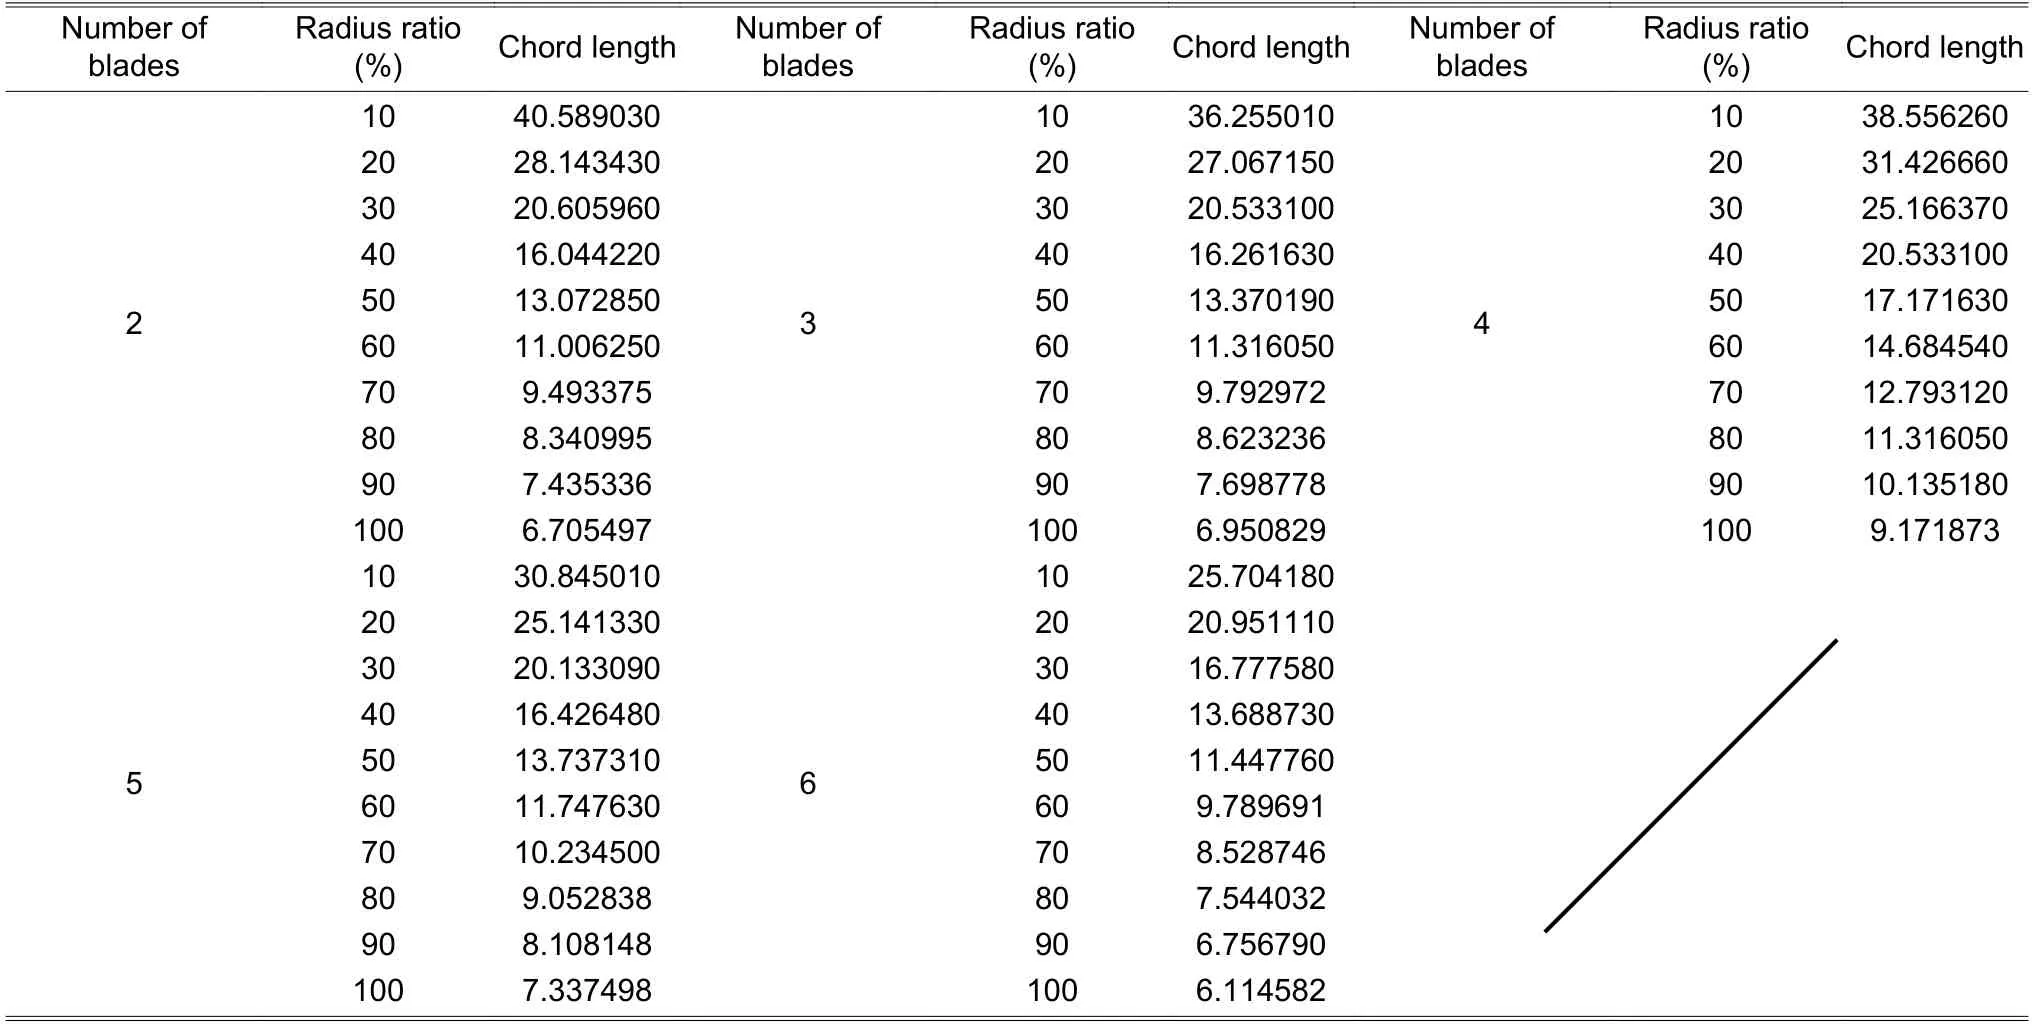
Table 3:Relationship between the number of blades and chord length
Considering the installation of blades,the chord length at the blade root needs to be revised according to the installation requirements.Taking two blades as an example,the chord lengths of the blades before and after optimization are compared and shown inFig.13.
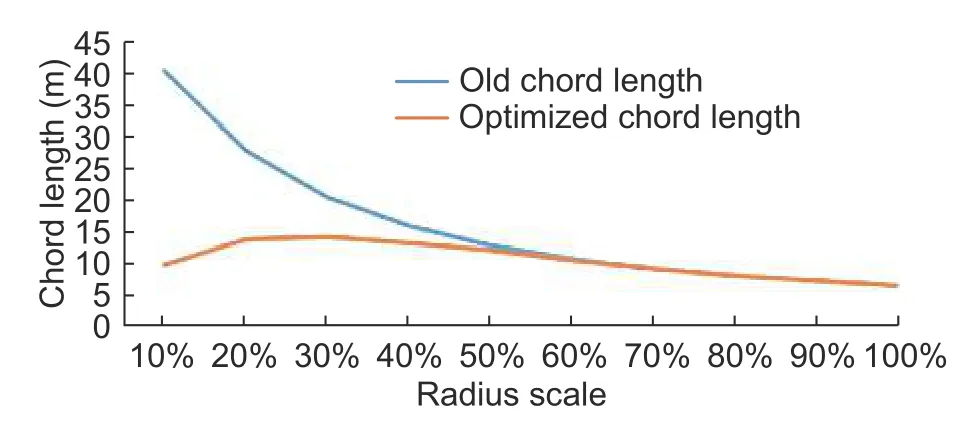
Fig.13.Comparison of chord lengths before and after correction.
3.3.Establishment of Three-Dimensional (3D)Model of Blade
The coordinates of the airfoil were input into SolidWorks to establish the section curve of the NACA2408 airfoil.According to the chord length of the blade as corrected above,the profile curve of the blade at different radius sections from the impeller center was created by the zooming command,as shown inFig.14.
A 3D model of the blade was built using the lofting command and a 3D model of the impeller with different numbers of blades was built using the array command (Fig.15).

Fig.14.Blade profile curve.
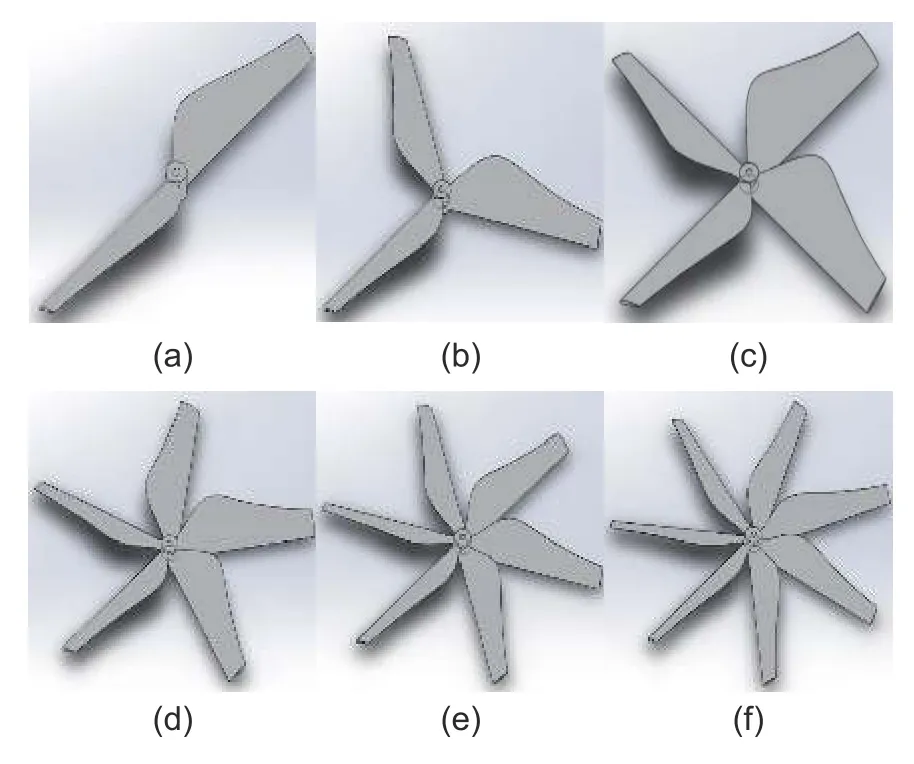
Fig.15.3D model of impeller with different numbers of blades:(a) 2 blades,(b) 3 blades,(c) 4 blades,(d) 5 blades,(e) 6 blades,and (f) 7 blades.
The blade parameters were input into MATLAB,and the projection area of the optimized blade in the upwind direction was obtained by an integral operation.The ratio of the projection area to the swept area was then calculated.The blade solidity was obtained as presented inTable 4.

Table 4:Relation between the number and size of impeller blades
The variation curve of the solidity with the number of blades is shown inFig.16.
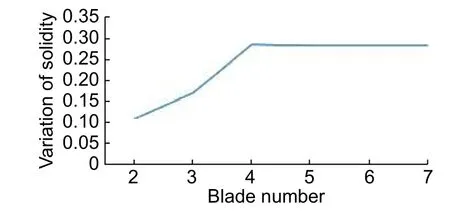
Fig.16.Variation of solidity with the number of blades.
4.Experimental Verification
The experimental instruments used included the test device of the D305 outlet duct fan performance,anemometer,small generator set,0 to 200-mA digital display ammeter,0 to 20-V digital display voltmeter,0 to 200 sliding rheostat,and conductor.The relevant devices are provided inFig.17.
A wind tunnel test bench was used to measure the starting wind speed,minimum running wind speed,and power generation under different wind speed conditions for impellers with different numbers of blades under the loads of 20 Ω,50 Ω,80 Ω,and 110 Ω,respectively.The experimental circuit diagram is presented inFig.18.
The frequency converter in the fan experimental device was used to change the incoming wind speed.The wind speed in the instantaneous state was measured by the anemometer and the load resistance was adjusted using the sliding transmission.Through these experiments,experimental data were obtained to generate the relationship curves shown inFigs.19and20.
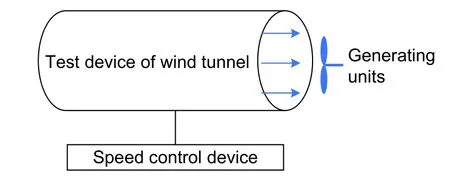
Fig.17.Experimental devices.
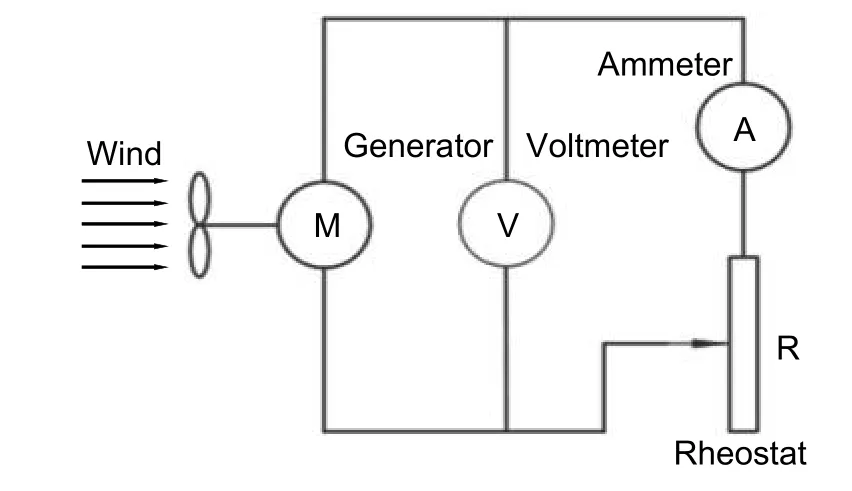
Fig.18.Experimental circuit diagram.
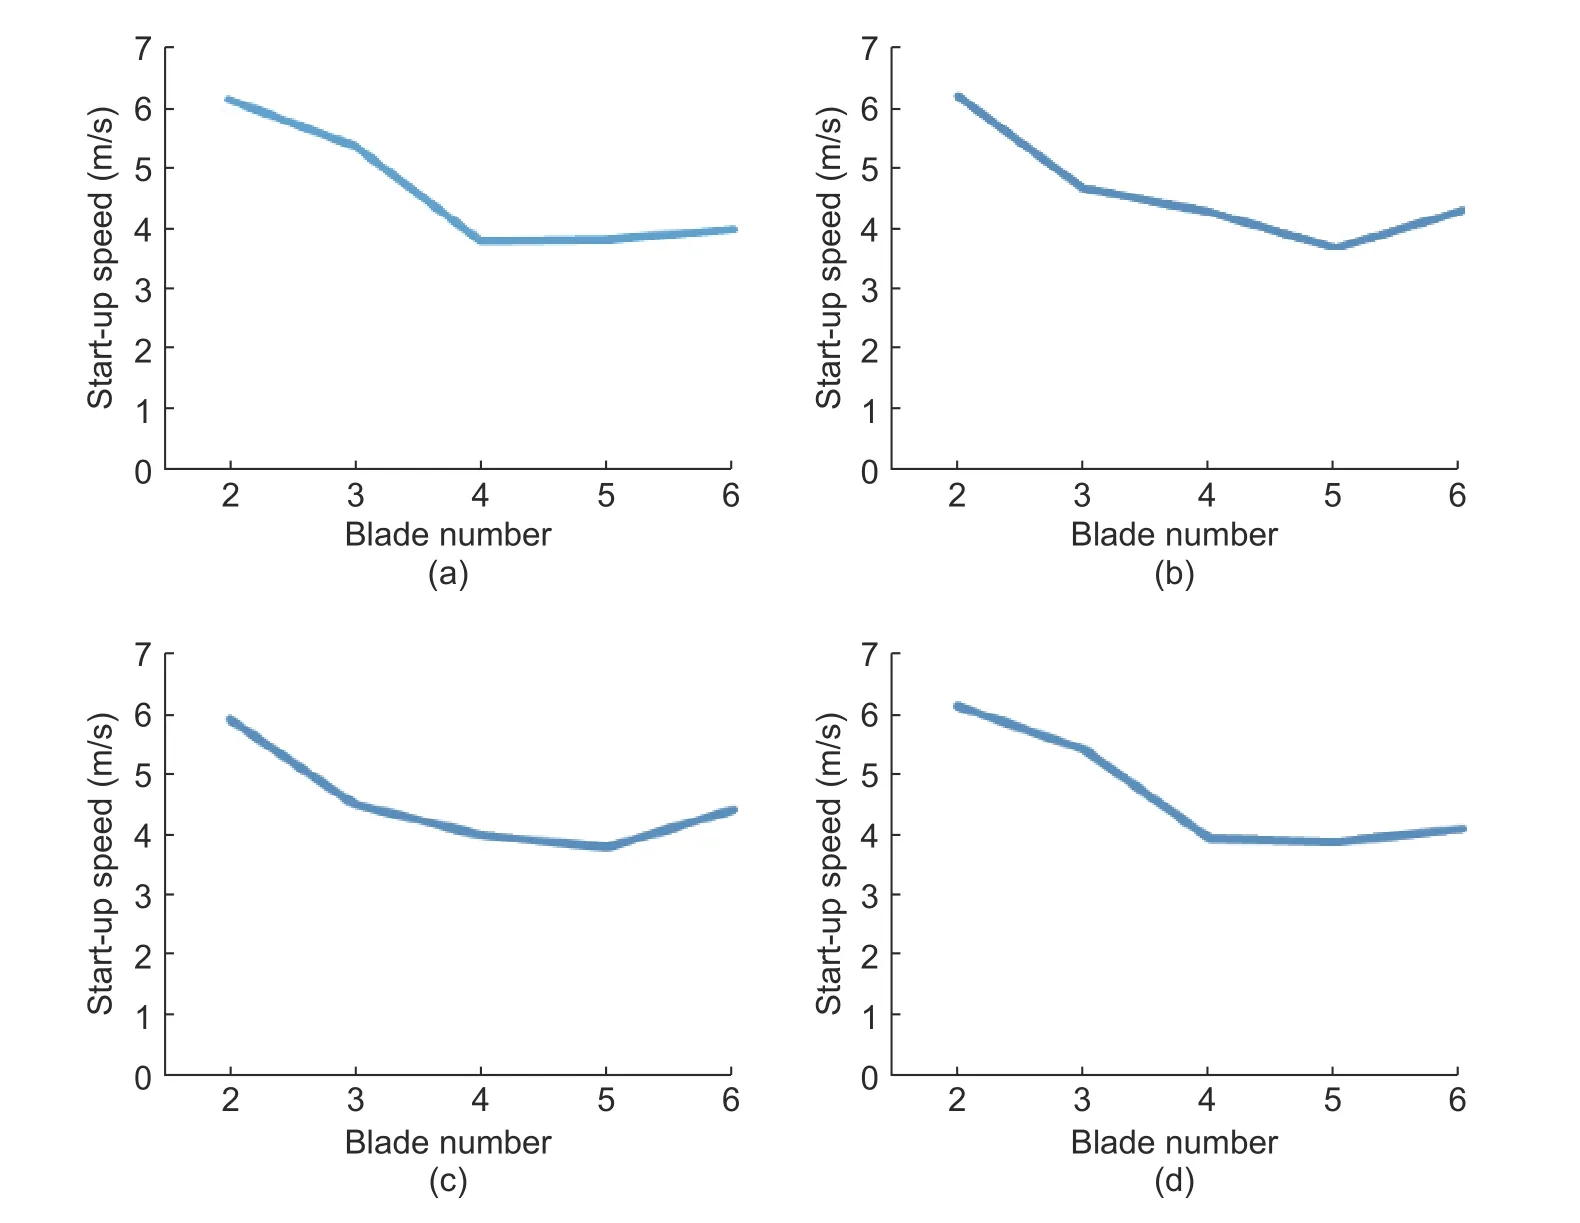
Fig.19.Start-up wind speed versus blade number under different load conditions:(a) 20-Ω load,(b) 50-Ω load,(c) 80-Ω load,and (d) 100-Ω load.
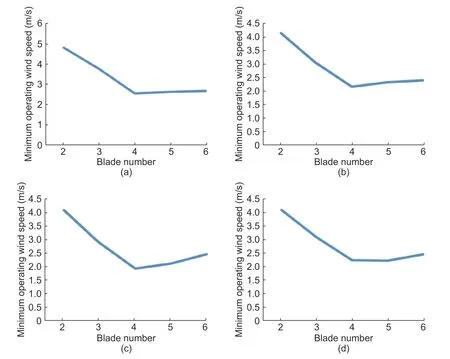
Fig.20.Minimum operating wind speed versus blade number under different load conditions:(a) 20-Ω load,(b) 50-Ω load,(c) 80-Ω load,and (d) 100-Ω load.
From the break-line diagram of the start-up wind speed and minimum operating wind speed of the power generation system,it can be observed that they both decrease at first and then increase with the increase in the number of blades.The start-up wind speed and minimum operating wind speed of the power generation system are the lowest when the number of blades is four.The generated power under different numbers of blades is presented inFig.21.
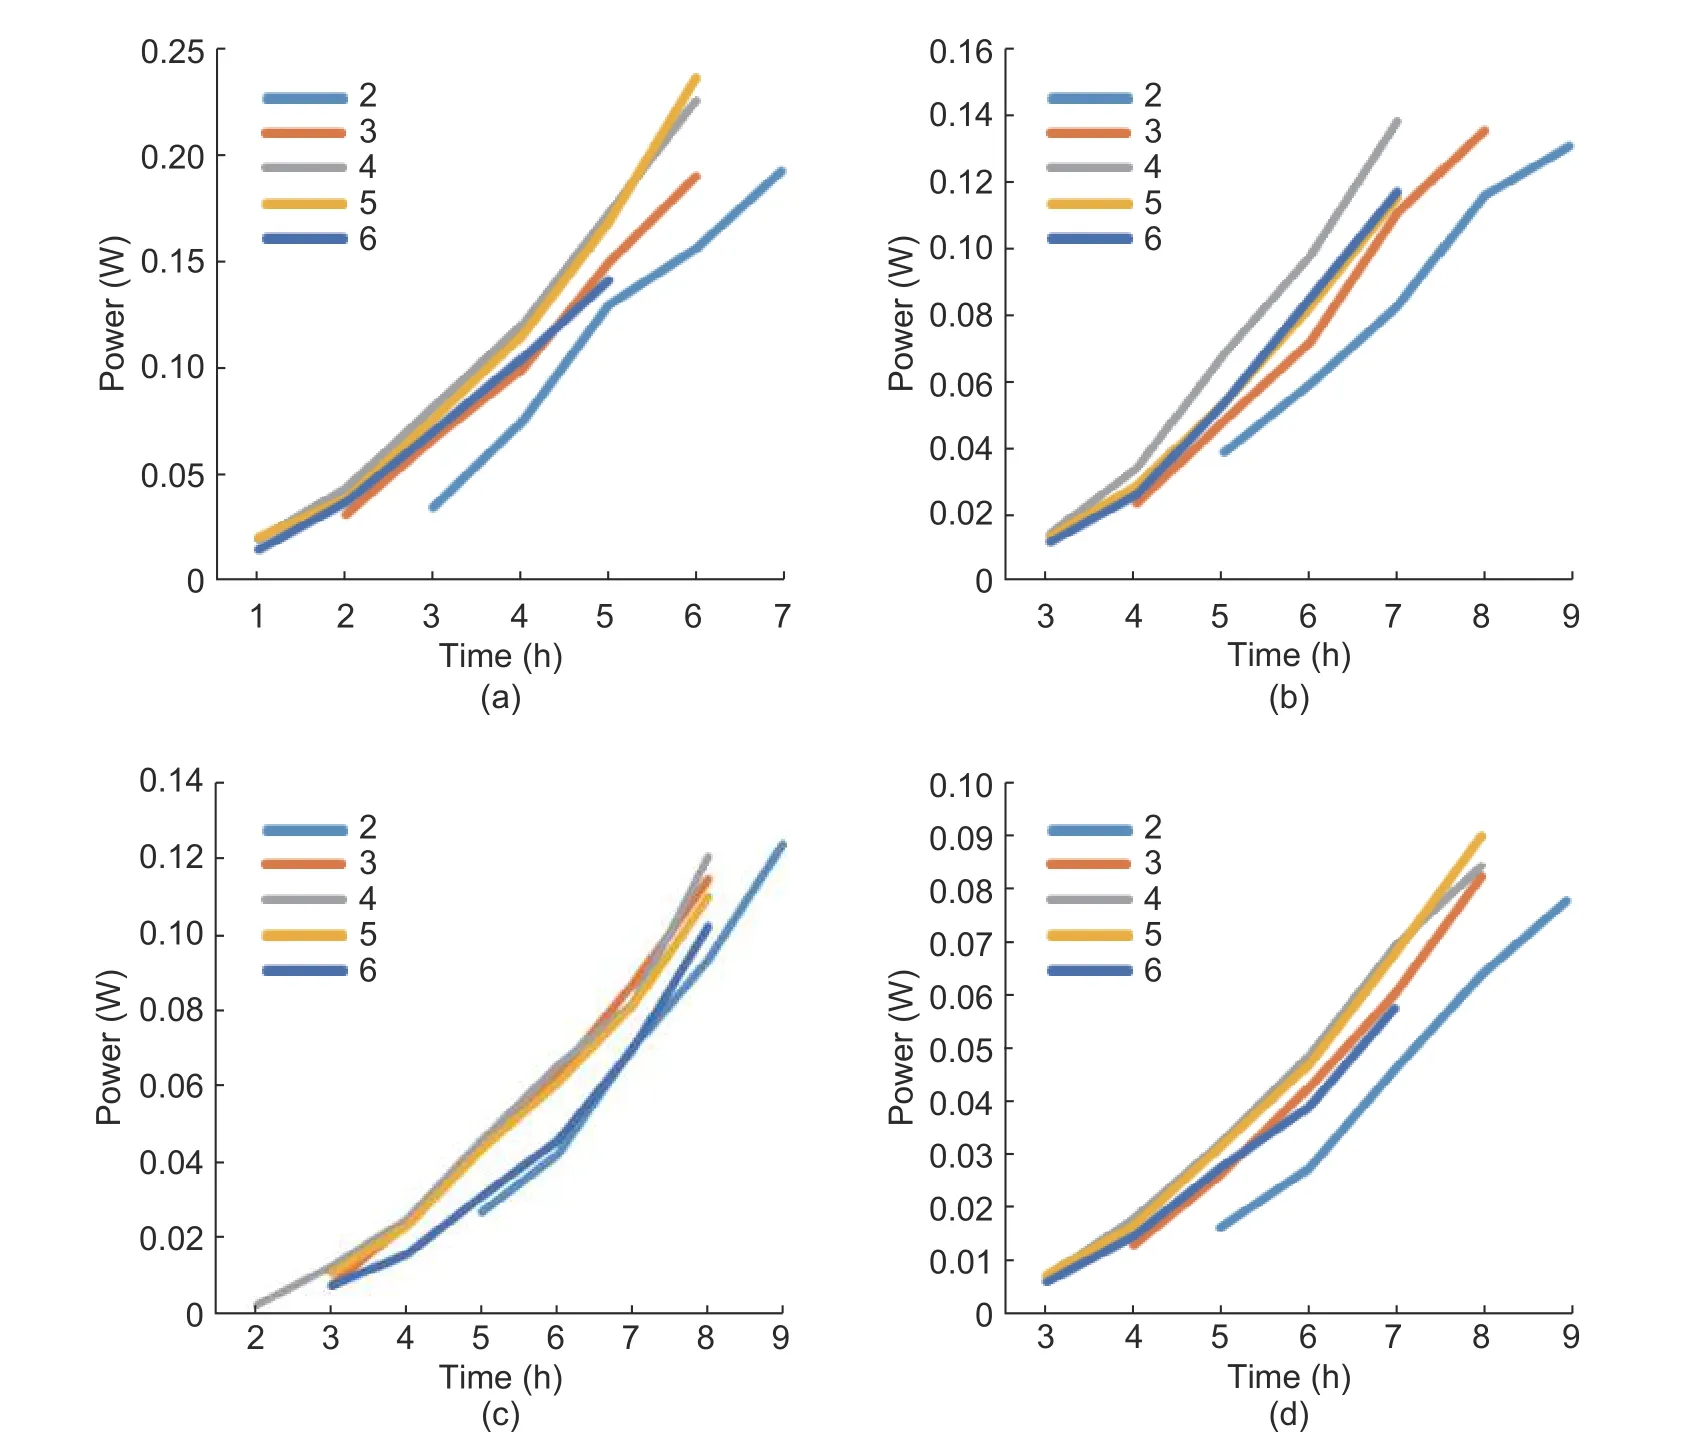
Fig.21.Curves of power generation versus blade number under different load conditions:(a) 20-Ω load,(b) 50-Ω load,(c)80-Ω load,and (d) 100-Ω load.
By observing the curves of power generation and comparing them with different numbers of blades with wind speeds,it can be inferred that the power generation of the system decreases with the increase of the resistance value.When the load resistance is different,the output power of the power generation system with three,four,and five blades is higher.
5.Conclusion
According to the calculation of the optimal blade chord length and the selection of the optimal tip speed ratio,the chord length of the impeller with different numbers of blades was calculated.Considering the installation problem,the chord length of the blade root was optimized,and the chord length of the blade both before and after optimization was obtained.While calculating the chord length of the blade under the optimal design condition,the solid degree of the impeller firstly increased and then decreased with the increase in the number of blades.When the number of blades was four,the solid degree of the impeller was the largest.Therefore,the higher the solid degree of the impeller,the lower the start-up speed is,and the smaller the required minimum wind speed to maintain the operation is.With the increase in the resistance,the output power of the power generation system decreased at the same wind speed.That is,the greater the load resistance,the lower the power generation efficiency of the power generation system is.When the number of impeller blades is four and the solid degree of impeller is 0.2862,the output power of the power generation system under different loads is higher.
Disclosures
The authors declare no conflicts of interest.
杂志排行
Journal of Electronic Science and Technology的其它文章
- lmpact of Fiber Dispersion on Performance of Entanglement-Based Dispersive Optics Quantum Key Distribution
- Effects of Material and Dimension on TCF,Frequency,and Q of Radial Contour Mode AlN-on-Si MEMS Resonators
- Large-Capacity and High-Speed lnstruction Cache Based on Divide-by-2 Memory Banks
- Effect of Wall Thicknesses on Broadband Design of Ka-Band TE21-Mode Coupler
- Device-Free Through-the-Wall Activity Recognition Using Bi-Directional Long Short-Term Memory and WiFi Channel State lnformation
- Balanced Functional Maps for Three-Dimensional Non-Rigid Shape Registration
