Mitogenomic Conservation Genetics of the Critically Endangered Liaoning Clawed Salamander
2021-12-30YuZHOUBoyangYUJichuanZHAOFangWANGZhenweiWANGBingjunDONGandBaotianYANG
Yu ZHOU ,Boyang YU ,Jichuan ZHAO ,Fang WANG ,Zhenwei WANG ,Bingjun DONG* and Baotian YANG*
1 College of Life Sciences,Shenyang Normal University,Shenyang 110000,Liaoning,China
2 Liaoning Academy of Forest Science,Shenyang 110000,Liaoning,China
3 Pest Control and Quarantine Station,Forestry and Grassland Administration of Liaoyang City,Liaoyang 110000,Liaoning,China
4 Natural Resources Service Center of Anshan City,Anshan 114000,Liaoning,China
Abstract The Liaoning clawed salamander (Onychodactylus zhaoermii) is an endemic and critically endangered amphibian species of China.To study the population genetics of natural populations of this species,32 samples were collected from six different locations,and the mitochondrial genome was sequenced.Population genetic analyses showed that the Liaoning clawed salamander is composed of only one radialized cluster with ultralow nucleotide diversity.Late Pleistocene climate cooling (~100 to~30 kya) may have reduced the effective population size of the Liaoning clawed salamander,and the subsequent temperature increase (~25 kya to present) provided the opportunity for population expansion.Because of heat sensitivity,the maximum temperature of the prebreeding period,especially from March to May,is very important for the surface environment living in the Liaoning clawed salamander.Three suitable regions were predicted by the MaxEnt model,and the largest suitable region(approximately 899 km2) was at the four-county boundary area and was larger than the present ‘Natural Conservation Community of the Liaoning Clawed Salamander’.To ensure more effective protection of all Liaoning clawed salamanders,we suggest extending the current ‘Natural Conservation Community of the Liaoning Clawed Salamander’ to include the four-county boundary area.
Keywords Onychodactylus zhaoermii,population genetics,highthroughput sequencing,historical demography,maxent model
1.Introduction
Clawed salamanders of the genusOnychodactylus
are a group of hynobiid salamanders endemic to Northeast Asia,several Japanese islands,some mountains on the Korean Peninsula and adjacent areas in China and Russia (Frost,2021).This genus represents the most specialized stream-dwelling form among all Hynobiidae (Kuzmin,1995) and differs from other hynobiids in the absence of lungs and the presence of horny claws in larvae and adults (Dunn,1923).Clawed salamanders are mysterious because they are found only in the sources of cold,clean,permanent mountain streams (Poyarkovet al.
,2012)and brooks in caves (Park,2005) far from human settlements,and their behaviour of hiding by day and coming out at night makes them elusive.Clawed salamanders inhabiting mountainous areas ranging from 300 to 2700 a.s.l.under clean shallow streams with water not higher than 10 °C throughout the year (Poyarkovet al
.,2012).Ten species of the group have been described (Frost,2021).The Liaoning clawed salamander is one of only two endemic clawed salamanders in China.The other species is the Jilin clawed salamander (O.zhangyapingi
).The clarified distribution of the Liaoning clawed salamander is very limited and has been reported to include only the environs of Huashan village,Xiuyan County,Liaoning Province (Li,2004;Poyarkovet al.
,2012).Adult Liaoning salamanders are active from April to May (Li,2004).Males and females are in a reproductive state in early May,and the breeding season may last from the middle of April when the water temperature rises above 6 ℃ until at least late May (Poyarkovet al.
,2012).Hibernation begins in late September to early October and lasts until early April (Li,2004).The Liaoning clawed salamander is endangered due to its limited distribution,habitat destruction,and perhaps pet trade(Li,2004;Poyarkovet al.
,2012).In China,the Liaoning clawed salamander was listed as a critically endangered species on the Redlist of China’s Biodiversity (Jianget al.
,2016) and levelone protection to the list of state-protected wildlife released by the National Forestry and Grassland Administration and the Ministry of Agriculture and Rural Affairs.Although Poyarkovet al.
(2012) has suggested listing the Liaoning clawed salamander as vulnerable in the IUCN red list,the IUCN red list still does not list this species,which is the reason we guss lacks clear information on the species,such as distribution,population and genetic diversity.The goal of conservation genetics is to preserve genetic diversity and evolutionary processes (Avise,1994).To perform conservation planning at the intraspecific level,molecular genetic techniques can provide appropriate tools with which to evaluate processes and to develop management strategies(Smith and Wayne,1996).However,population genetic studies of the Liaoning clawed salamander have not been reported.The distribution area of Liaoning clawed salamander confirmed by previous studies includes only a few local mountain streams in the environs of Huashan village.After many surveys,we found four new distribution locations,namely,three in Liaoyang County and one in Benxi County.In this study,we collected 32 samples of the species from six different locations,including four new locations for the species.The mitochondrial genomes of all 32 individuals were sequenced for population genetic and historical demographic analyses.A MaxEnt model was used to predict suitable regions for the Liaoning clawed salamander.Then,conservation suggestions were provided based on these conservation genetic analyses.
2.Material and Methods
2.1.Sampling,laboratory procedures and sequencing
Thirty-two samples were collected for our study (Table S1 and Figure 1).Animals were treated in accordance with the guidelines of the Ethics Committee of the College of Life Sciences,Shenyang Normal University,which approved this study.For each sample,only back toe tip (~1 mm) tissues were collected and stored,and the individuals were released immediately after treating wounds with antiseptic agents.Toe tips were immediately preserved in 95% ethanol at −20℃.Total genomic DNA was extracted from ethanol-preserved tissues using the TIANcombi DNA Lyse&Det PCR Kit (Beijing,China).Each mitochondrial genome of the 32 Liaoning clawed salamanders was amplified by two long-PCRs (for information on the custom designed long-PCR primers,see Figure S1).TaKaRa LA Taq (Takara Inc.,Dalian,China) was used for long-PCR,and thermal cycling was performed according to its instructions.The barcode linkers were obtained by annealing two oligos (for the oligo sequences,see Table S2).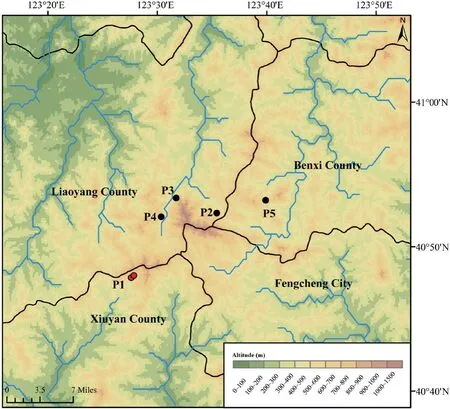
Figure 1 Sampling sites distribution.Red dots (P1) represent the previously known sampling sites in Xiuyan County,and black dots (P2−P5) represent our newfound distribution areas in Liaoyang and Benxi Counties.The black lines indicate county boundaries,and the blue lines indicate the streams and rivers.
A total of 10 µg of the final pooled DNA was sent to Sangon Biotech (Shanghai,China) for Illumina HiSeq sequencing.The sequencing library was sequenced on an Illumina HiSeq 2500 sequencer.Approximately 8 GB of Illumina HiSeq paired-end 150-bp clean reads (filtering low-quality data) were obtained.
2.2.Read sorting and assembly
Sequence IDs of individualspecific paired-end reads were sorted bioinformatically with a custom Python script modified from Fenget al.
(2016).Then,the paired-end reads were extracted by BBMap (Bushnell,2014) based on the individual-specific sequence ID.Barcode linkers were removed by Cutadapt v1.8.2 (Martin,2011).Sorted paired-end reads of each individual were first aligned with the Liaoning clawed salamander reference mitochondrial genome(GenBank No.NC026854) by TopHat2 (Kimet al.
,2013) with default parameters,which yielded a coordinate-sorted bam file.Then,the mitochondrial genome of each individual was assembled by the bam file using TRINITY (Grabherret al.
,2011).Raw read data have been submitted to the NCBI Sequence Read Archive (SRA) repository (accession PRJNA701794).2.3.Sequence analyses
Thirty-two newly sequenced mitochondrial genomes were annotated using MITOS under the mitochondrial code for vertebrate mitochondria (Berntet al
.,2013) and subsequently curated manually.Nucleotide sequences were edited using MEGA version 4.0 (Kumaret al
.,2016) and aligned using MAFFT version 5.0 (Katohet al
.,2005) with default parameters.The alignments were further refined usingGBLOCKS v0.91b (Castresana,2000) with the ‘with half’ option and other default settings.Haplotypes of the mitochondrial genome sequences were inferred using the PHASE algorithm implemented in DnaSP software version 6.12.03 (Rozaset al
.,2017),and the same program was used to calculate values of genetic diversity in each population and in all samples.2.4.Population structure and network analyses
Two approaches were used to infer the population structure of the Liaoning clawed salamander.First,population structure was measured using STRUCTURE v.2.3.4 (Pritchardet al
.,2000).These analyses were used to determine the optimal number of genetic clusters (K) and to assign individuals to these genetic clusters.We performed five independent runs where K=1–10,each with a burn-in period of 100,000 and one million Markov chain Monte Carlo (MCMC) repetitions,and used STRUCTURE HARVESTER (Earl and vonHoldt,2011) to implement the delta K method (Evannoet al
.,2005)to determine the optimal K.Second,an analysis of molecular variance (AMOVA) (Excoffieret al
.,1992) was performed to test for population structure in Arlequin ver.3.5.2.2 (Excoffier and Lischer,2010),with significance assessed by 10 000 permutations.The five populations (P1–P5,Table S1) were grouped into three groups:the Xiuyan group was composed of two closely adjacent locations with P1,the Liaoyang group with P2–4,and the Benxi group with P5 under Arlequin analyses.NETWORK version 10 (Bandeltet al
.,1999) was employed to build a median-joining network (MJN) for the mitochondrial genomes.After generating the initial MJN,the MP option was chosen to remove excessive links and median vectors (Polzin and Daneshmand,2003).2.5.Historical demography
The demographic history of each population and all samples of the Liaoning clawed salamander were determined by means of neutrality tests and mismatch distributions in Arlequin.To test whether the populations evolved under neutrality,Fu’s Fs test (Fu,1997) and Tajima’s D (Tajima,1989) were applied,and mismatch distributions(Harpending,1994) were constructed using the sudden expansion model of Schneider and Excoffier (1999) with 10,000 bootstrap replicates.The validity of the sudden expansion assumption was determined using sum of squares differences(SSDs) and Harpending’s raggedness index (Harpending,1994),both of which are higher in stable,nonexpanding populations(Rogers and Harpending,1992).To estimate the change in effective population size over time and the time to the most recent common ancestor (tMRCA)of Liaoning clawed salamander,Bayesian skyline plot (BSP)analysis (Drummondet al
.,2005) was performed as implemented in Beast 1.8.3 (Drummondet al
.,2012).Three normally distributed Nodes that Root age,110.7 (95% CI:106.4,114.9);Between Hynobius and Batrachuperus,52.5 (95% CI:50,54.9);Ancestor of Ranodon,Hynobius and Batrachuperus,52.5 (95% CI:59.7,65.5)referred to by Zhanget al
.(2006) were used for calibration.Three mt-genome sequences,NC012430 of Batrachuperus yenyuanensis,NC045210 of Hynobius unisacculus and AJ419960 of Ranodon sibiricus,are available for thirty species from GenBank.Preliminary analyses with 2−15 groups were carried out to verify the influence of the number of groups on the posterior estimates.The increase in the number of groups did not change the results after nine groups,and we therefore selected a nine-group setting in the final analysis to avoid overparameterizing the model.Two independent analyses were performed with all mitochondrial genome sequences available for each individual.In both cases,we used the HKY+I+G substitution model as suggested by the Akaike information criterion (AIC) (Akaike,1974) in jModelTest (Posada,2008).The analysis was run using a piecewise constant BSP under a strict clock model.We ran MCMC with 10steps,sampling every 4000 steps.The results of each run were visualized using TRACER 1.7 (Rambautet al
.,2018) to ensure that stationarity and convergence had been reached and that the effective sample size (ESS) was higher than 200.2.6.Species distribution modelling
The maximum entropy model implemented in MaxEnt version 3.3.3k (Phillipset al
.,2006;Phillips and Dudı´k,2008) was used to predict the geographic space of the Liaoning clawed salamander.The 19 standard WorldClim bioclimatic variables,including monthly minimum,mean,and maximum temperature,precipitation,solar radiation,wind speed,water vapour pressure,and precipitation data and Shuttle Radar Topography Mission(SRTM) elevation data (Table S3),were downloaded from the WorldClim 2 database (Fick and Hijmans,2017) with a grid cell resolution of 30 arc-seconds as predictors for the environmental niche models.3.Results
3.1.Sequence information and genetic diversity
All individuals had target depths above 440× (Table S4).For each individual,the paired-end reads were subsequently assembled into 2−5 contigs by TRINITY,and the vast majority of the mitochondrial genome was assembled successfully,except for the tandem duplication areas with tandem repeat sequences with motif ‘tttaaaaata’ in the D-loop region.Mitochondrial heterogeneity was found in the assembled contigs of all Liaoning clawed salamander individuals.Four heterogeneous positions were found in the 12S rRNA gene,and one such position was found in the D-loop region (Table S5 and Figure S2).The two most common heterogeneous positions were in the 12S rRNA gene (position ②,detected in 90% of thesamples) and the D-loop region (position ⑤,detected in 90% of the samples).For the heterogeneous positions in each individual,we used the most common nucleotide among all 32 individuals in the following population genetic analyses.
The aligned mitochondrial genome dataset forO.zhaoermii
(16 453 bp) yielded 25 haplotypes among 32 sequences.The nucleotide diversity of each sampling location and all samples showed very low values (Table 1).The lowest nucleotide diversity was 0.00006;in P2,the highest nucleotide diversity was 0.00025;and in P1,the nucleotide diversity of all samples was 0.00019.3.2.Genetic structure and network
In the AMOVA (Table S6),within-population diversity accounted for 91.73% of the overall variation,with a significantP
value (0.027).This variation was much larger than that observed among groups(5.31%) and among populations within groups (2.97%).The Bayesian analysis of the structure is displayed in Figure 2.L(K) (the probability of the data given K and the model)and ΔK (using the method of Evannoet al
.,2005) exhibited the largest values when K=2.Thus,K=2 was the most likely number of genetic clusters within the whole data set.The bar plot for K=2 under Bayesian clustering (Figure 2C)showed that the two clusters (K=2) were not related to any combination of the five populations (P1−P5) that we defined.The triangle plot for K=2 (Figure 2D) showed that the 32 individuals in our study were dispersed rather than obviously distributed in two clusters.The statistical parsimony network showed the relationships between mitochondrial genome haplotypes (Figure 3).All the haplotypes were radially connected into a single network with core haplotype H13.
3.3.Historical demography
The neutrality test values of each sampling location were negative (except Tajima’s D for P5) but not significant (except Fu’s Fs for P1),implying recent demographic expansion in these locations but not significant(Table 1).The neutrality test values of all samples were negative and significant,confirming that the whole Liaoning clawed salamanders has undergone recent expansions.In the mismatch distribution,sudden demographic expansion (SSD and Hri values) was not rejected for most sampling locations (except P5)or the whole sample.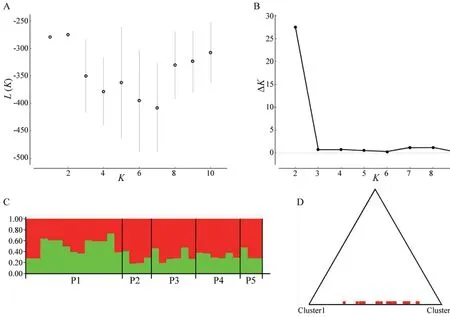
Figure 2 Structure analysis using the admixture model.(A) and (B)show the mean estimated L(K) and ΔK values as a function of the number of clusters (K);(C) is the bar plot for K=2;(D) is the triangle plot for K=2.
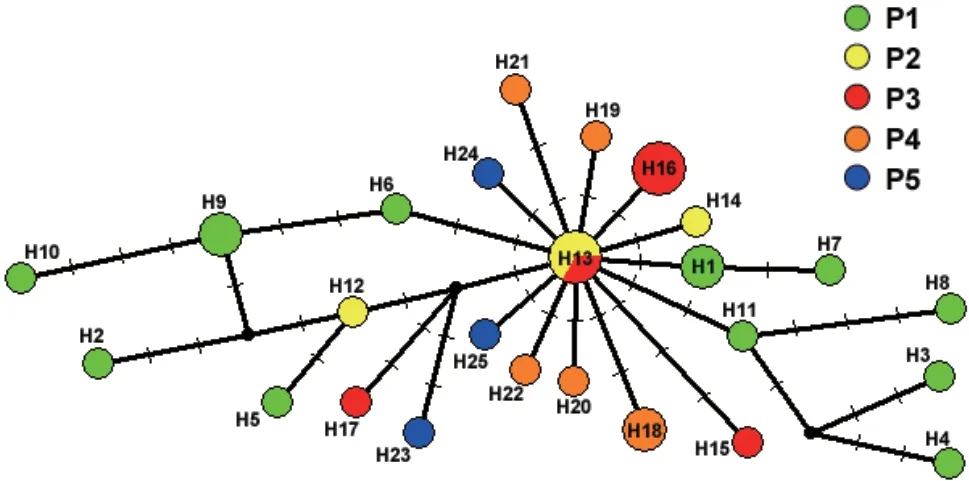
Figure 3 The median-joining network of mitochondrial genomes of the Liaoning clawed salamander.
The BSP suggested that the effective population size of the Liaoning clawed salamander decreased approximately 100–30 thousand years ago (kya) and then slowly began to increase approximately 25 kya to the present (Figure 4).
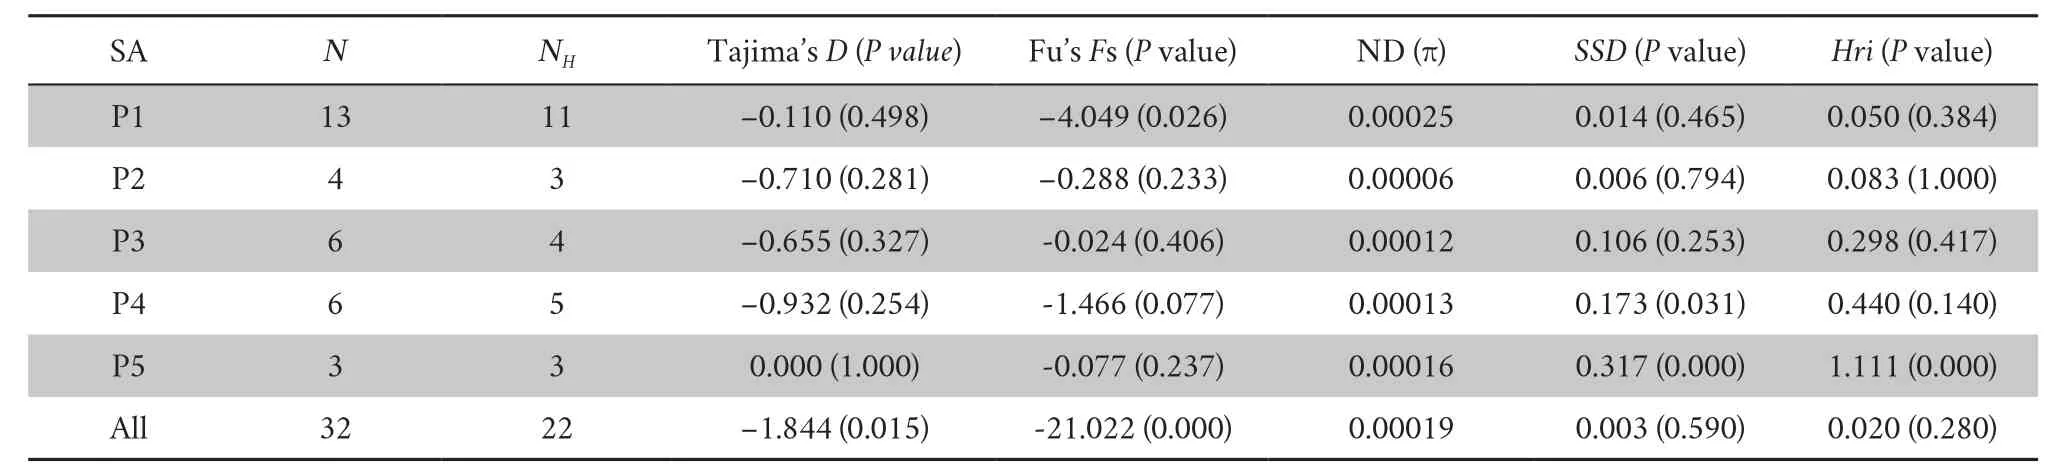
Table 1 Summary statistics of the demographic analysis of Onychodactylus zhaoermii.
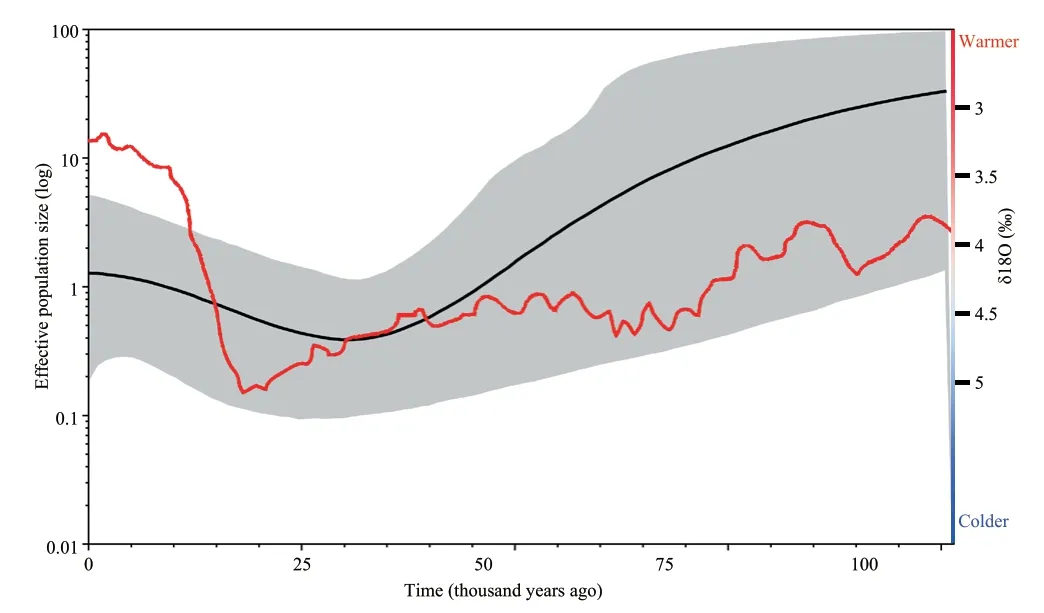
Figure 4 Bayesian skyline plot showing historical demographic trends of the Liaoning clawed salamander.The X-axis shows the time before present in years,and the time goes backwards from left to right.The Y-axis shows the effective population size on a log scale.Solid black lines represent mean estimates,and grey shaded areas represent 95% confidence intervals.The red line represents the marine oxygen isotope curve for the last 100 000 years,adapted from Lisiecki and Raymo (2005).
3.4.Model performance and contribution of environmental variables
For the Liaoning clawed salamander model developed based on all environmental variables,the average area under the receiver operating characteristic (ROC) curve(AUC) for the replicate runs was 0.998,and the standard deviation was 0.001 (Figure S3),which indicated that the model performance was excellent.The jackknife test showed that the maximum temperatures in March to June (tmax03−06) were the four main variables among all 104 environmental variables,and tmax05 had the greatest gain (Figure S4).The tmax05 variable also made the greatest contribution to the model (42%)(Table S7).The second greatest contribution to the model was made by tmax03 (20.4%).3.5.Predicted current potential distribution
The current potential distribution of the Liaoning clawed salamander based on observed occurrences and environmental conditions projected by the MaxEnt model is shown in Figure S5 and Figure 5.Under current climate conditions,the three areas (SR1−SR3) within both the moderately and highly suitable regions of the Liaoning clawed salamander ranged from 40.52°−41.18° N and 123.37°−124.00° E and were distributed continuously from south to north (Figure 5).Suitable regions SR1−SR3 covered areas of 828.99 km,523.53 km,and 85.72 km,respectively.SR1 was the region containing all sampling locations in this study,and SR2 and SR3 were suitable regions predicted by the MaxEnt model that have never been investigated.4.Discussion
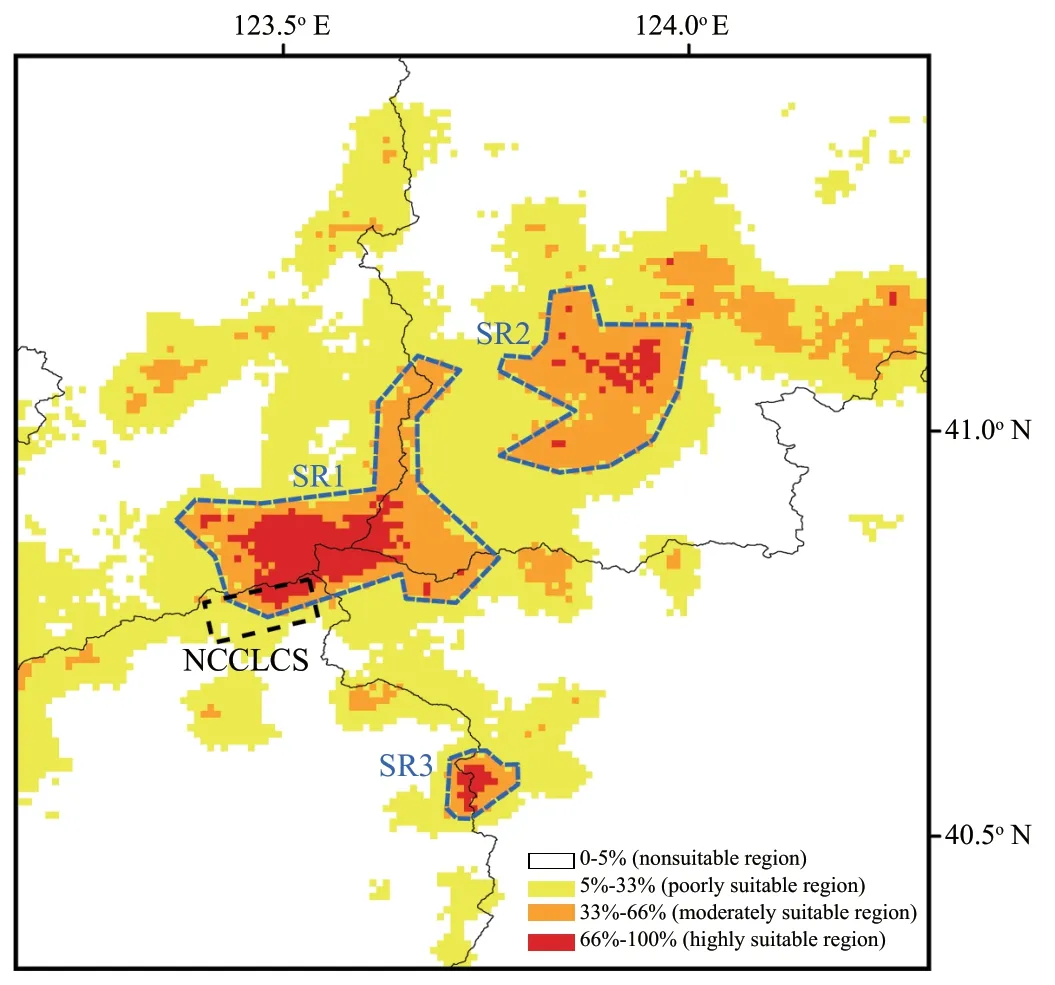
Figure 5 Predicted distribution of the Liaoning clawed salamander.The black lines indicate county boundaries;the grey dotted line indicates the Natural Conservation Community of the Liaoning Clawed Salamander(NCCLCS);the black dotted line indicates the habitat area of the NCCLCS;and the blue dotted lines (SR1,SR2 and SR3) indicate the three possible distribution areas (areas with both moderately and highly suitable regions) of the Liaoning clawed salamander predicted by Maxent modelling.
4.1.Single population structure of Liaoning clawed salamanders
As one of the main components of conservation genetics,population structure analyses focus on assessing the genetic variation and genetic diversity caused by genetic variation between populations of endangered species(Hedrick and Miller,1992;O’Brien,1994).For Liaoning clawed salamanders,no different evolutionarily significant units or even significantly different clusters were found by network analysis.All the haplotypes were radially connected into a single network (Figure 3),and the haplotypes of different radiation branches were uncorrelated with sampling location.AMOVAs revealed that a significant amount (91.73%) of the overall variation occurred within populations (Table S6),and the structure analyses showed a dispersed distribution of all samples rather than two significant clusters in the triangle plot(Figure 2D).Both findings confirm that there is only one cluster of Liaoning clawed salamanders.
4.3.Environmental variables and suitable regions
The choice of environmental variables affects the prediction results of ecological niche modelling (Chenet al
.,2012).tmax03−06 were the four main variables according to the jackknife test,and tmax05 and tmax03 made the greatest contributions (summing to 79.1%) to the model.These results imply that the maximum temperature in approximately May is very important for the Liaoning clawed salamander.Clawed salamanders are sensitive to the temperature of the water they live in.The Liaoning clawed salamanders live in sources of cold,clean,permanent mountain streams with water temperatures that range from 6 °C to 14 °C (Poyarkovet al.
,2012).In the middle and lower streams,where the water temperature slightly increases,Liaoning clawed salamanders were rarely found during our long-term investigation.Our several years of observation also showed that the Liaoning clawed salamander begins to appear in the early-middle of April and appears in large numbers in early to middle May.In early May,we often found adult female Liaoning clawed salamanders containing visual eggs through the abdomen,indicating that they were approaching the breeding stage,in agreement with Poyarkovet al
.(2012).The Liaoning clawed salamander is rarely found after June.Therefore,our observation was consistent with the results of the environmental variable analyses:May is the most concentrated period for Liaoning clawed salamanders living in the surface environment.The May maximum temperature contributes most to the Liaoning clawed salamander occurrence but not the May minimum or average temperature,which we hypothesize is related to the heat sensitivity of the Liaoning clawed salamander.May is the main month in the prebreeding period of Liaoning clawed salamanders living in the surface environment.They can adapt to the maximum temperature of May in the current habitat but not to hotter temperatures.This explains why the gain of maximum temperature variables slowly increased from tmax03−05 but rapidly decreased after tmax06 (Figure S4).Three suitable regions (SR1−SR3) with a total area of 1438.24 kmwere predicted by the MaxEnt model (Figure 5).SR1 is the largest suitable region and contains all sampling locations used in this study.In 2012,the local governments established the nearly 100 hm‘Natural Conservation Community of the Liaoning Clawed Salamander (NCCLCS)’ in Xiuyan County,Liaoning Province (Figure 5) (Han,2015).The current NCCLCS is only a small part of the SR1 region.Therefore,the four newly found sampling locations are not included within the current NCCLCS.Determining whether Liaoning clawed salamanders are truly distributed in SR2 and SR3 requires further investigation.
4.4.Conservation suggestions
Although our historical demographic analyses showed that the effective population size of the Liaoning clawed salamander underwent a recent expansion,the limited distribution area and the ultralow nucleotide diversity (only 0.00019 of all samples) confirm that it is truly a critically endangered species,which corresponds with the Redlist of China’s Biodiversity (Jianget al.
,2016).Li (2004)reported that Liaoning clawed salamander was a significant threat to habitat destruction due to intensive logging,farming activity with the application of herbicides,water pollution and building construction.Our annual survey of Liaoning clawed salamander in Xiuyan County from 2011 to 2020 also found that its quantity declined year by year,especially in adults.In the four locations (P2−P5) we newly found,the habitats are also unoptimistic due to water pollution and farming activity.What more worries us is that we still do not find adults of the Liaoning clawed salamander in locations P3 and P5.In view of the local senior of locations P1−P4,we know that the Liaoning clawed salamander was widely distributed in local mountain streams in the past two years.However,it is rarely seen now.The Liaoning clawed salamander has been listed as a critically endangered species on the Redlist of China’s Biodiversity (Jianget al.
,2016) and level-one protection to thelist of state-protected wildlife by the Chinese government.However,the species is currently not included on the IUCN Red List of Threatened Species.Poyarkovet al
.(2012) suggested that the conservation status of Liaoning clawed salamander on the IUCN red list is vulnerable (Vu2a) according to IUCN criteria.Based on our study results of ultralow nucleotide diversity,limited distribution area,and continuing decline in quantity,we suggest that its IUCN Red List conservation status should be endangered according to the IUCN criteria.The two genetic structure analyses of comprehensively sampled Liaoning clawed salamanders (Table S6 and Figure 2)revealed that they formed one cluster.The irregular network of haplotypes from different locations (Figure 3) suggests that the different locations of the Liaoning clawed salamander should be conserved as one unit.The current NCCLCS is located only in Huashan village of Xiuyan County,with a total area of approximately 100 hm,which is only a small part of SR1.SR1 is located at the junction of four counties (Xiuyan County,Liaoyang County,Benxi County,and Fengcheng City),with a total area of approximately 829 hm.We suggest extending the NCCLCS to include all of the SR1 region.
Acknowledgements This study was supported financially by the Research Fund for the Educational Commission of Liaoning Province of China (LQN201904 and LJC201901),the Doctoral Program of Shenyang Normal University (Grant No.BS201821),and the Natural Science Foundation of Liaoning Province of China (2020-BS-148 and 2021-MS-241).
Appendix
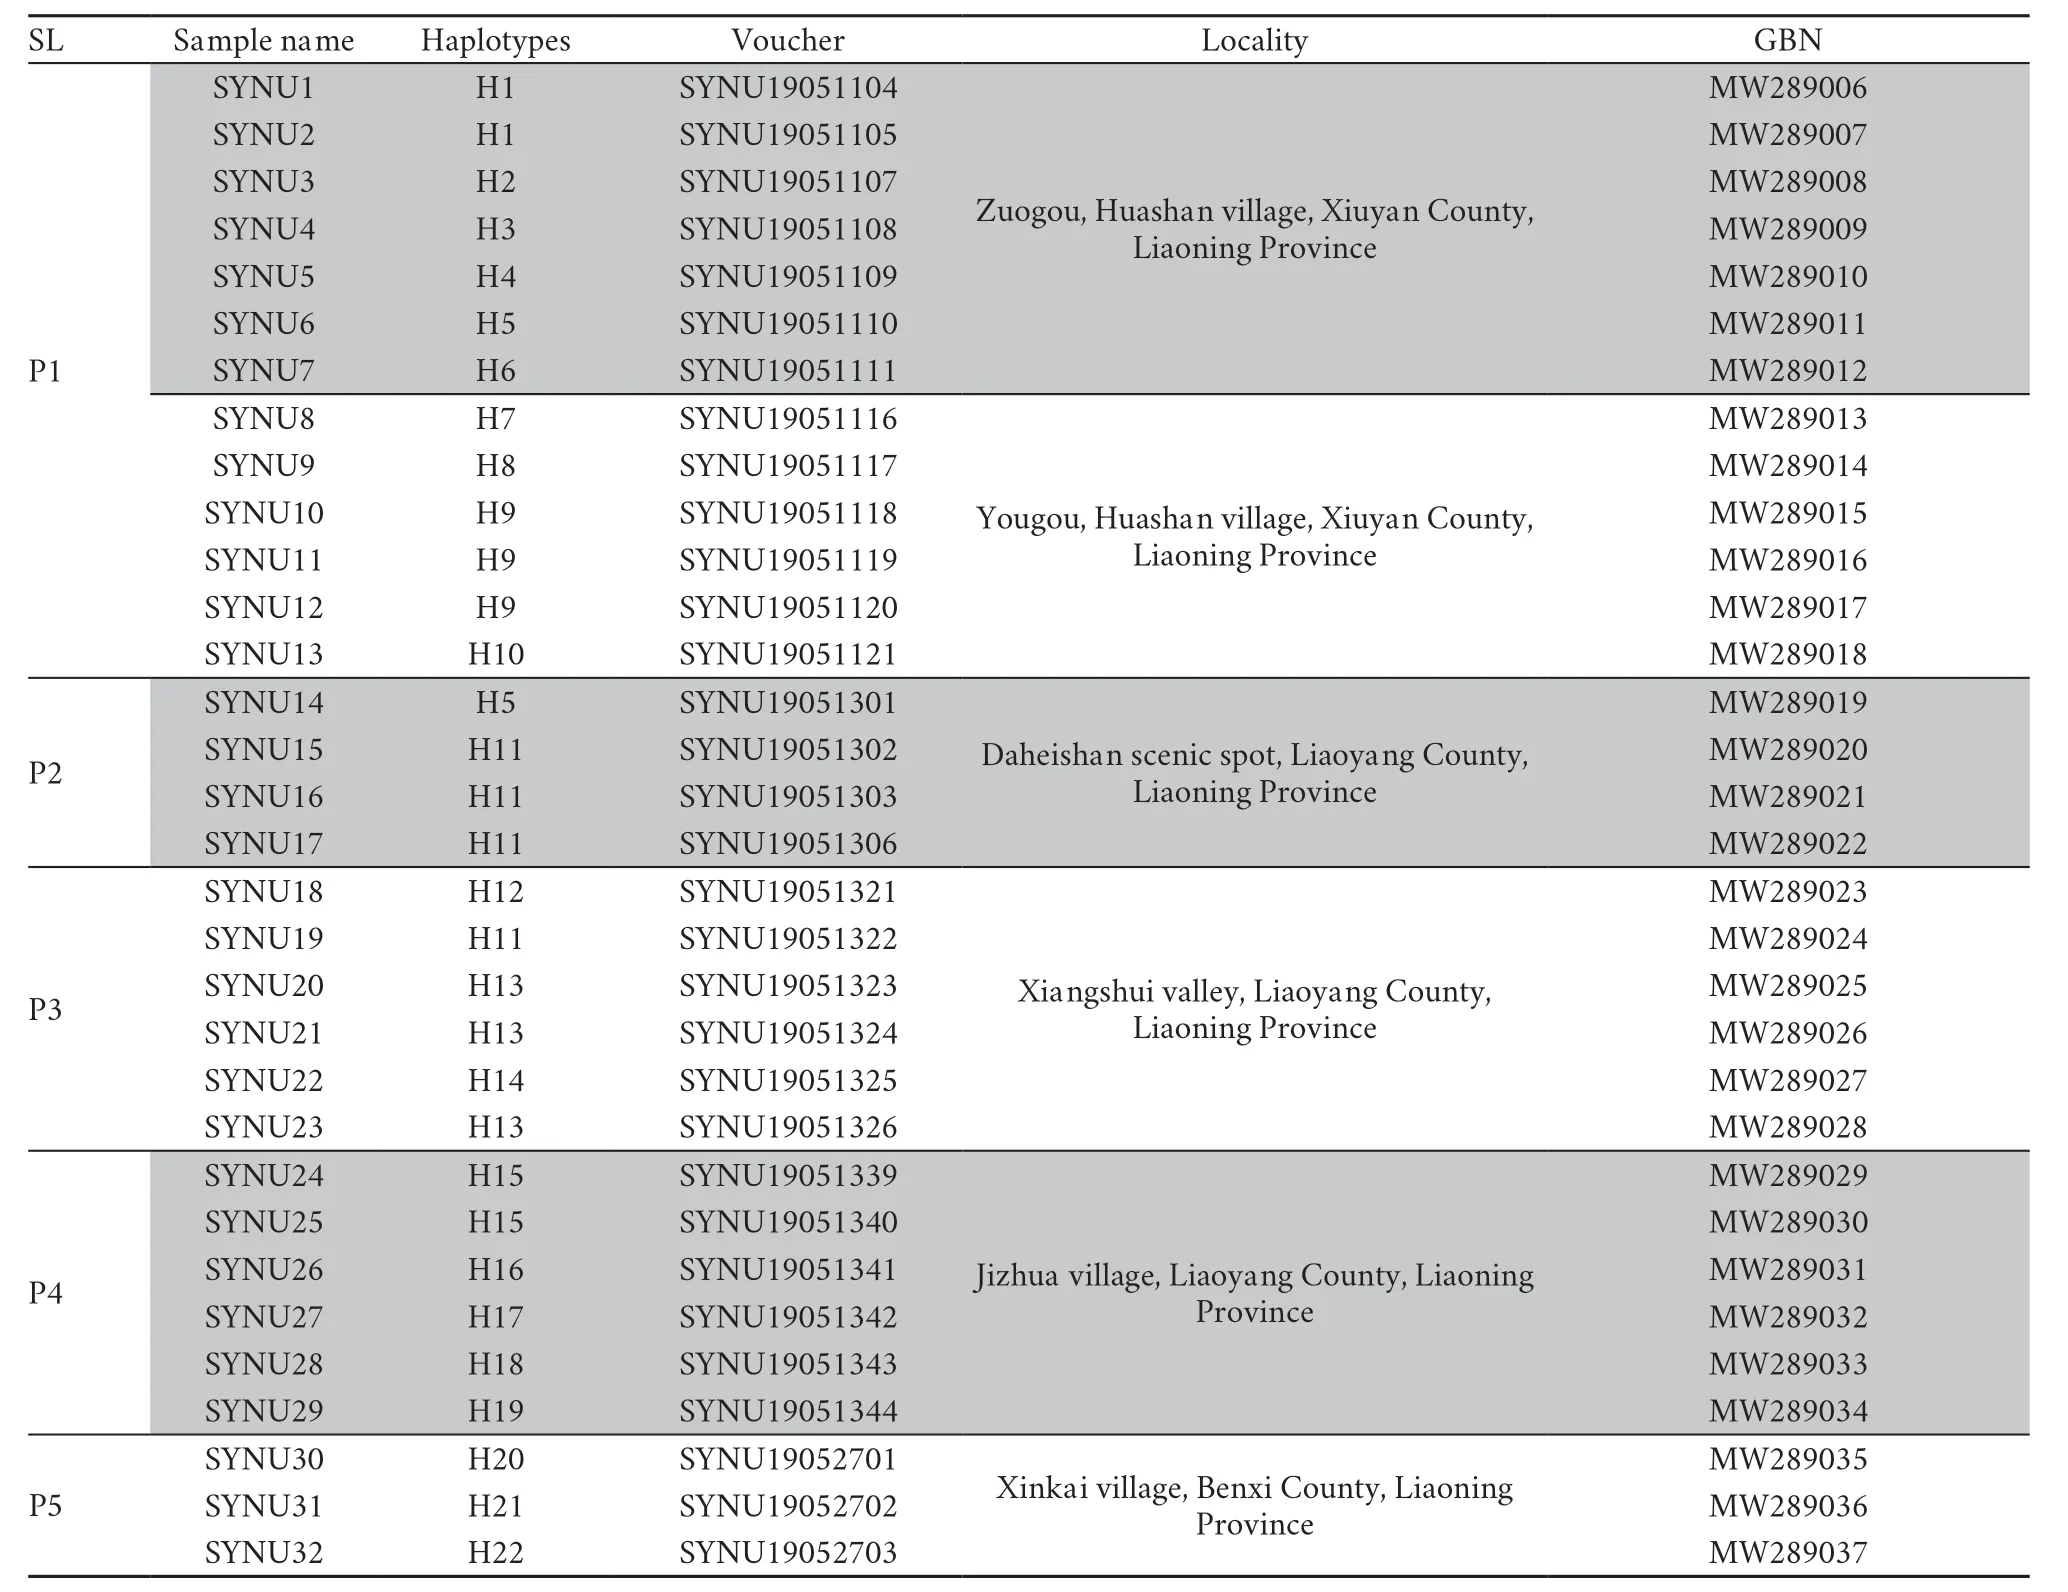
Table S1 Information for the Liaoning clawed salamanders included in this study.
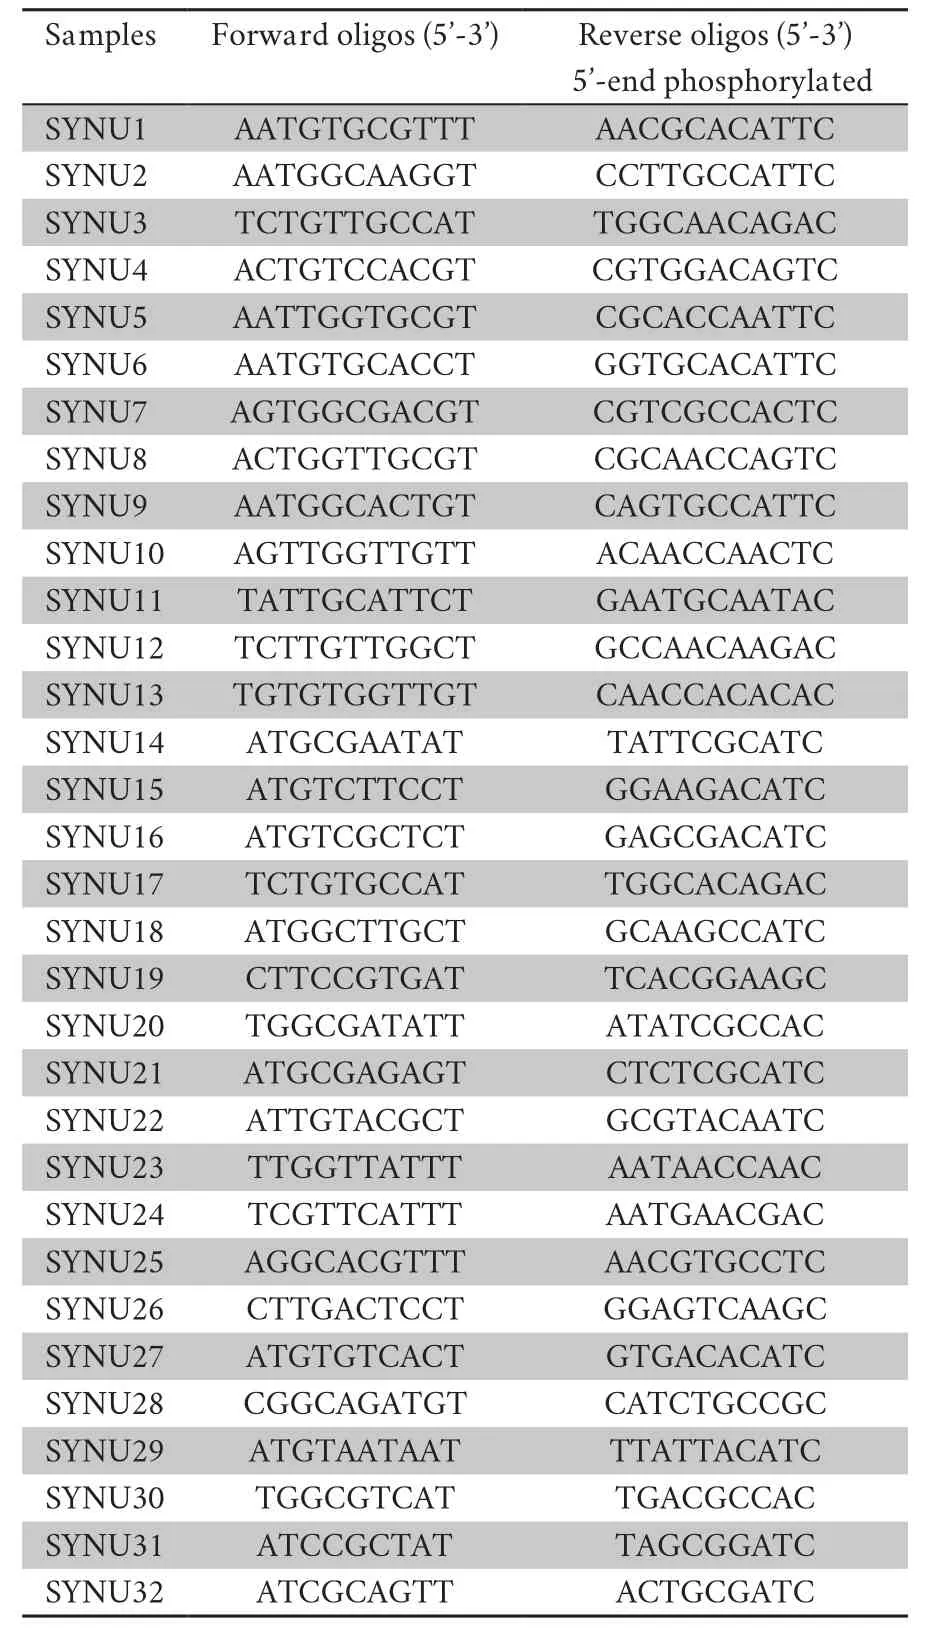
Table S2 Barcode linkers used in this study.
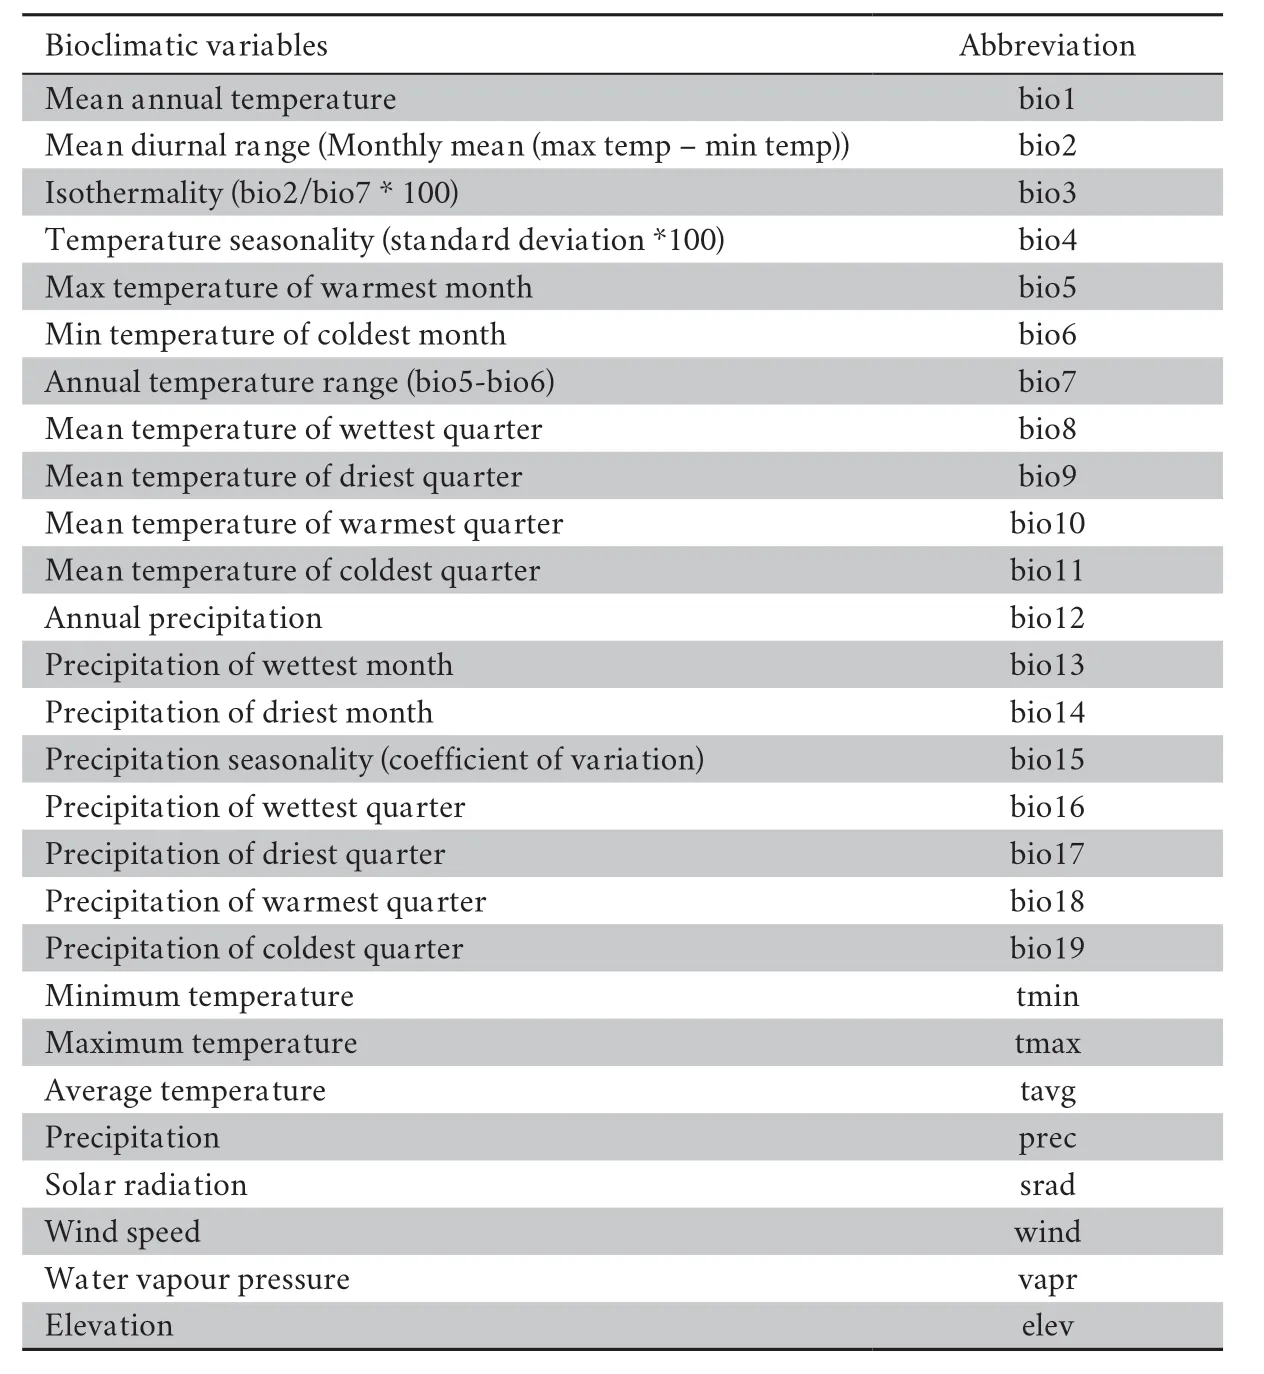
Table S3 Bioclimatic variables used in this study.
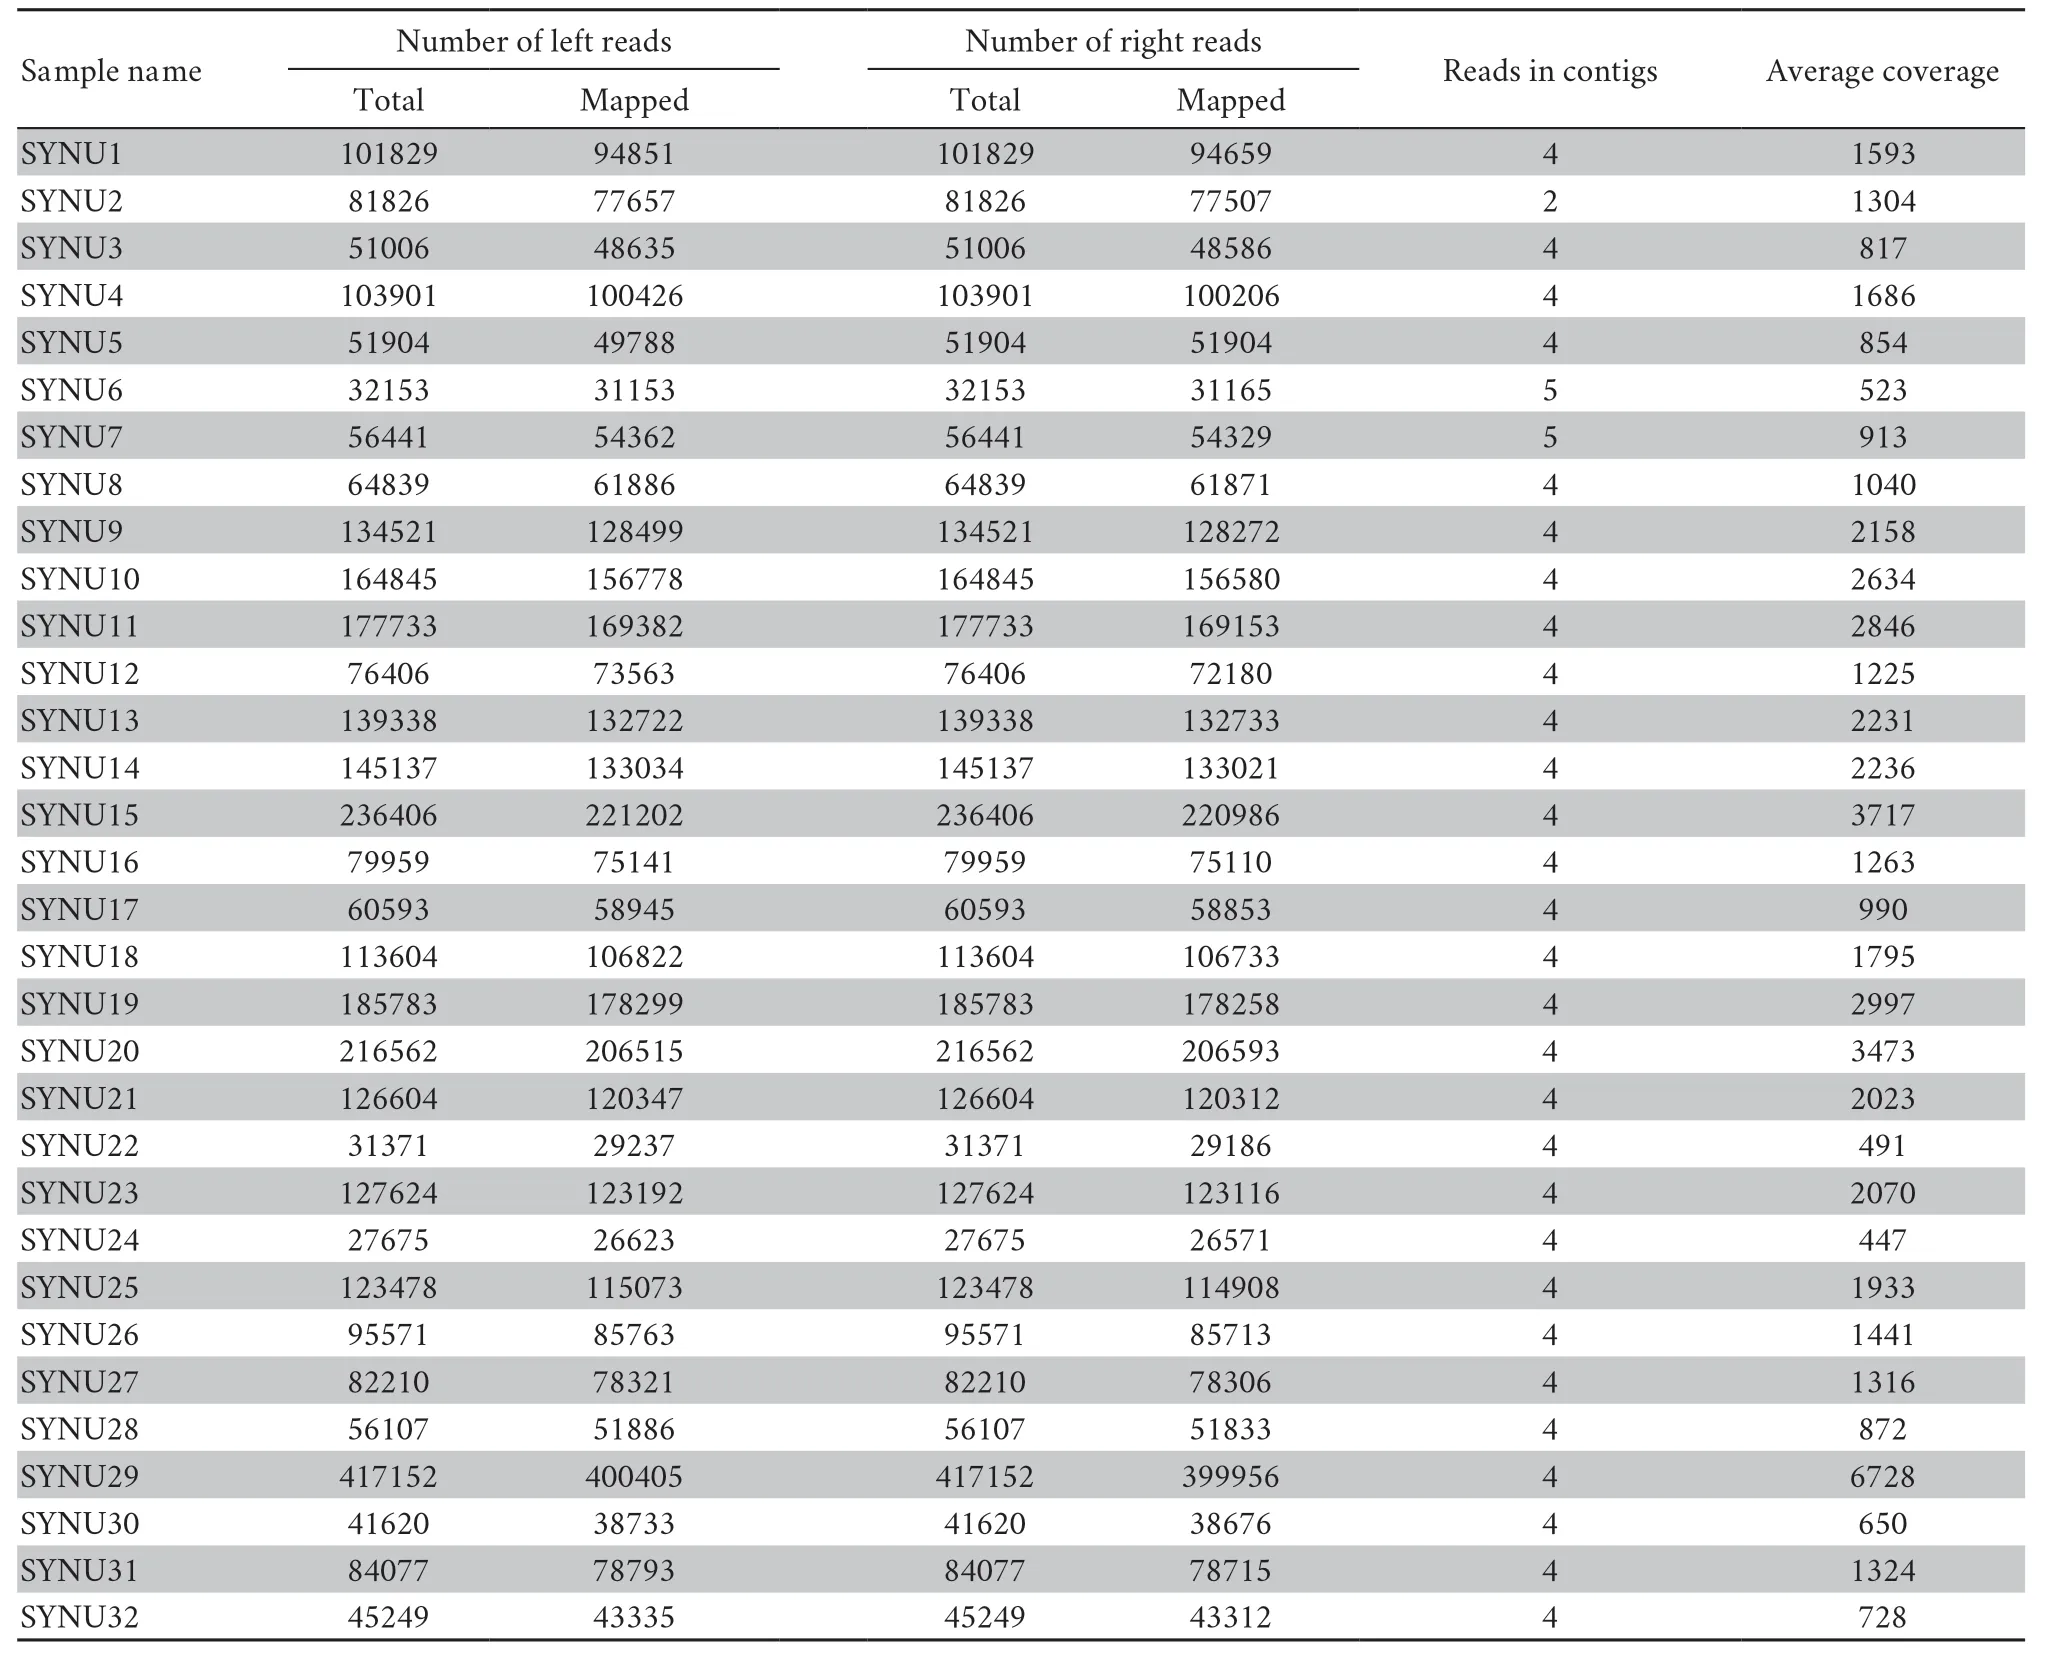
Table S4 Summary statistics for the sequence assembly in this study.
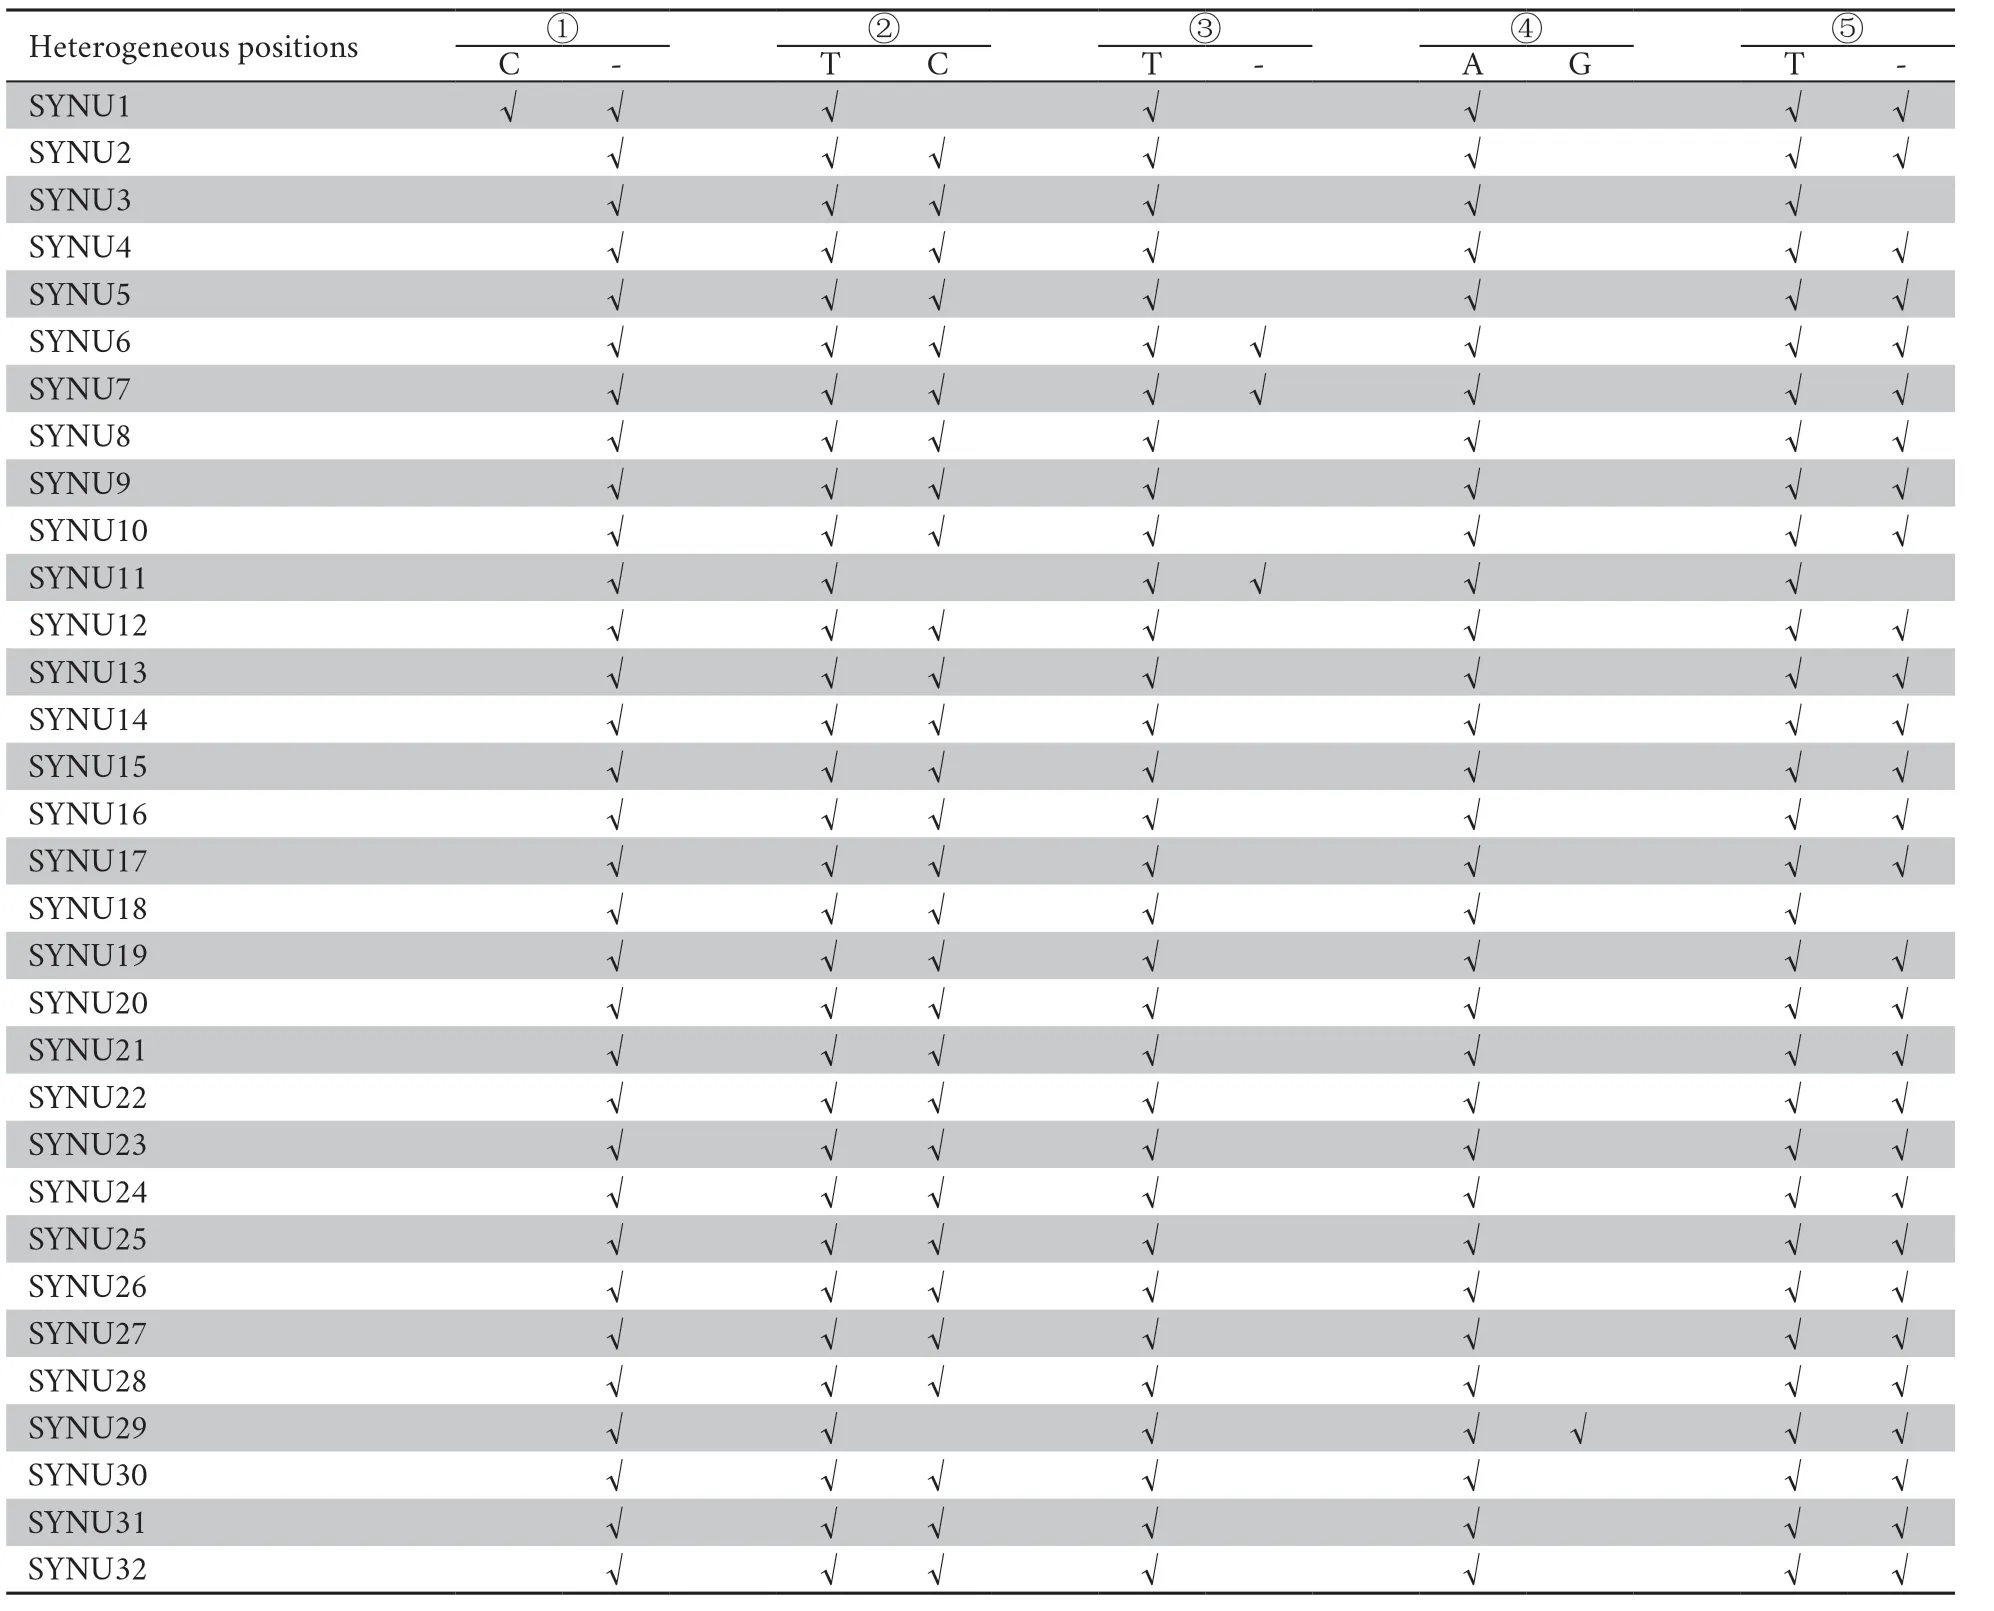
Table S5 A summary of the mitochondrial heterogeneity of 32 Liaoning clawed salamanders.The five heterogeneous positions ①-⑤ are consistent with those shown in Figure S2.
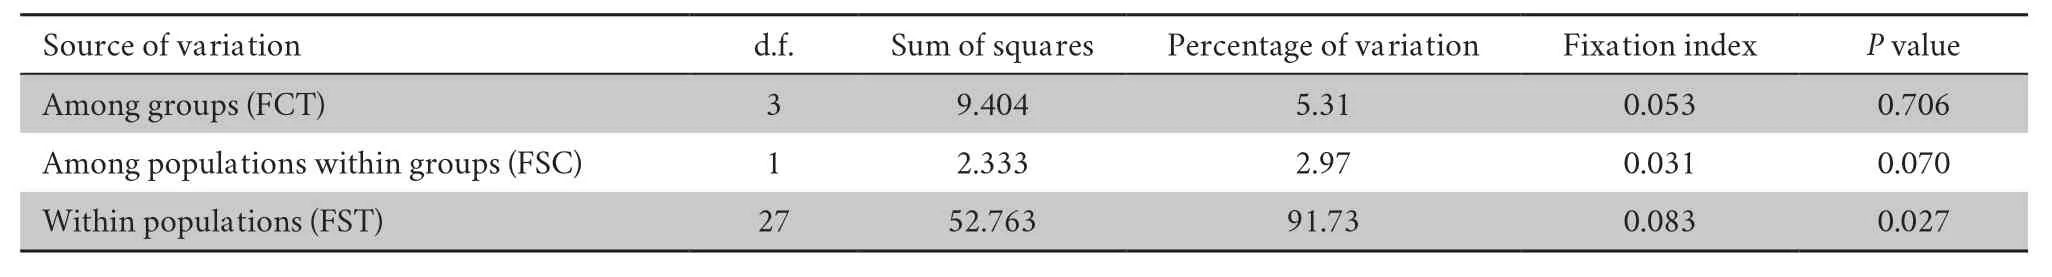
Table S6 Results of AMOVA.
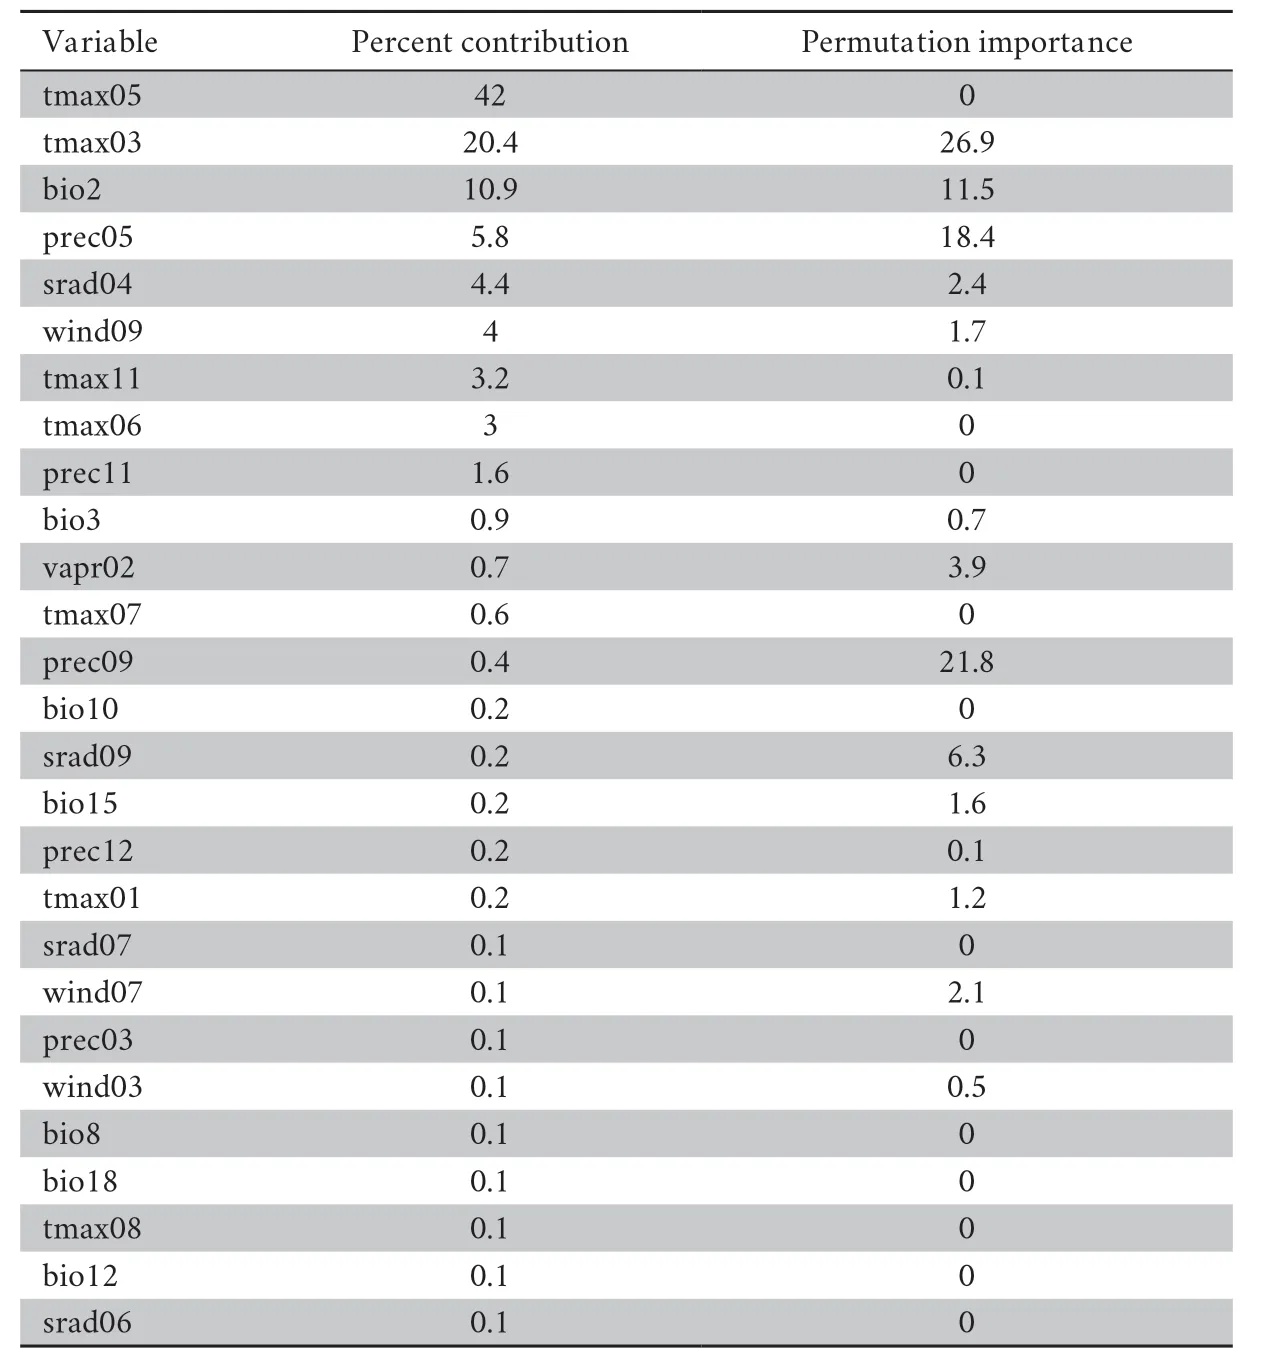
Table S7 Percent contribution and permutation importance of the environmental variables in the Maxent model.
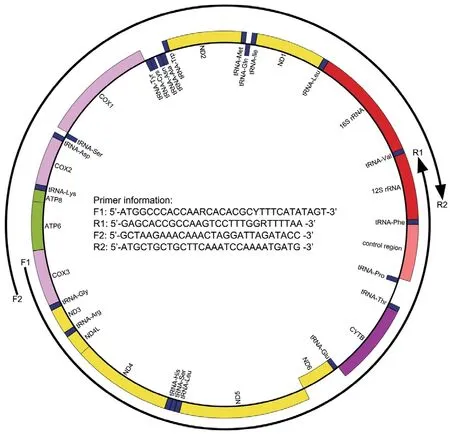
Figure S1 Long-PCR primers used to amplify the MtG of Liaoning clawed salamanders.
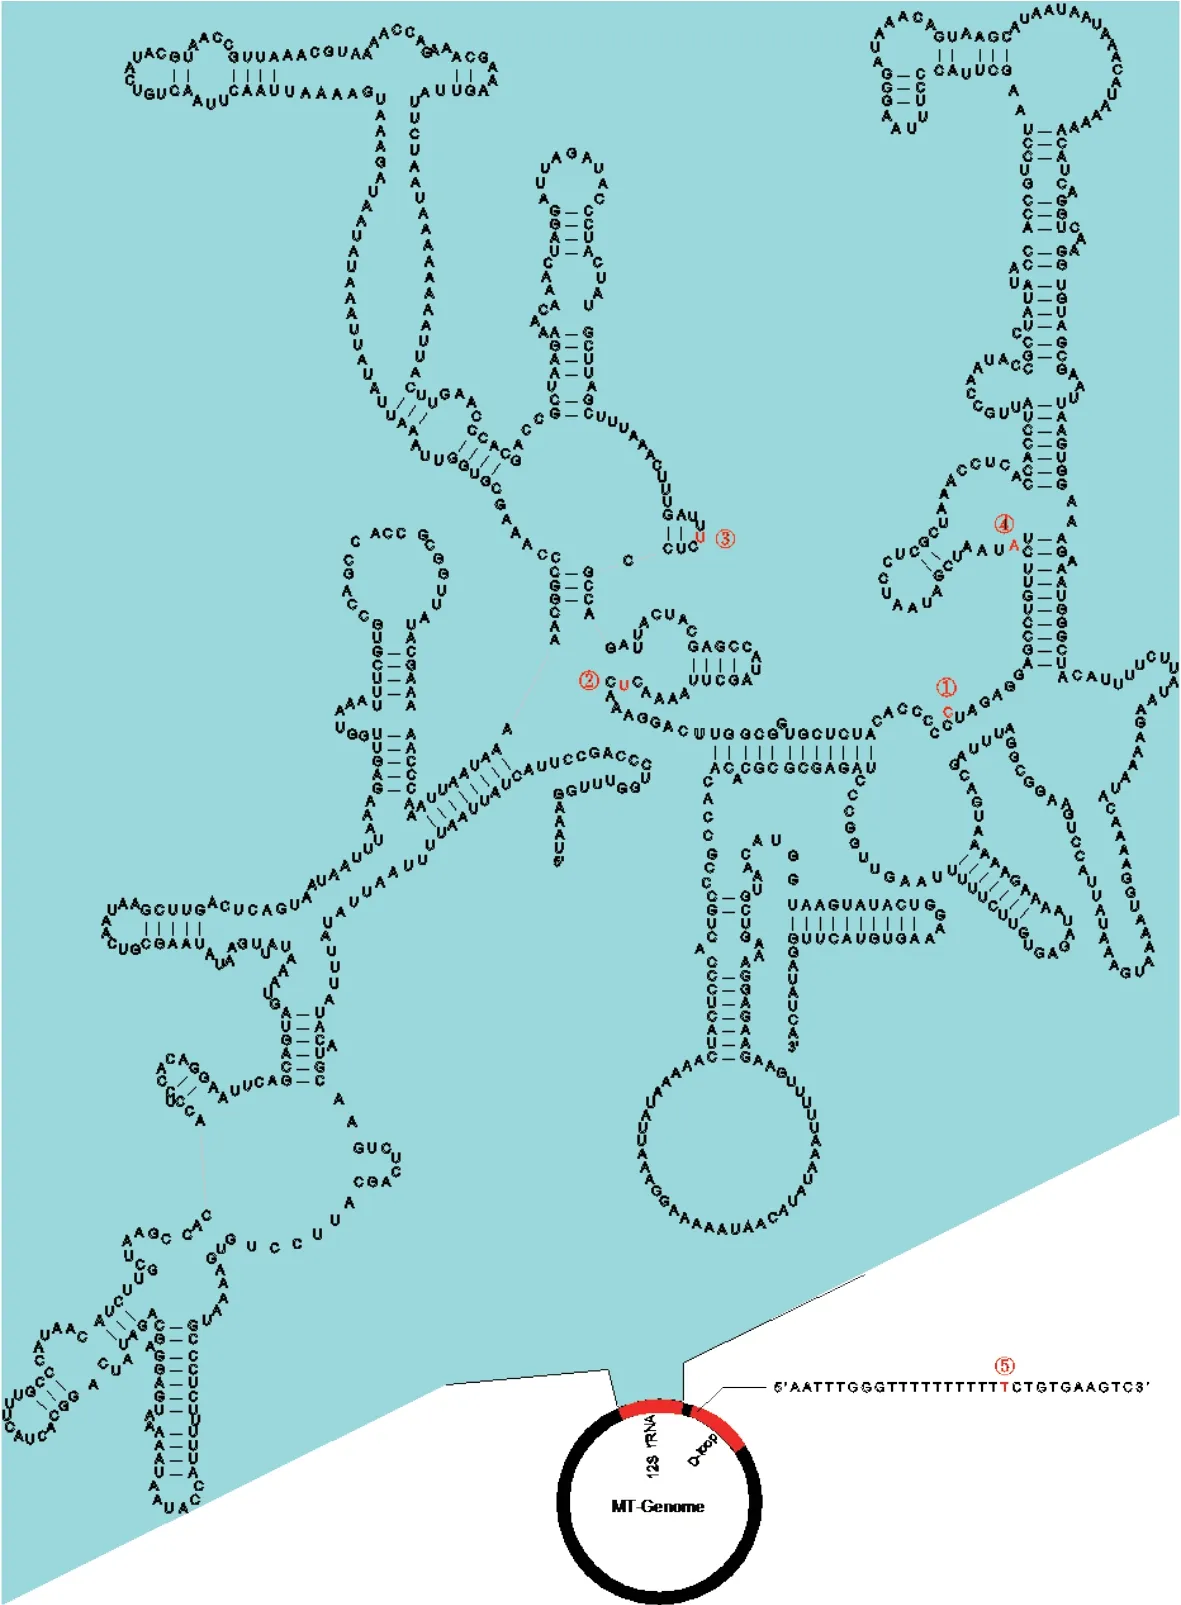
Figure S2 The five heterogeneous positions (①-⑤) within the 12S rRNA and D-loop regions.
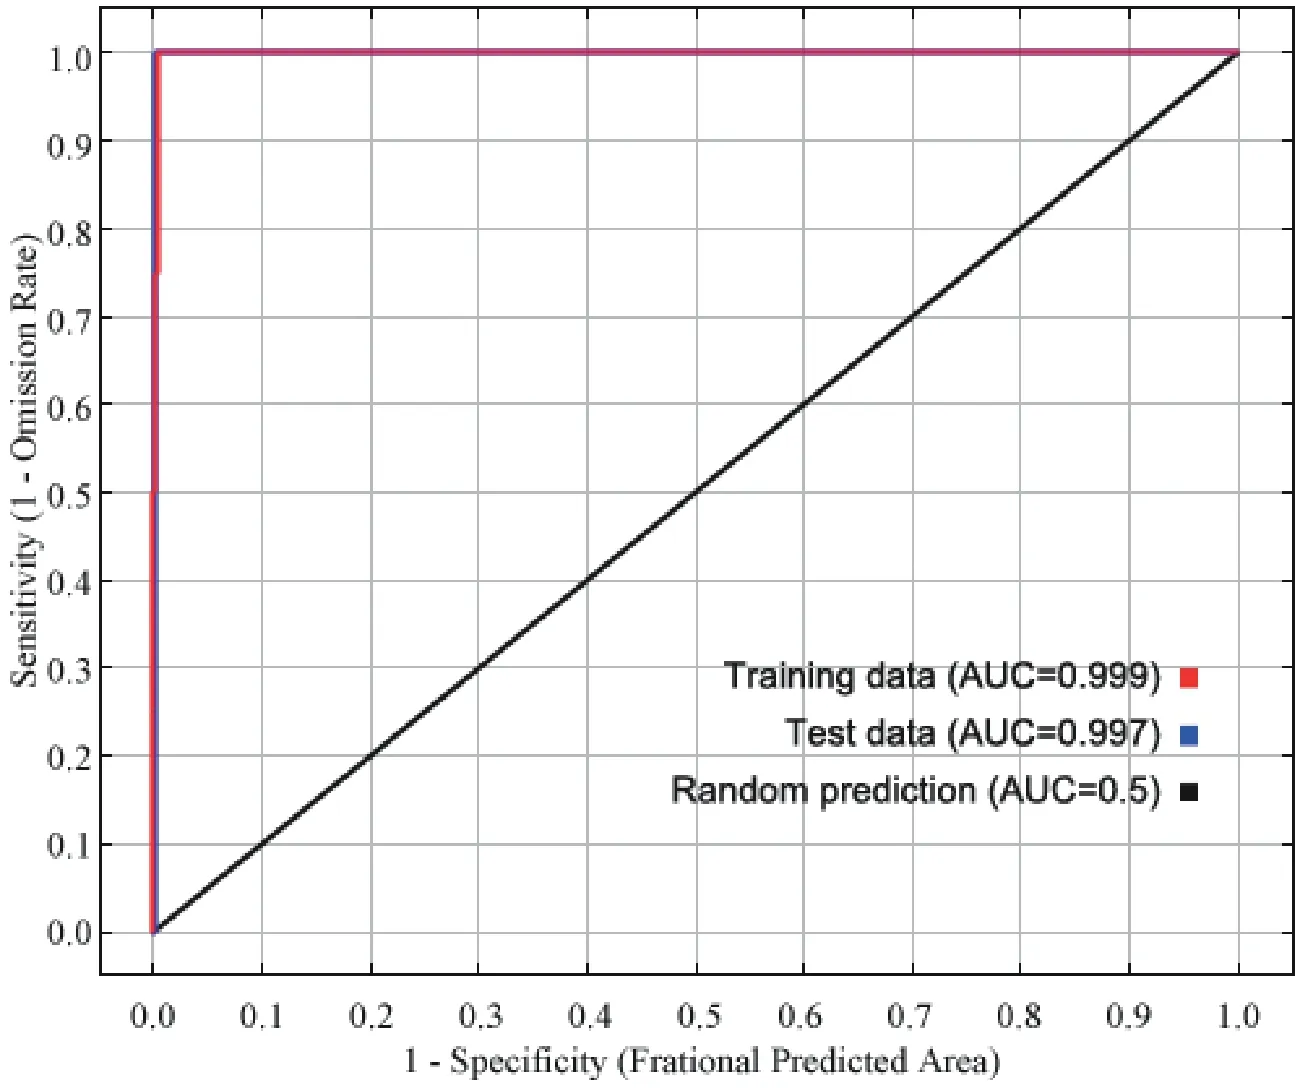
Figure S3 Receiver operating characteristic (ROC) curve and area under the ROC curve (AUC) values for the current period.
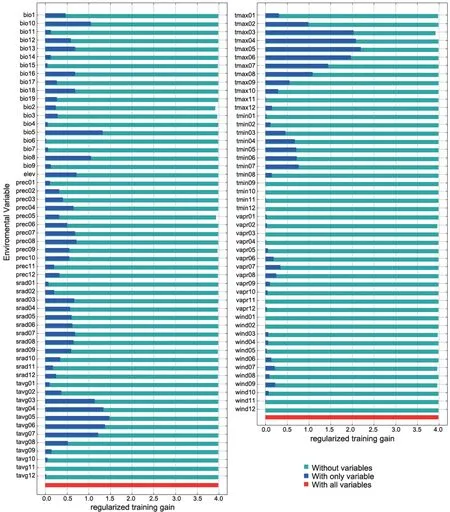
Figure S4 Jackknife test of variable importance for the Liaoning clawed salamander.
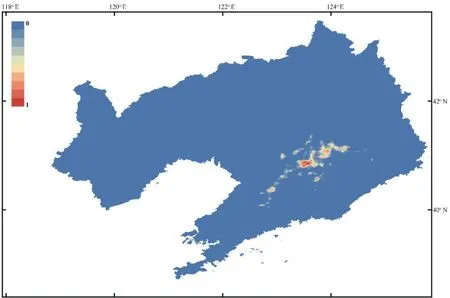
Figure S5 Predicted distribution of the Liaoning clawed salamander generated in Maxent.
杂志排行
Asian Herpetological Research的其它文章
- Chemical Composition and Crystal Structure of the Eggshell of the Green Crested Lizard Bronchocela cristatella (Agamidae)
- A New Species of Glyphoglossus Günther,1869 (Anura:Microhylidae) from Western Yunnan,China
- A New Species of Odorous Frog Genus Odorrana (Anura,Ranidae) from Southern Guizhou Province,China
- DNA Barcoding and Systematic Review of Minervaryan Frogs (Dicroglossidae:Minervarya) of Peninsular India:Resolution of a Taxonomic Conundrum with Description of a New Species