绿色基础设施城市主义和气候变化
2021-12-20新西兰马修班博瑞王昕欣
(新西兰)马修·班博瑞 王昕欣
0 前言
气候变化造成的环境影响对现有和拟建城镇提出了许多挑战。随着气候变化的到来,城市洪水、雨水污染和城市热岛效应已成为关键的全球问题。绿色基础设施被认为是减轻城市化负面环境影响的有效工具,那么绿色基础设施的概念可否用来增加城市应对气候变化的韧性?
绿色基础设施通常是由城市空间内的原生植被和水系统提供生态系统服务。作为一个术语,它在20世纪90年代首次被用于指代美国城市周围的“绿道”或“绿道网络”[1]。绿色基础设施的多功能性和对建筑环境的潜在好处在世界范围内被认可。科研人员、设计人员和政策制定者赋予了绿色基础设施不同的定义[2]。最近的一个定义将绿色基础设施的范围扩大为“由各类空间尺度的城市区域内部、周围和之间的多功能生态系统的所有自然、半自然和人工网络组成”[3]。
许多城市已经尝试使用绿色基础设施的解决方案来缓解环境问题,尤其是城市洪水。为应对2011年洪水事件,哥本哈根市政当局制定了一项城市战略,将公园用作洪水滞留区,并将街道重新规划为泄洪通道。在哥本哈根HansTavsens公园的设计中,景观设计师开发了一个绿色基础设施系统,该系统包含一系列的下沉池和植物区,用以缓解社区洪水和净化雨水。该项目创造了一个保护居民免受洪水侵袭的新生态系统,也为人们创造了新的社交空间[4]。
意大利为了应对空气污染和洪水,设计了2个新公园来取代现有的铁路基础设施。米兰北部和南部的2个铁路站场被设计为绿色片区(green zone)和蓝色片区(blue zone)。绿色片区可以净化空气污染物,降低盛行风带来的城市热量;蓝色片区可以清洁雨水并改善生物多样性。它们共同发挥绿色基础设施的作用,以恢复城市生态并提供额外的休闲空间[5]。
人们越来越多地将绿色基础设施视为减缓气候变化对环境影响的一种方式。研究表明:绿色基础设施可用于减轻城市洪水和雨水污染的影响[2]。作为雨水管理措施的绿色基础设施通常是湿地、池塘、雨水花园、洼地、绿色屋顶和透水路面[6]。这些干预措施还有助于改善生物多样性[7]、改变城市微气候[8]和减少碳足迹[9]。
本文作者认为上述文章和案例研究将绿色基础设施主要用作工程措施,即用本土植物和自然雨水系统等绿色基础设施来替代传统的城市道路和排水设施。实际上,与传统基础设施相比,绿色基础设施的优势还在于创造了新型交往空间。
要扩大绿色基础设施的应用范围来帮助建立城市韧性以适应气候变化导致的环境问题,必须超越绿色基础设施的传统定义,即在不改变城市形态的基础上,实现与传统基础设施同样的功能。因此建议:扩展绿色基础设施作为自然系统的能力,在当代城市的设计过程中构建可持续的基础设施。
然而,我们面临一种当代城市思维的通行模式,即所谓的“紧凑型城市”。这种城市理念提出了许多值得称道的模式,解决了对汽车的依赖、工作与家庭的分离、公共空间不足等明显可识别的城市问题。
但这种城市理念的一个关键问题是:看似理想化的城市结构,其建筑物、街道和开放空间都是坚硬的、不透水的表面。缺乏开放绿地会减弱吸收降雨的能力并加剧城市气温上升,这意味着当代紧凑型城市本身将加剧因气候变化带来的环境影响。
而要扩展绿色基础设施的理念,必须要重新思考未来城市的空间形态。需要将城市重新想象为一个更加开放的结构,具有能够吸收雨水并符合自然水文系统运行规律的区域。笔者建议的绿色基础设施理念前景是将城市结构建设为超绿色基础设施。
文章的第一部分将介绍基于流域的城市规划方法。该理念使用原始水文系统作为设计新型城市绿色基础设施的主要驱动力。第二部分将介绍一个三步骤设计过程以优先考虑城市绿色基础设施的创建,并将描述一组有助于创建气候变化响应的策略。通过位于新西兰奥克兰韦努阿佩的一个新城案例,展示如何用这种方法创建城市绿色基础设施以应对多样的气候变化,同时创造新的城市形态并确保预期的房地产投资回报。最后,反思了在气候变化的挑战下,城市绿色基础设施的设计对中国城市未来发展的影响。
1 设计过程
为了展示如何将绿色基础设施的基本理念扩展到设计新的城市形态以适应气候变化的影响,笔者将介绍一个新城开发的推测性设计过程,并通过一个新西兰的案例研究展示该设计方法在设计实践中的应用。
要了解气候变化对城市的影响,必须理解3件事:1)气候变化的影响是什么;2)不同类型的城市发展策略有哪些;3)可能的补救方法是什么。通过结合这3个领域的知识,可以建立一个应对气候变化、具有韧性的城市绿色基础设施系统。
1.1 步骤一:调查
城市绿色基础设施设计过程的第一步是在一个可衡量的系统内定义气候变化对特定方面的影响。水文流域[10]是一个通过观察水文循环的可测效果,将特定的景观形态(流域)与城市形态联系起来的系统。第一步是建立调查清单。该清单包括流域的定义,开发场地及流域的位置和边界。通过航拍照片、流域地形、植被和水文,特别是地表径流路径,进一步确定城市开发场地在流域内的位置。特别需要分析流域内透水地表与不透水地表的比率。了解流域的这一要素很重要,因为城市开发场地能够通过透水地表吸收气候变化导致增加的降雨量。
1.2 步骤二:发展
城市绿色基础设施设计过程的第二步涉及对从局部场地设计到宏观规划发展机制的理解,可以通过经济指标来衡量开发过程。流域内的城市发展潜力可以通过多种方式衡量。单个地块的经济回报可以用简单的开发强度来理解,即总建筑面积(gross floor area,GFA)和容积率(floor area ratio, FAR)[11]。简单地说,单个场地的总建筑面积与建筑基底面积的比例关系是由多个要素决定的,通常是由地方当局的设计导引和开发收益决定。
笔者建议如果将绿色基础设施纳入城市设计过程,需要调整容积率指标:用增加透水地表的面积来换取建筑高度的增加。由此可以提高开发场地对气候变化的适应能力。
一个较大的城市场地的发展潜力,无论是新区开发还是旧城改造,都可以通过结构规划①和详细规划来展示。这两类规划可展示场地在不同规划层次的发展潜力:从简单的用地分区布局到详细的建筑分布布局。
应对气候变化的韧性与城市发展规划的关系可以从几个方面进行分析。对于新区开发、水文的影响可以通过简单地测量开发前与开发后透水和不透水地表的比率来理解。这一比率可以通过很多水文软件来计算,这些水文软件可用于演示气候变化对结构规划开发的影响,以及对场地水文平衡的影响。
气候变化对城市规划的多重影响可以通过规划图与场地现状水文图的叠加来揭示。例如,在叠加图中,规划中的部分用地会切断地表径流路径而阻滞洪水排放,或部分用地位于海平面上升的淹没区。这些问题有助于我们理解规划与环境的冲突。通过使用推理公式法[12]以及几个软件程序,也可以理解不透水地表增加对环境的影响程度。
构建适应于气候变化的城市绿色基础设施的设计过程,首先应将城市发展置于水文流域内。明确场地现有环境条件以及气候变化对水文系统的影响。将开发场地——从单个场地到结构规划——与流域水文系统进行叠加,可以绘制和测量不同城市形态对环境的影响。
1.3 步骤三:韧性
一旦了解了气候变化对新城发展的影响,就可以探索几种修复策略来帮助构建城市绿色基础设施。开发新城市绿色基础设施形态的设计方法通常包含两类:景观类和建筑类。其中一些方法是由低影响城市设计和开发(low impact urban design and development,LIUDD)技术衍生出来的[13]。LIUDD的目标是:充分利用现有基础设施,通过选址使开发的影响最小化,使开发与生态系统的承载能力相匹配,并最大限度地减少流域内的能量投入和产出。这些目标是通过采取特定策略达到的:保护开发场地现有的敏感区域来保护陆地和海洋生物多样性;尽可能地维持流域的自然水文;恢复和保护自然景观,减少或控制开发场地的污染物;以及开发新的城市形态,即通过簇群化布置建筑项目来帮助保留或创造透水空间。
这些技术可以使用地理信息系统(GIS)软件进行建模。要保护场地现有的水文格局:需识别从流域上游穿过开发场地的地表径流路径,并运行缓冲命令以确定须保护的河岸廊道;还可以在滨海岸线或河流边缘建立缓冲区来保护沿海地区。这些设计策略能发挥多种功能:例如,地表径流路径缓冲区可用于泛滥洪水的输送和滞留;还可以沿地表径流路径种植本土植物,以帮助促进蒸腾作用并降低城市热岛效应;地表径流路径缓冲区网络还可设置雨水处理设备(如湿地),以处理来自更大流域范围的雨水[14];滨海岸线的缓冲区有助于设计和定位防海洪的软屏障。
以上修复技术对流域的净影响可以通过重新计算透水与不透水地表的比率来衡量。通过以上三步骤的设计,构建更加开放和绿色的城市绿色基础设施,并通过多种修复机制帮助城市建立抵御气候变化的能力。
这种新的城市绿色基础设施对传统房地产项目的影响是:需要解决如何分布建筑面积以满足项目的经济需求。这可以利用LIUDD策略的建筑项目簇群化布置实现。将总建筑面积重新布局,即在满足环境修复规划的前提下重新配置建筑基底,可以实现原始房地产投资的经济回报。将重新规划的建筑基底导入ArcGIS中建模,在三维空间中通过拉伸命令将建筑基底拉伸成3D建筑模型。
2 案例研究
本研究以新西兰奥克兰韦努阿佩的新城市开发项目的提案为例,演示如何设计新的城市绿色基础设施,展示三步骤的城市绿色基础设施设计过程在应对气候变化造成的城市环境问题的适用性,以及改善这些问题的方法。
第一步为确定新的城市发展可能产生哪些环境问题。通过2个尺度的流域研究,确定了主要的环境问题是洪水量的增加和洪水对水质的污染,及对现状水文系统和接收环境的危害。
第二步为确定开发分区及开发对流域的环境影响。应用推理公式法[12]来了解开发前后流域内透水与不透水地表的比率对雨水和洪水产生的影响。这一步的策略是防止污染的雨水和洪水进入现有水文网络。具体技术是在现有的溪流两侧生成缓冲区,可通过GIS制图和分析来识别现有的水文网络、河流和地表径流路径,然后利用ArcGIS中的缓冲命令在每个地表径流路径和河流周围建立保护区[15]。此操作的效果还在于增加了透水地表的面积。
第三步是簇群化布置城市形态。为保证现有的水文系统和规划的绿化缓冲区,将不可避免地损失开发建筑面积。为确保预计的房地产项目不会产生经济损失,可将开发建筑面积簇群化布置为新的城市形态[16]。韦努阿佩案例研究的城市设计结果是将“缺失”的建筑面积聚集在位于河流系统与滨海交汇处的公寓楼。
2.1 韦努阿佩
韦努阿佩是新西兰奥克兰西部规划的新城区(图1),位于上怀塔玛塔港的南侧,其西部边界为布里格姆河,南部和东部边界分别为16号、18号国道;场地大部分平坦,平均海拔约25 m以上;主要建设用地为韦努阿佩机场。
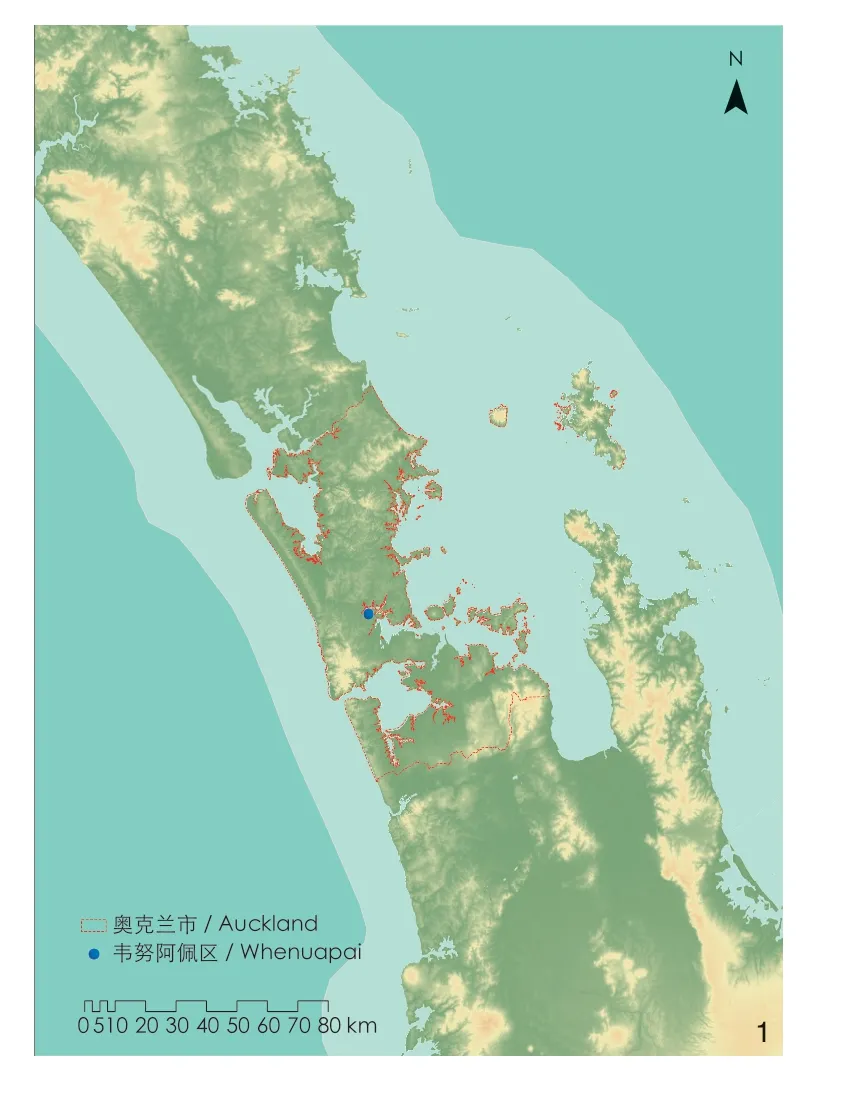
1 韦努阿佩区位Whenuapai location
2.1.1 韦努阿佩场地分析
1)水文。韦努阿佩可分为8个主要流域(图2-1),由布里格姆河、拉拉瓦拉河和怀阿罗黑河等多条河流划分,并经10条河道排入海港。韦努阿佩年平均降雨量为1 333.5 mm,月平均降雨量为111.1 mm。最干燥月份1月的平均降雨量为79.3 mm;最潮湿月份6月的平均降雨量为147.8 mm。
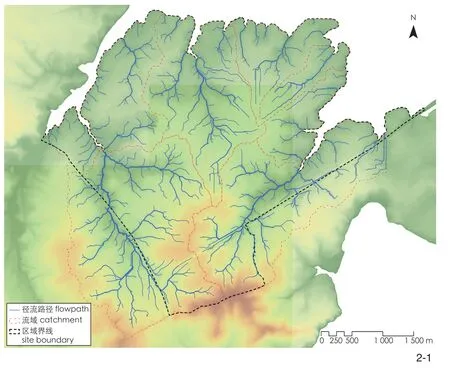
2-1 韦努阿佩流域Whenuapai catchments
2)坡向和坡度。韦努阿佩的坡向主要是北向,沿溪流廊道两侧的部分用地为东西朝向(图2-2)。大部分场地的坡度平坦(0~5°);而沿溪流廊道的部分用地坡度为5°~16°不等(图2-3)。
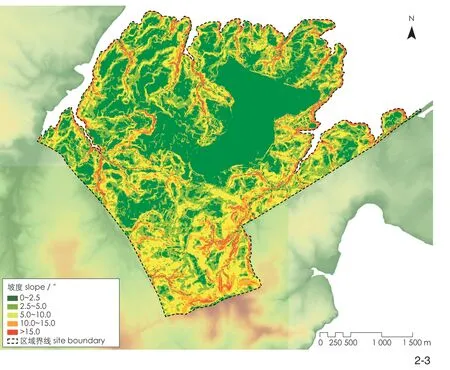
2-3 韦努阿佩坡度Whenuapai slope
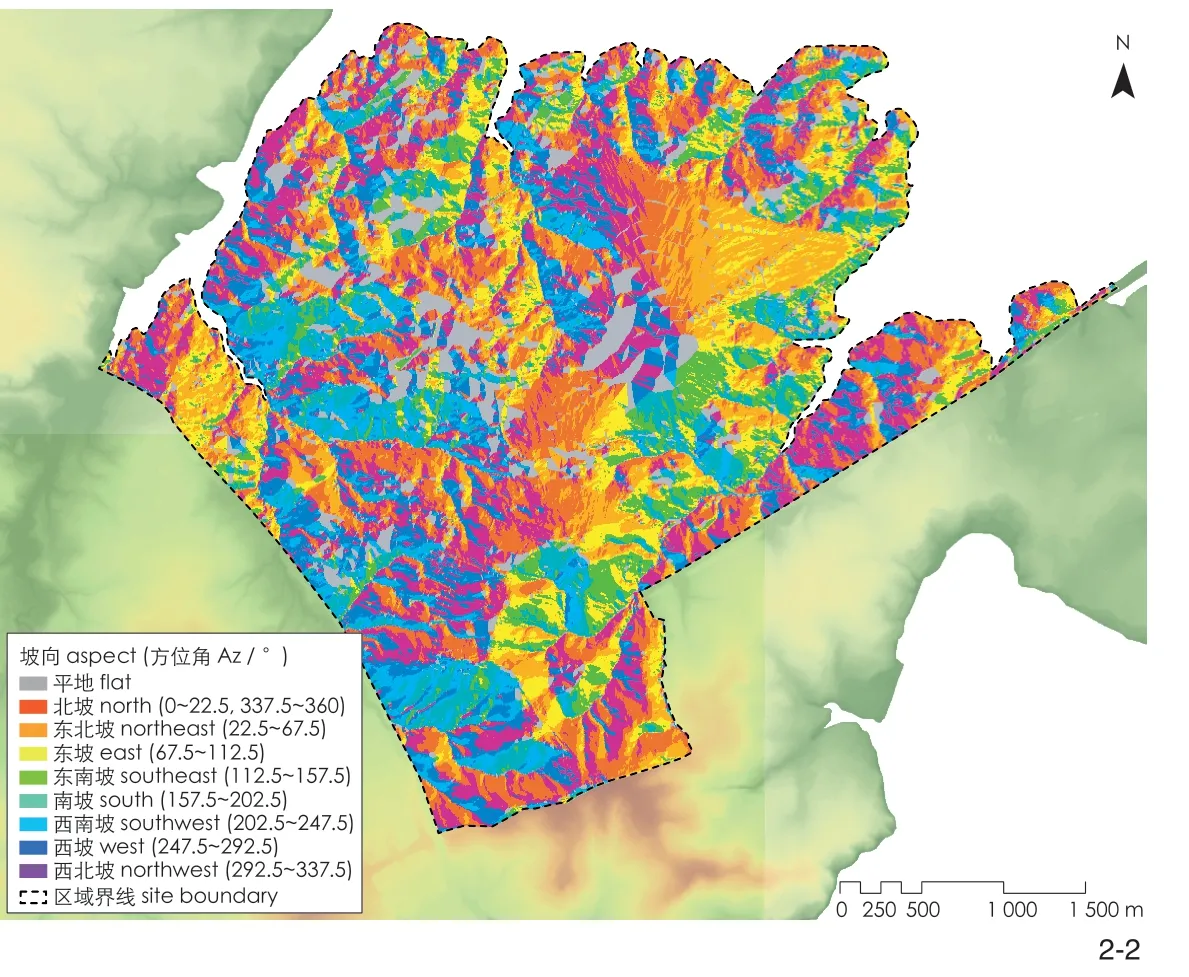
2-2 韦努阿佩坡向Whenuapai aspects
3)植被。该场地最初由新西兰的本土沿海森林覆盖。韦努阿佩流域沿海边缘的典型植被特征属于Kowhai-Kotare港海岸线生态系统[17],优势树种有Metrosideros excelsa、Sophora microphylla、Dysoxylum spectabile、Vitex lucens、Agathis australis、Corynocarpus laevigatus和Alectryon excelsus。灌木种类包括Pittosporum crassifolium、Astelia chathamica、Pittosporums tenuifolium和Myoporum laetum。
2.1.2 韦努阿佩结构规划
奥克兰正在经历城市快速发展的时期。预计未来20年将有超过100万人口的增长。城市快速增长造成了严重的住房短缺。韦努阿佩毗邻16号国道 ——奥克兰西部城市增长廊道的一条重要高速公路,且靠近新的西北购物中心,毗邻霍布森维尔住房开发项目(近年来成功的新城开发项目),使韦努阿佩成为未来城市发展的下一站。为了应对奥克兰面临的城市压力,奥克兰市议会为韦努阿佩制定了城市结构规划,以帮助构思未来城市发展的形态[18]。根据与基础设施的邻近度,该结构规划对可用土地进行了区划:工业用地和公寓区位于主要交通路线16号和18号国道附近;较低密度的住宅区靠近怀特玛塔港;大地块的单层住宅被规划到沿海边缘;而更密集的住宅(中等密度)被划在沿海边缘和工业区之间(图3)。
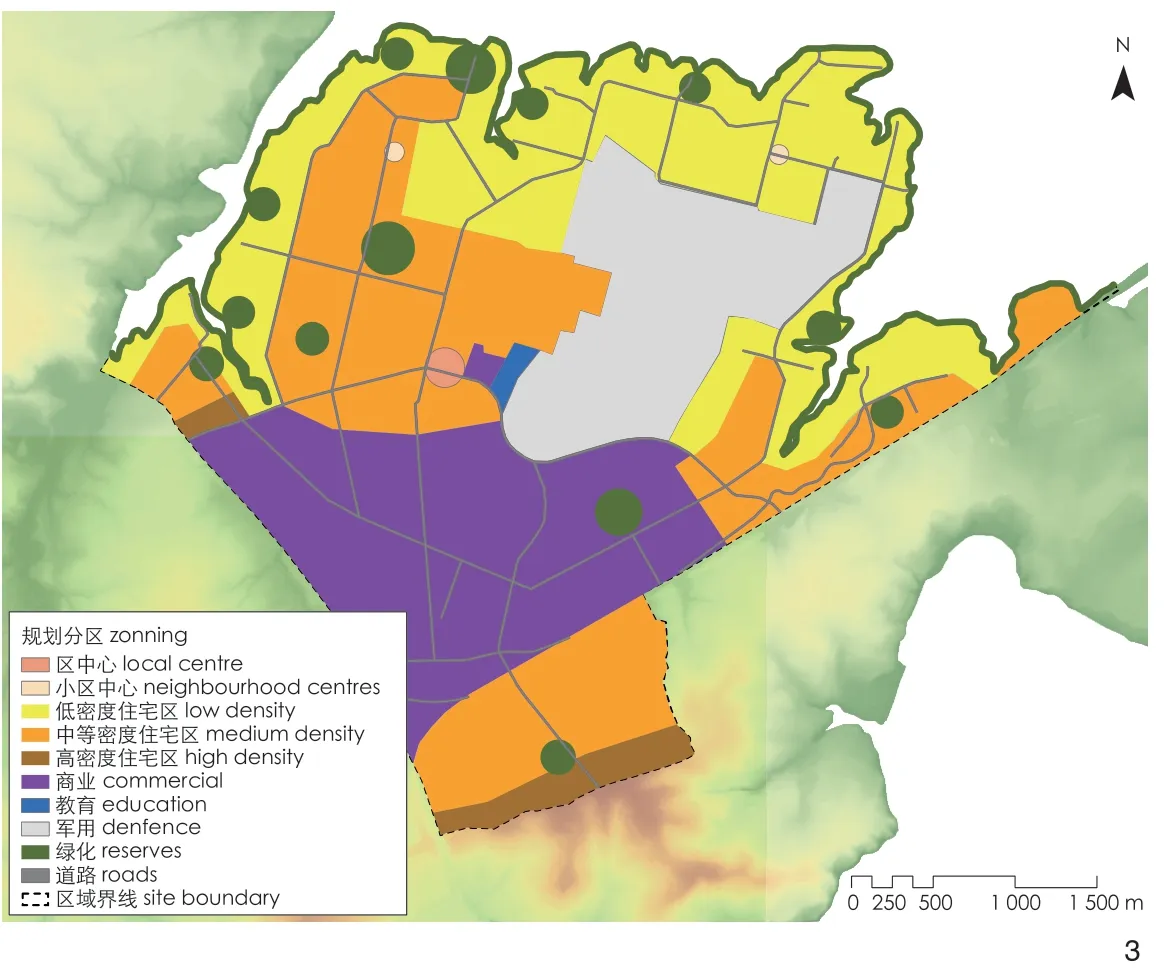
3 韦努阿佩官方规划Whenuapai council plan
而拟议的结构规划将导致一系列环境问题,包括雨水污染和洪水增加,这些问题将因气候变化的影响而加剧。为了探索这些影响的后果,本文作者在韦努阿佩大流域内选择了一个子流域——拉拉瓦拉子流域,作为案例研究的范围。通过对拉拉瓦拉子流域的水文分析来理解拟议规划的城市发展后果,并制定策略以修复其对环境的影响。
2.2 拉拉瓦拉子流域
2.2.1 步骤一:拉拉瓦拉子流域调查
324 hm2的拉拉瓦拉流域位于韦努阿佩流域北部(图4)。该流域地势相对平坦,北面以怀特玛塔港为界,西面是布里格姆河和皮托伊托伊流域,东面是韦努阿佩村和机场,南面是16号和18号国道的交汇处(图5)。
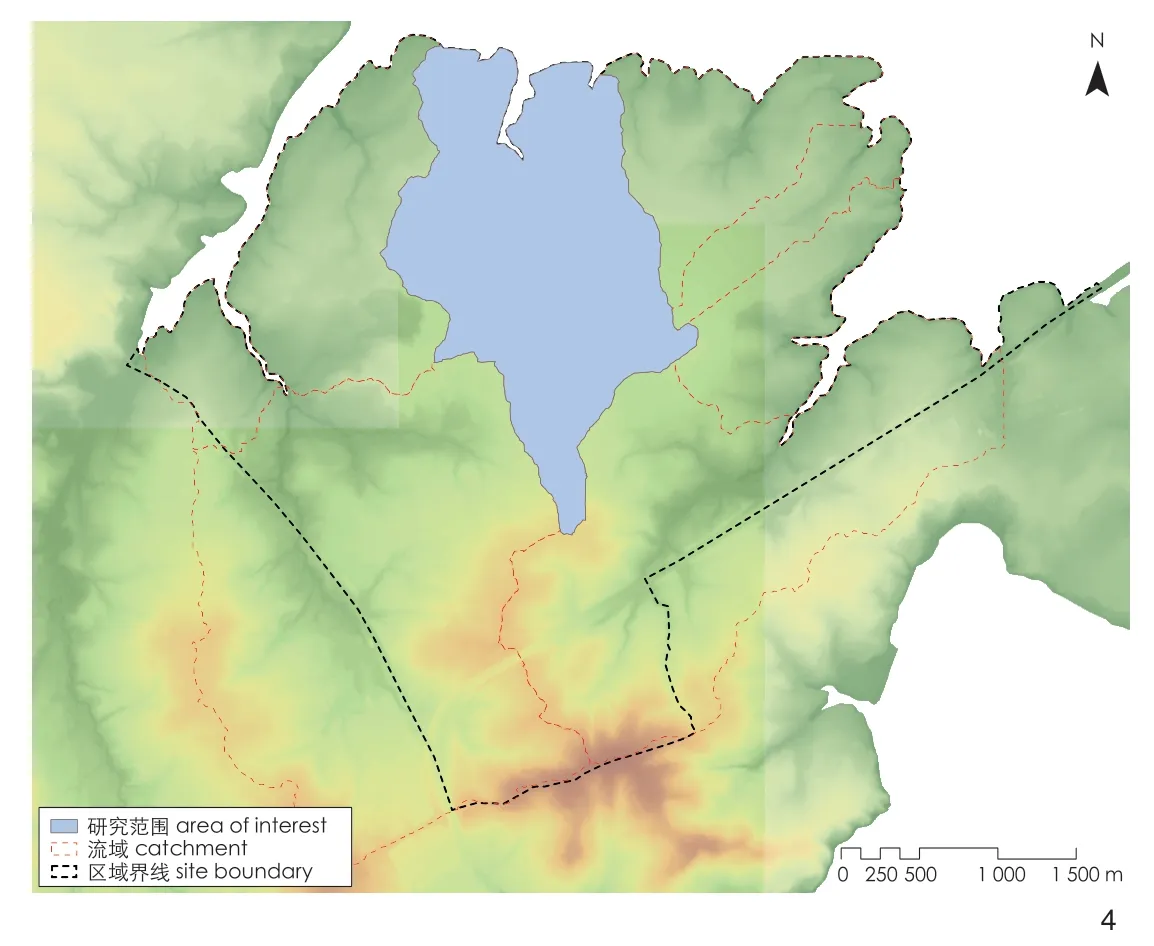
4 拉拉瓦拉子流域的位置和边界Rarawara location and boundary

5 拉拉瓦拉子流域现状图Rarawara sub-catchment existing condition
1)植被。该流域的主要植被是草地,也是流域的乡村经济产物。其他植被包含住宅区庭院的装饰性花园植物以及小型园艺和果园街区中的防护林树种。
2)水文。该流域的主要溪流均汇入拉拉瓦拉河。拉拉瓦拉河大致呈南北走向,将整个流域一分为二。拉拉瓦拉子流域又可划分为3个子流域。拉拉瓦拉河河口与怀特玛塔港相连,从腹地到海滨拉拉瓦拉子流域两侧都有较小的溪流(图6)。
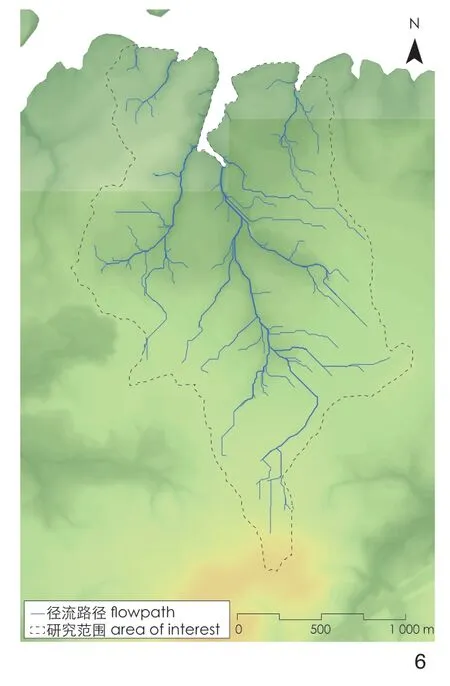
6 拉拉瓦拉地表径流Rarawara overland flow
3)坡向和坡度。拉拉瓦拉流域的坡向大多为北坡,沿溪流廊道的两侧有部分用地为东西朝向(图7-1)。场址大部分坡度平坦,为0~5°,尤其是机场用地(图7-2);而沿着溪流两侧的廊道坡度为5°~16°不等。
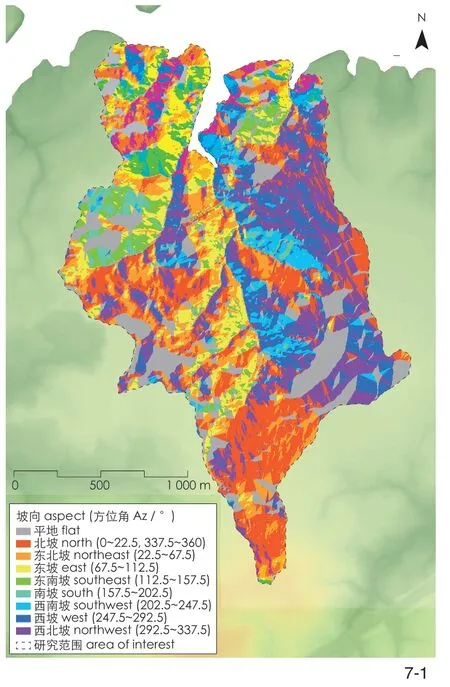
7-1 拉拉瓦拉坡向Rarawara aspects

7-2 拉拉瓦拉坡度Rarawara slope
4)土地使用。该流域内的土地用途分为2类:第一类为郊区住宅用地,包括大地块住宅、北部沿海住宅以及机场西部的小地块住宅;第二类为乡村用地,由乡村生活方式街区②和小型园艺和果园街区组成。
5)透水/不透水比率。现有的拉拉瓦拉流域面积为324.175 3 hm2。由于其主要是乡村用地,该流域主要由透水地表构成,总透水地表面积为220.026 5 hm2;不透水地表面积由道路(81.842 8 hm2)和建筑物(20.100 4 hm2)组成,总不透水地表面积为101.943 2 hm2。得出透水与不透水的比率为2∶1(图7-3)。

7-3 拉拉瓦拉透水和不透水地表Rarawara pervious/impervious surfaces
2.2.2 步骤二:拉拉瓦拉子流域发展
1)拉拉瓦拉结构规划。奥克兰市议会的韦努阿佩结构规划将拉拉瓦拉流域规划为4个住宅区和1个工业区。最靠近海岸的地区划为低密度单层住宅区,沿海岸边缘约100 hm2。每500 m2规划一个住宅单位,可提供2 008户住宅和50 hm2的不透水表面。沿海地区还规划了一个82 hm2的中等密度住宅区,如果每300 m2规划一个住宅单位,可安排2 743户住宅,提供61 hm2的不透水表面。其余区域为工业或商业区,在机场区以东有2个公寓区。同时拟建3个公园,总面积约35 hm2。按照这一规划布局,道路以及拟建和现有的房屋构成了212 hm2的不透水表面(图8)。
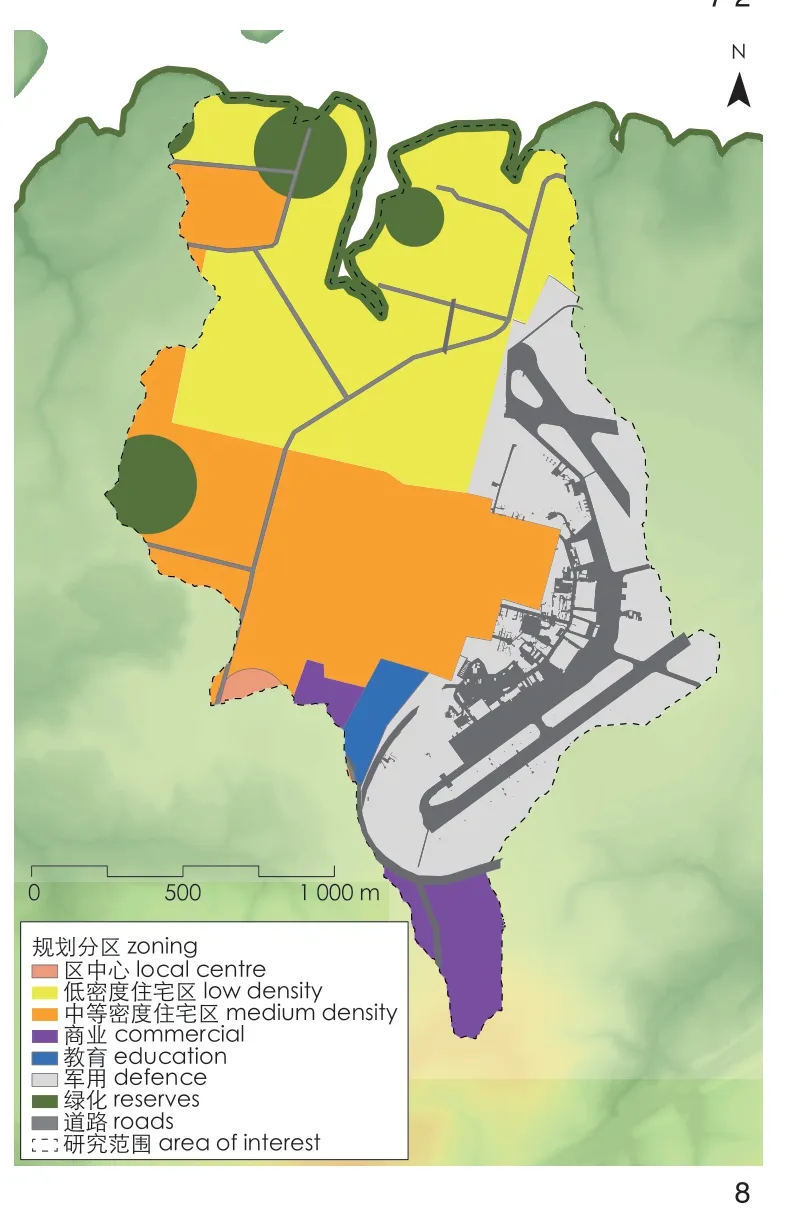
8 拉拉瓦拉官方结构规划Rarawara council structure plan
2)拉拉瓦拉子流域环境问题。随着新住宅和相关基础设施的建设,现有场地的水文格局将发生不可逆转的改变;随着沉积物的增加,径流也会增加,这将增加上怀特马塔港已经很高的沉积物污染程度,径流也将受到道路污染物和屋顶碎屑的污染。
在奥克兰市议会的结构规划中,拉拉瓦拉流域的不透水地表面积将显著增加。现状拉拉瓦拉流域总面积为324.175 3 hm2。透水地表为规划绿地,总透水地表面积为35.423 0 hm2。不透水地表由道路(81.842 8 hm2)和建筑物(206.909 5 hm2)组成,总不透水地表面积为288.752 3 hm2。得出透水与不透水地表的比率为1∶8。
如果按此规划实施,那么这种高度不透水的发展结果是大量受污染的雨水径流将排入海港,加剧洪水泛滥。计算新结构规划下的流域雨水排放量,可采用推理公式法[12](计算建设一个储存和处理湿地所需的容积,采用TP10[19])。通过推理公式法计算得到:2年一遇的径流排放流量将为5.95 m3/s,此径流所需的储存和处理湿地面积为32 140.04 m3;10年一遇的径流排放流量为8.71 m3/s,所需湿地的存储量为47 019.68 m3;100年一遇的径流排放流量为13.95 m3/s,所需的湿地存储量为75 350.53 m3。
3)拉拉瓦拉流域环境修复。为了改善城市化对沿海水域的环境影响,有必要了解流域的水文行为。首先通过ArcGIS制图确定场地所在流域的结构、形状和大小,这些数据可以转换为一系列的制图过程,以显示流域边界和地表径流路径网络。通过制图过程,可以确定流域的大小、透水与不透水地表的比率。然后,通过推理公式法预测场地及周边增加的降雨径流量。具体方法为:计算新规划住宅的建筑基底总面积,这部分面积为增加的不透水地表面积,进而计算出增加的雨水径流量。一旦建立了住房密度与透水/不透水地表比率的联系,就可以调整住房密度和透水/不透水比率的关系,以保证更大的渗透率,同时确保计划的住宅户数保持不变。
2.2.3 步骤三:拉拉瓦拉子流域韧性
可以通过减少不透水地表的面积来改善因雨水排放增加而造成的环境破坏;道路和住房等基础设施的拆除也将增加透水地表的面积,从而提高场地吸收雨水径流的能力。
1)景观。增加流域透水地表的一种方法是通过在河流和地表径流路径周围建立至少宽25 m的缓冲区来保护和增强现有的河流网络;保护沿海边缘是另一项重要的环境措施,30 m的沿海缓冲区将提供43 hm2的用地(图9-1)。这两项措施使流域内的透水地表面积增加了128 hm2。这种干预措施还可以增加沿溪流廊道和为海滨边缘开发新公园系统(图9-2)。
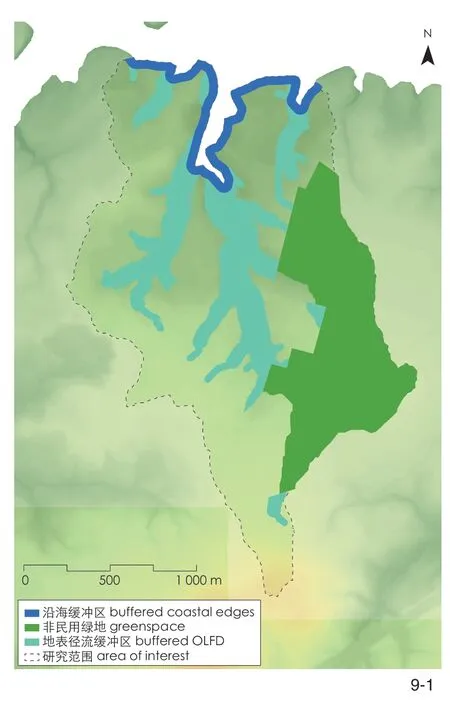
9-1 拉拉瓦拉地表径流缓冲区和沿海缓冲区Rarawara buffered OLFP and buffered coastal edges

9-2 拉拉瓦拉绿地系统Rarawara green space syste
为实现这两项措施,需要改变住房建筑基底,即将低密度区从100 hm2减少到23 hm2,并将中密度区从82 hm2略微减少到74 hm2。
2)拉拉瓦拉子流域城市设计。要满足增加透水地表和减少雨水排放量的目标,意味着住宅数量的损失。根据奥克兰市议会的结构规划,流域内的低密度住宅数量为2 008户,中密度为2 743户,合计4 751户(无高密度住宅)。为扩大透水地表面积,低密度区的住宅数量将减少到473户,中密度区的住宅数量将减少到2 471户,住宅数量的缺口为1 807户。
解决这种住房短缺的一种方法是用公寓代替缺失的低密度住宅。此方案将增加1 468户公寓(高密度住宅),将总住宅户数提高到4 412户。通过使建筑物更密集或更高来增加公寓数量,可以弥补1 807个住宅量缺口甚至更多,从而提供更好的房地产投资回报(图10)。
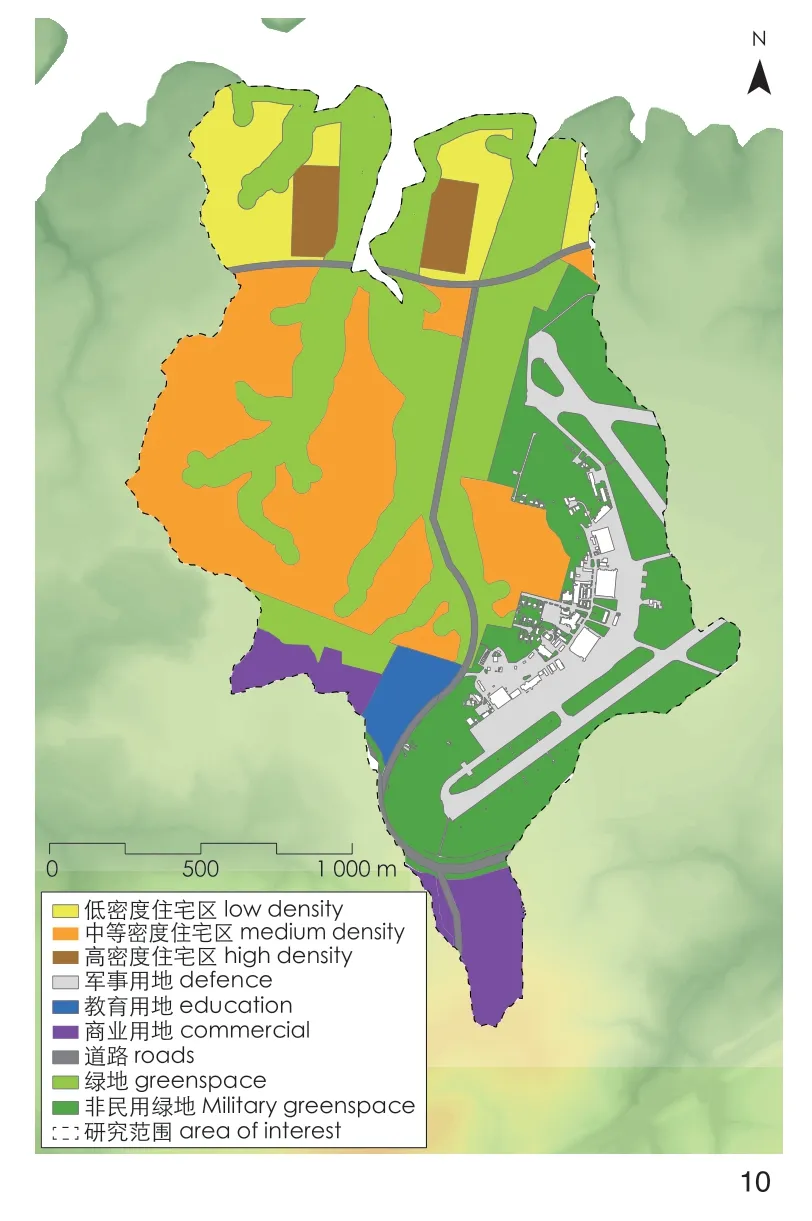
10 拉拉瓦拉新的总体布局Rarawara new master plan
新公寓可以位于现有河口周围的沿海地区。在低密度区域内8.8 hm2的用地内规划2个高密度公寓区(图11)。
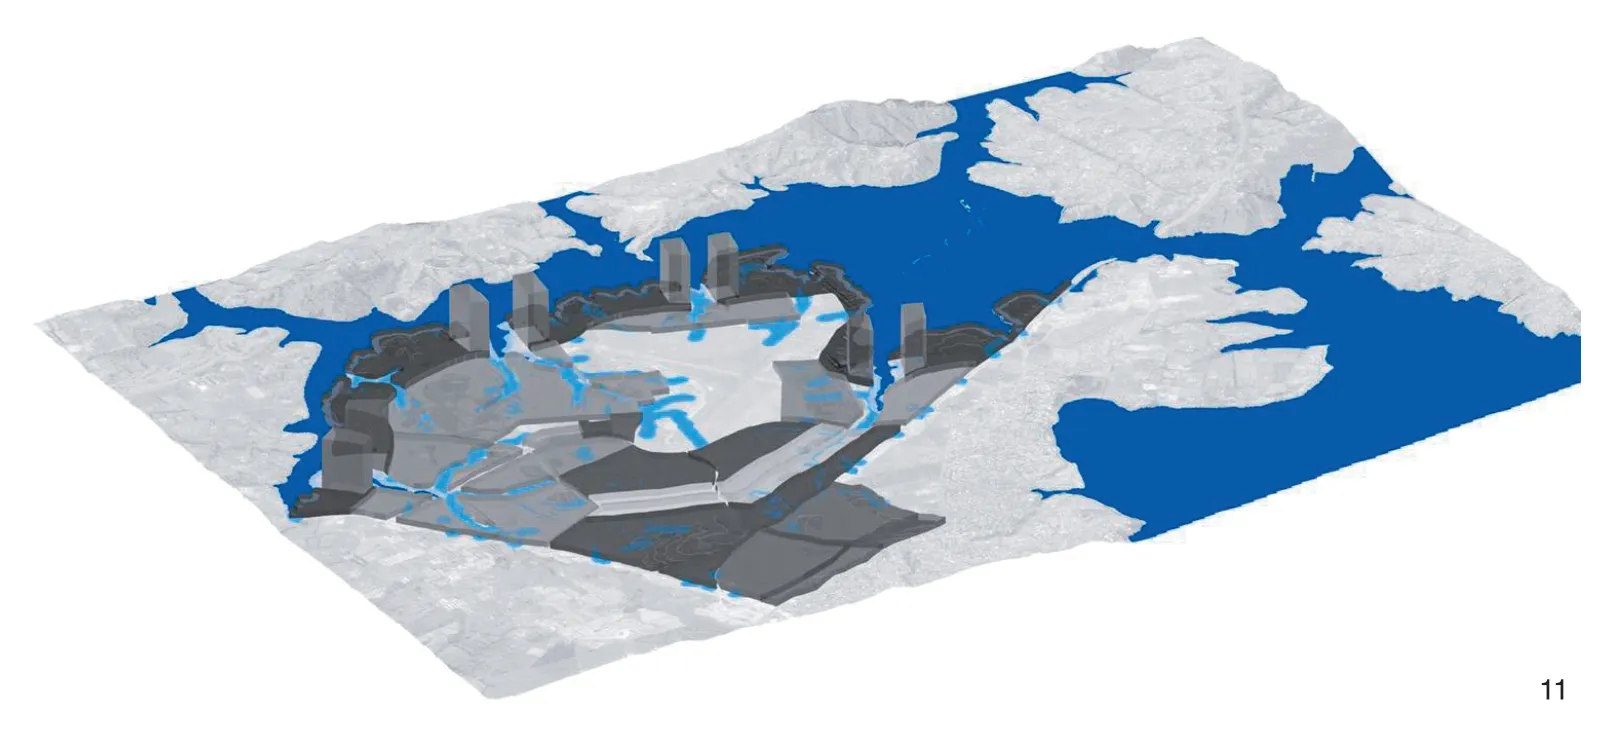
11 拉拉瓦拉城市设计效果图Rarawara urban design perspective
透水/不透水比率:在新规划的用地布局中,拉拉瓦拉流域的总面积为324.175 3 hm2,其中透水地表的面积为128.001 0 hm2,不透水地表由道路(65.928 9 hm2)和建筑物(130.235 3 hm2)构成,总不透水地表为196.164 2 hm2,得出透水与不透水地表的比率为2∶3。
3)拉拉瓦拉子流域径流。使用推理公式法,新透水地表产生的2年一遇径流的排放流量为29 304 m3,相比之下,原址的排放量为26 468 m3,而奥克兰市议会的结构规划则为32 140 m3;在10年一遇的径流排放量计算中,新规划的排放量为42 871 m3,原址的排放量为38 722 m3,而奥克兰市议会结构规划的排放量为47 020 m3;在100年一遇的径流排放中,新规划的排放量为68 702 m3,而原址排放量为62 053 m3,奥克兰市议会结构规划的排放量为75 351 m3(表1)。
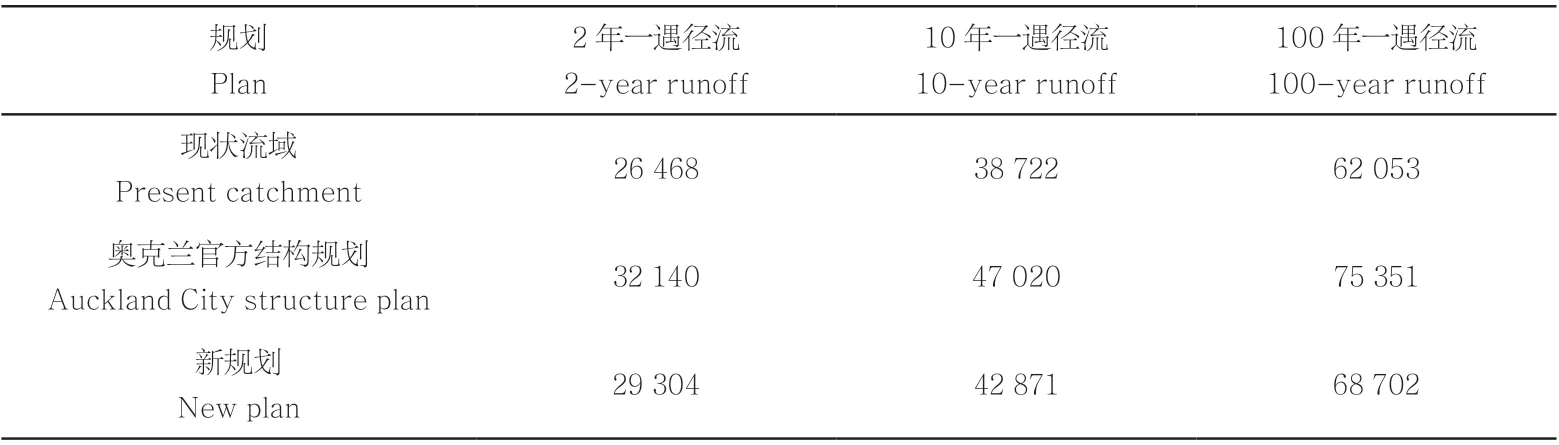
表1 拉拉瓦拉流域径流Tab.1 Rarawa Catchment Run off m3
2.3 新绿色基础设施城市设计过程的影响
2.3.1 设计过程的环境影响
1)溪流系统。新规划的水文网络周围的缓冲区保证了溪流廊道的宽度来重新种植本地物种;该区域还可以用于放置结构性雨水清洁设施(特别是湿地和雨水花园)。这个溪流带还可以加深从沿海岸边缘到腹地的联系,并创造一个生态廊道。
在新滨河区附近规划的住宅区也将有助于提升房地产价值。新水网公园的边缘设置中等密度的住宅中,业主可以欣赏到水景和原生植被景观。新滨河区以及从海岸到腹地的连接为场地中部的业主提供了通达海岸的机会。
2)沿海地区。建立沿海缓冲区将保护该地区的关键环境,既可以恢复和保护关键的河岸生态,也可以减轻该地区海平面上升造成的破坏。
2.3.2 城市设计
在沿海及河流水文网络周围建立保护性缓冲区将提高拉拉瓦拉流域吸收降雨的能力,避免增加进入怀特玛塔港上游的径流,并减缓和减轻洪水。为确保达到相同的经济回报(按照奥克兰市议会结构规划的规定建造相同数量的住宅户数),可建造更多建筑基底较小的公寓来弥补减少的中低密度住房。其强调了独特的沿河景观:多层公寓楼穿插在底层的住宅和庭院景观中。
2.3.3 韦努阿佩流域拉拉瓦拉案例研究的环境影响
新的城市绿色基础设施规划(图10)展示了如何通过建立缓冲区来保护海岸线和溪流廊道。这一设计有3个成效。1)植物缓冲带具有保护水文网络的作用,可以清洁受污染的雨水和洪水,保护河流的水质。2)沿水文网络规划的绿地系统增加了透水地表的比例,确保更多的降雨能够被透水地表吸收,这一新绿色基础设施网络的社会效益是建立了一个连接腹地和海岸的新路径和公园系统。3)原规划中被新的河流和河流缓冲区网络取代的建筑面积,在新规划中由河流网络与海岸交汇处的公寓塔楼弥补。随着气候变化对环境的影响越来越持久,所有这些措施都将有助于建立未来的韧性。
3 结论
气候变化将对城市环境产生破坏性影响。在完全了解气候变化的影响力之前,绿色基础设施在实践中往往被用作传统基础设施的替代品,即用混合生态结构取代工程性结构。笔者认为,绿色基础设施概念发展的方向是考虑将城市设计为超绿色基础设施。也就是说,将城市本身嵌入一个更大的生态系统中。要针对性地解决气候变化对城市的影响,必须转变传统理念,通过流域规划、GIS制图和标准水文计算来改变设计城市的方法。并将这些方法应用到城市设计中,既尊重和利用了现有水文系统,设计出新型的城市绿色基础设施系统,又可以创造出更加开放、绿色的城市形态。我们认为,用绿色基础设施引导城市设计,将有助于创造更安全、更具韧性同时更具社会效益的城市。
本研究突破了传统的绿色基础设施方法在适应气候变化方面的局限性。笔者提出的绿色基础设施城市主义理念探索了绿色基础设施的新概念。这一理念可充分发挥绿色基础设施的潜力:不仅形成一个能吸收更多雨水的绿色网络,而且为新的城市形态建立一个超绿色的开放结构。这种方法将绿色基础设施的设计推到了城市设计过程的最前沿,从根本上转变了传统绿色基础设施的地位:即从后城市建设的补救措施转变为规划前的设计出发点。
本研究使用的方法是基于流域的方法,它使用水文流域作为分析单元来捕捉气候变化的全部水文影响。该城市绿色基础设施设计过程为设计师提供了一个有效的工具来识别新的城市发展可能产生的环境问题。设计技术如增加透水地表、保护现有水文网络和簇群建筑形态等,为从事新城开发工作的设计师提供了易于遵循的指南。
本研究以新西兰韦努阿佩的城市发展为例,展示了这种城市绿色基础设施设计方法如何帮助设计师识别韦努阿佩流域和拉拉瓦拉子流域内的水文模式。设计过程展示了绿色基础设施网络是如何通过识别水文模式形成的,以及绿色基础设施系统如何引导城市形态的设计。由此产生的总体规划优先考虑气候变化适应策略,同时不影响建筑项目和房地产回报。
随着未来气候变化的影响不断升级,本研究提出的城市绿色基础设施的概念将拓展绿色基础设施的传统认知及其解决气候相关问题的潜力。基于流域的设计过程及相关技术为我们改变设计新城的方式提供了更多的可能性,使它们能够适应气候变化的持续影响。虽然研究对象位于新西兰,但我们认为绿色基础设施城市主义的概念和基于流域的设计方法非常适用于在中国各地的城市中建立对气候变化影响的抵御能力。
注释(Notes):
①结构规划是新西兰的一类规划层次,相当于中国的分区规划:在城市片区内用不同色彩划分不同的用地布局。
②新西兰农村的典型用地类型。每个地块以农场为主,住宅占很小一部分用地。
致谢:
感谢朱凯文协助修改GIS图纸。
(编辑/王一兰)
Green Infrastructural Urbanism and Climate Change
(NZL) Matthew Bradbury, WANG Xinxin
0 Introduction
The environmental effects caused by climate change poses many challenges to the viability of both existing and proposed towns and cities.Urban flooding, stormwater contamination and urban heat island effect have become critical global issues with the advent of climate change. green infrastructure is considered an effective tool in mitigating the existing negative environmental impacts of urbanism, can the concept of GI be extended to help build resilience to the effect of climate change?
Green infrastructure is generally understood as an ecosystem service provided by native vegetation and water systems within urban spaces.As a term, it was first used in the 1990s to refer to “greenways” or “greenways network” around the USA cities[1]. In recognition of its multiplefunctionality and potential benefits to the built environment, green infrastructure was promoted worldwide, and was given different definitions by researchers, practitioners and policy-makers[2].A recent definition broadens the scope of green infrastructure as “comprise of all natural, seminatural and artificial networks of multifunctional ecological systems within, around and between urban areas, at all spatial scales”[3].
Many cities have made attempts to mitigate environmental problems, especially urban flooding, with GI based solutions. In response to the Copenhagen flood event of 2011, the civic authorities developed an urban strategy to use parks as flood detention zones and replanned streets as conveyance corridors. In the design of Hans Tavsens Park, Copenhagen the landscape architects developed a green infrastructure system that consists of chains of sunken pools and planting, to ease neighbourhood flooding and purify stormwater.The project created a new ecosystem that protects residents from flooding, and generated new social spaces for people to enjoy[4].
In Italy, responding to air pollution and flooding, two new parks have been designed to replace existing railway infrastructure. Two railway yards to the north and south of Milan have been designated as a green zone and a blue zone. The green zone purifies air pollutants and reduces urban heat brought by the prevailing wind; the blue zone cleans stormwater and improves biodiversity.Working together, they act as green infrastructures to restore urban ecology and provide extra recreational space[5].
Green infrastructure is increasingly being thought of as a way to mitigate the environmental impact of climate change. Research suggests that green infrastructure can be used to mitigate the effects of urban flooding and stormwater contamination[2]. In the context of stormwater management, green infrastructure is usually presented as wetland, ponds, rain gardens, swales,green roofs, and pervious pavements[6]. These interventions can also help improve biodiversity[7],modify urban microclimate[8]and reduce carbon footprints[9].
We suggest that these writings and case studies position GI as primarily an engineering practice,substituting the conventional urban infrastructure of roads and drains with a green infrastructure such as the recreation of indigenous planting and the provision of natural stormwater systems. The use of this infrastructure as a new kind of social space is an added bonus that can’t be achieved with a traditional engineering infrastructure.
However, we suggest that to expand the world of GI today, to help build urban resilience to the serious deprecation of climate change, we will have to move beyond the conventional definition of green infrastructure as a system that will do the same task as conventional infrastructure while retaining the existing urban form. We suggest that we need to extend the insights that GI has given us the ability of a natural system to help build sustainable infrastructures to the actual design of the contemporary city.
It is here that we are confronted by the popular model of contemporary urban thinking which is sometimes described as, “the compact city”. This urban ideology puts forward a number of laudable urban tropes to address clearly identifiable urban problems such as the reliance on cars, the separation of work and home, the lack of public space and so on.
We suggest that one critical problem with this urban ideology is that the desired city structure, that is the building, streets, and open spaces are all hard,impervious surfaces. The lack of open green space that can absorb the expected increase in rainfall and mediate the rise in temperatures means that the contemporary compact city form will itself exacerbate by the environmental effects of climate change.
We suggest that we need to extend the ideas of GI to include rethinking the actual form of the future city. We need to rethink the city as a more open structure with zones to absorb water and allow natural hydrological systems to operate. We suggest the future of GI thinking is to establish the urban fabric as a supra green infrastructure.
The first part of this paper will introduce the idea of a catchment-based approach to urban planning. This uses the original hydrological system as the primary driver for the design of a new urban green infrastructure. The second part of the paper will present a three-step design process to prioritise the creation of an urban green infrastructure. A set of techniques that facilitate design response to climate change will be described. A greenfield site in Auckland, New Zealand at Whenuapai,will be used to demonstrate how this approach can create an urban green infrastructure that addresses multiple climate change events with a new urban form that still ensures the expected real estate return. The paper closes with a reflection on the urban green infrastructure design and its implications for city development in China that faces the challenges of climate change.
1 Design Process
To demonstrate how the key ideas of green infrastructure could be expanded to encompass the design of a new urban form to become resilient to the effect of climate change, we will outline a speculative design process for a new urban development site and how this design methodology might work in practice with a New Zealand case study.
To understand the effects of climate change on our cities we have to understand three things;firstly what will be the effect of the climate change,secondly what are the different kinds of urban development, and lastly what are the possible remediable techniques. By combining these three areas of knowledge we can develop an urban green infrastructure that will help build resistance to the effects of CC.
1.1 Step One: Inventory
The first part of an urban green infrastructure design process is defining the effect of a particular aspect of climate change within a measurable system. We suggest that the hydrological catchment[10]is a system that connects a specific landscape form, the catchment, with an urban form through measurable effects from the observation of the hydrology cycle. The first step is to build an inventory. The inventory consists of, the definition of the catchment, the location and boundaries of the development site, and the location and boundaries of the catchment. The placement of the urban development site within the catchments is further defined through aerial photos, the topography of the catchment, the vegetation,and the hydrology, in particular the overland flow paths. Of particular interest is the ratio of pervious to impervious surfaces within the catchment.Understanding this part of the behavior of the catchment is important as it is through the pervious surface that urban development site is able to absorb the increased rainfall that will be brought by climate change.
1.2 Step Two: Development
The second section of the urban GI design process is concerned with an understanding of the mechanics of the urban development process from the individual development site to the master plan. Understanding this process gives an ability to measure the development process through financial metrics. The urban development potential of a site within a catchment can be measured in several ways. The financial return of the individual site can be understood with simple development ratios, the gross floor area (GFA) and the floor area ratio (FAR)[11]. Simply speaking, the relationship of the individual development site to the building footprint can be manipulated in different ways according to several external criteria, typically, local authority guidelines and the development yield or return.
We suggest that the adoption of an urban green infrastructure design process can be made through the manipulation of the FAR provision to increase the amount of pervious surface in exchange for an increase in the building height.Thus, increased resilience to the effect of climate change can be made on the single development site.
The development potential of a larger urban site, either green field or brown field, can be understood through the development of structure plans and master plans. These show how a site might be developed to different degrees; from simple zoning layouts to detailed infrastructure layouts with building distribution diagrams.
The implication for building resilience to climate change for the urban development plan can be analysed in several ways. For a green field site,an understanding of the hydrological implications of a new development can be understood by simply measuring the ratio of permeable and impervious surface for a development site before development and post development. There is a range of different hydrological software that can be used to demonstrate how the hydrological balance of a site will be affected by the impact of climate change on the structure plan development.
The impact of climate change on a more sophisticated masterplan can be tested by superimposing the plan over the existing site inventory. Some of the environmental implication of the master plan can be understood in the way the proposed urban development might,for instance, block an overland flow path, thus preventing the conveyance of future flooding,or the way a development might be flooded by sea level rise. The implication of an increase of impervious surfaces can also be understood through the use of the rational method[12]as well as the use of several software programmes.
Constructing an urban green infrastructure design process that will build resilience to the environmental effects of climate change starts by placing urban development within a hydrologic catchment. In this way the examination of the existing environmental conditions of the site and the impact of climate change on the hydrological system, can be inventoried. By placing the development site, from an individual site to a structure plan within the hydrological catchment,the implication of the different urban forms can be both mapped and measured.
1.3 Step Three: Resilience
Once the effects of climate change on a new urban development are understood, several remediation strategies can be explored to help build an urban green infrastructure. These can be divided into two parts, landscape and architectural.Into these categories fall the actual techniques used to develop the shape of the new urban green infrastructure. Some of the techniques that can be used are derived from LIUDD techniques[13]. The LIUDD goals and techniques are: making the best use of the existing infrastructure, minimizing the effects of the development through site selection,matching the development to the carrying capacity of the ecosystem and minimizing the energy inputs and outputs within the catchment. These goals are developed through the use of specific strategies:protecting terrestrial and marine biodiversity through protecting existing sensitive areas on the development site; trying to maintain the natural hydrology of the catchment; reducing or containing contaminants on the development site through the restoration and protection of the natural landscape;and developing new kinds of urban form to help retain or create pervious space by clustering the building programme.
These techniques can be modelled using GIS software. Protecting the existing hydrological pattern of the site can be achieved by identifying the overland flow paths that run through the development site from the greater catchment and using the buffering function to ensure a protected riparian corridor. The littoral can also be protected by establishing a buffer zone to the harbour/river edge. The design consequences of these operations are varied, for example, the buffered overland flow path (OLFP) could be used for pluvial flooding conveyance and detention. The OLFP could also be planted with indigenous vegetation to help encourage evapotranspiration and lower the urban heat island effect. The buffered OLFP network could also be used to locate stormwater treatment devices such as wetlands to treat stormwater from the larger catchment[14]. The buffered coastal edges could help to form and locate soft barriers to coastal flooding.
The net effect of these remediation techniques on the catchment can be measured through a recalculation of the permeable/impermeable surface ratio. The consequences are the development of an urban green infrastructure that is more open and greener with several remediatory regimes to help build urban resilience to the effects of climate change.
The implication of this new urban green infrastructure on the conventional real estate programme requires a change in thinking about how the required amount of GFA to make the project financially viable might be allocated.This can be accomplished through the LIUDD strategies of clustering the building programme.By recalculating the GFA into a new FAR, a reconfigured building footprint driven by the dictates of the environmental remediation programme, the financial returns of the original real estate investment can be accomplished. The urban and architectural consequences of the reconfigured urban programs can be modeled in ArcGIS, graphically represented through the extrusion of the proposed building footprint.
2 Case Study
To demonstrate how the development of a new urban green infrastructure could work, a proposed greenfield development study in New Zealand will be discussed. This is a proposal for a new urban development to be located at Whenuapai, Auckland, New Zealand. The study demonstrates the applicability of the three-stage urban green infrastructure design process in dealing with the environmental problems that climate change will have on city. The study demonstrates the way in which these problems can be ameliorated through a three-stage design process.
The case study begins with the identification of what environmental problems are likely to be engendered by the new urban development.Through a study of the catchment at two scales,the main environmental problems are identified as an increase in flooding and the production and entry of contaminated stormwater into the existing hydrological system and thence into the receiving environment.
The second stage of the process is identified the development zones and the environmental implication that the development will have on the catchment. The Rational Method[12]was used as a technique to understand the impact that the ratio of impervious to pervious surfaces within the catchment, before and after the development,would have on the production of stormwater and flooding. The second technique was to protect the existing hydrological network from the entry of contaminated stormwater and flooding. The specific technique was to buffer the existing stream systems. This operation was carried out using GIS mapping and analysis to identify the existing hydrological network, the streams and overland flow paths, then, using the buffering function in ArcGIS, make protection zones around each OLFP and stream[15]. The effect of this operation was to also increase the amount of pervious surface.
The third technique was to cluster the urban form. By acknowledging and buffering the existing hydrological system, the loss of development GFA was inevitable. Clustering the development GFA into a new urban form was a way of ensuring that the projected real estate programme didn’t make for a financial loss[16]. The result for the urban design of the Whenuapai case study was to assemble the “missing”GFA into apartment blocks at the intersection of the stream system with the littoral.
2.1 Whenuapai
Whenuapai is a new urban district planned to the west of Auckland, New Zealand (Fig. 1).Whenuapai is located on the southern side of the upper Waitamata Harbour, with Brigham’s Creek forming a boundary to the west and State Highways 16 and 18 forming the southern and eastern edges of the site. The greater part of the site is a moderately flat plateau approximately 25 m above sea level. An airfield, the Whenuapai Aerodrome,dominates this plateau.
2.1.1 Whenuapai Site Analysis
1)Hydrology. Whenuapai can be divided into eight major catchments (Fig. 2-1). These catchments are eight a number of streams: the Brigham,Rarawara and Waiarohei Creeks. Ten watercourses discharge into the harbour. The average annual rainfall in Whenuapai is 1,333.5 mm, and the average monthly rainfall is 111.1 mm. The average rainfall in January, the driest month, is 79.3 mm.The wettest month is June, with an average rainfall of 147.8 mm.
2)Aspect/Slope. The aspect of Whenuapai is mostly northerly with an east-west division along the sides of the stream corridors (Fig. 2-2).The slope of the majority of the site is flat (0 to 5 degrees); however, alongside some of the stream corridors, the slope increases from 5 to 16 degrees(Fig. 2-3).
3)Vegetation. The site was originally clad in New Zealand’s native coastal forest. The typical vegetation of the coastal edge of the Whenuapai catchment is characterised as belonging to the Kowhai-Kotare Harbour Coastline Ecosystem[17].The dominant tree species areMetrosideros excelsa,Sophora microphylla,Dysoxylum spectabile,Vitex lucens,Agathis australis,Corynocarpus laevigatusandAlectryon excelsus. Shrub species includePittosporum crassifolium,Astelia chathamica,Pittosporum tenuifolium, andMyoporum laetum.
2.1.2 Whenuapai Structure Plan
Auckland is undergoing rapid urban growth.More than 1,000,000 new citizens are expected to arrive in Auckland over the next 20 years.As a consequence of this growth, there is an acute housing shortage. Whenuapai is located adjacent to SH16, an important motorway in the western growth corridor and near the new NorthWest Shopping Centre. Whenuapai also neighbors the successful Hobsonville housing development, making Whenuapai the next site for future urban development. To address the urban pressure Auckland is facing, the Auckland Council developed an urban structure plan for Whenuapai to help conceptualize the shape of future urban development[18]. The structure plan efficiently zones the available land according to proximity to infrastructure; industrial land and an apartment zone located adjacent to the main transport routes,SH16 and 18. Lower density housing zones are located nearer to the edge of the Waitemat Harbour. Single-storey housing with large sites is zoned for the coastal margin, while more intensive housing (medium density) is zoned between the coastal edge and the industrial zone (Fig. 3).
The proposed structure plan will cause a number of environmental problems including an increase in stormwater contamination and flooding;these conditions will be heightened by the effects of climate change. To explore the impact of these effects, a sub-catchment of the larger Whenuapai catchment was chosen as a case study site. The selected site was the Rarawara sub-catchment to both understand the consequences of the proposed urban development and develop strategies to remediate the impact on the environment.
2.2 Rarawara Sub-catchment
2.2.1 Step One: Rarawara Sub-catchment Inventory
The 324 ha Rarawara catchment located in the north of the Whenuapai catchment (Fig. 4). It is a moderately flat site bounded to the north by the Waitemat Harbour. To the west, the site is defined by the Brigham Creek/Pitoitoi stream catchment, to the east by Whenuapai village and airfield, and to the south, by the intersection of SH16 and 18 (Fig. 5).
1)Vegetation. The predominant vegetation in the catchment is grass, the result of the rural economy of the catchment. The other vegetation types are decorative gardens around the housing areas and shelterbelt species from the small horticulture and orchard blocks.
2)Hydrology. The catchment drains into the dominant stream, the Rarawara Creek. The creek runs roughly north-south and bisects the catchment. There are three sub-catchments.The stream exits into an estuarine mouth before connecting to Waitemat Harbour. There are smaller streams from the hinterland to the coast on either side of the Rarawara catchment (Fig. 6).
3)Aspect/Slope. The aspect of the Rarawara catchment is mostly northerly with an east-west division along the sides of the stream corridors (Fig.7-1). The slope of the majority of the site is flat, 0 to 5 degrees, especially the aerodrome site (Fig.7-2).However, alongside the stream corridors, the slope increases from 5 to 16 degrees.
4)Land Use. The land of the catchment is separated into two uses. The first is suburban housing, large lifestyle houses and sections on the northern coastal edge and a smaller subdivision to the west of the airfield. The rest of the catchment is made up of rural lifestyle blocks and small horticulture and orchard blocks.
5)Pervious/Impervious Ratio. Due to its mostly rural nature, the catchment is largely made of pervious surfaces (Fig.7-3). The impervious areas are the roading infrastructure and the airfield(Fig.7-3). The existing Rarawara catchment area is 324.175,3 hm2. The impervious surface area is made up of roads (81.842,8 hm2) and buildings(20.100,4 hm2). The total impervious surface area is 101.943,2 hm2. The total pervious surface area is 220.026,5 hm2. Giving a ratio of pervious to impervious of 2∶1.
2.2.2 Step Two: Rarawara Sub-catchment Development
1)Rarawara Structure Plan. The effect of the Auckland Council’s Whenuapai structure plan on the Rarawara catchment is to configure the catchment into four housing zones and an industrial zone. The area closest to the coast is zoned for low-density,single-storey housing, along an approximately 100 hm2coastal margin. Allowing for one dwelling unit (DU) per 500 m2gives 2,008 DUs, and 50 hm2of impervious surfaces. A medium-density housing zone of 82 hm2is planned behind the coastal zone.Allowing for one DU per 300 m2equals 2,743 DU,giving 61 hm2of impervious surface. The remaining area is zoned industrial/commercial with two apartment zones to the east of the airfield zone.Three parks are proposed of approximately 35 hm2in total. Roads and proposed and existing housing make up 212 hm2of impervious surface (Fig. 8).
2)Rarawara Catchment: Environmental Problems. With the construction of the new housing and the associated infrastructure, the hydrological pattern of the existing territory will be irrevocably changed; increased runoff with increased sedimentation will add to already high levels of sedimentation in the upper Waitemat Harbour. Runoff will also be polluted from roading contaminants and roof debris.
In the Auckland Council structure plan the impervious surface in the Rarawara catchment will increase markedly. The existing Rarawara catchment area is 324.175,3 hm2. The impervious surface area is made up of roads (81.842,8 hm2), and buildings(206.909,5 hm2). The total impervious surface area is 288.752,3 hm2. The total pervious surface area is 35.423,0 hm2. Giving a ratio of pervious to impervious of 1∶8.
If this plan were built, then the result of this high degree of imperviousness would be a large amount of contaminated stormwater runoff discharging into the harbour. And an increase in flooding.
To calculate the volume of stormwater that would be discharged from the catchment under the new structure plan, the Rational Method can be used[12](To calculate the required volume for the construction of a storage and treatment wetland, TP10[19]is used). The runoff discharge flow rate over two years (m3/s) would be 5.95 m3/s.The required storage and treatment wetland for this runoff is sized at 32,140.04 m3. For a tenyear runoff discharge flow rate of 8.71 m3/s, the required storage volume is 47,019.68 m3. For a 100-year runoff discharge flow rate of 13.95 m3/s, the required storage volume is 75,350.53 m3.
3)Rarawara Sub-catchment Environmental Remediation. To ameliorate the effects of urbanization on the coastal receiving environment,an understanding of the hydrological behavior of the catchment is necessary. The first step is to determine the structure and shape and size of the catchment on the site through mapping with ArcGIS. This data can be manifested as a series of maps showing catchment boundaries and a network of overland flow paths. From this mapping, the size of the catchment and the ratio of impervious to pervious surface can be determined. Using the Rational Method, an understanding of the amount of increased rainfall runoff with the expanded site can be gained. By measuring the increase in impervious surface due to the number and type of housing zones, the increase in stormwater runoff can be calculated. Once the connection of housing density to the impervious/pervious surface ratio is established, the different zoning densities and associated impervious/pervious ratios can be manipulated to allow for greater permeability, while at the same time ensuring that the planned number of dwelling units remains the same.
2.2.3 Step Three: Rarawara Sub-catchment Resilience
The environmental damage from an increase in stormwater discharge into the upper Waitemat catchment can be ameliorated through decreasing the amount of impervious surfaces. The removal of infrastructures such as roads and housing will lead to an increase in the amount of pervious surface, leading to an increase in the absorption of stormwater runoff.
1) Landscape. One way to increase the pervious surface of the catchment is by protecting and enhancing the existing stream network by establishing a protective buffer zone of at least 25 m around the stream and overland flow paths(Fig. 9-1). Protection of the coastal edge is another important environmental measure; a buffer of 30 m would give a zone of 43 hm2(Fig. 9-1). These two measures increase the area of pervious surfaces within the catchment by 128 hm2. This intervention also has the effect of developing a new park system along the stream corridors and the waterfront coastal edge (Fig. 9-2).
Accommodating these two measures necessitates a change in the housing footprint. This is accomplished by decreasing the low-density zone from 100 hm2to 23 hm2, and decreasing the mediumdensity zone slightly, from 82 hm2to 74 hm2.
2) Rarawara Catchment: Urban Design. To accomplish the increase in pervious surfaces and the consequent decrease in stormwater discharge means a loss of housing units. Under the Auckland Council structure plan, the number of low-density DUs in the catchment is 2008 and medium density is 2,743, equaling 4,752 DUs (with no provision for high-density units). By enlarging the pervious surface area, the number of DUs in the low-density zone will drop to 473 DUs and in the medium density zone to 2,471 DUs. The shortfall in DUs will be 1,827.
One solution to this real estate shortfall is to substitute apartments for the missing lower density DUs.
This solution will increase the number of DUs to 1,468, making a total of 4,420. By increasing the number of apartments by making the building denser or higher, the shortfall of 1,827 DUs could be matched or even surpassed to give a better real estate return (Fig. 10).
The new apartments could be located in the coastal zone around the existing stream mouth; an area of 8.8 hm2would provide two high-density apartment zones within the low-density area. See perspective (Fig. 11).
Pervious/impervious ratio: The Rarawara catchment area (324.175,3 hm2). Impervious surface of 196.164,2 hm2, roads (65.928,9 hm2)and buildings (130.235,3 hm2). Pervious surface,128.001 hm2. Giving a ratio of pervious to impervious of 2∶3.
3) Rarawara Catchment Runoff. Using the Rational Method, the effect of the new pervious surfaces will lead to a two-year runoff discharge flow rate of 29,304.150,42 m3, compared to the discharge of 26,468.264,89 m3from the original site and 32,140.035,94 m3discharge with the proposed Auckland Council structure plan.
In the ten-year runoff discharge, the flow rate of the new plan is 42,870.886,72 m3, compared to the discharge of 38,722.091,23 m3from the original site and 47,019.682,21 m3from the proposed Auckland Council plan.
In the 100-year runoff discharge, the flow rate of the new plan is 68,701.952,65 m3,compared to 62,053.376,59 m3in the original site and 75,350.528,71 m3in the Auckland Council proposed plan (Tab. 1).
2.3 Implication of the New Green Infrastructure Urban Design Process
2.3.1 Environmental Implications of the Design Process
1) Stream Network. A buffer zone around the revealed hydrological network will enable the stream corridors to be revegetated with native species. The zone also gives the opportunity to allow for the location of structural stormwater cleaning instruments — in particular, wetlands and a rain garden — which can all be installed within the new zone. This stream zone can form a deep connection from the coastal edge to the hinterland,creating an ecological corridor.
Having housing adjacent to the new river zone will also help to increase real estate values. By locating medium-density housing along the edges of the new stream parks, owners can enjoy views of the water and native vegetation. The nature of the new river zones and the link from the coast to the hinterland provide the opportunity for owners in the centre of the development to have access to the coast.
2) Coastal Zone. Establishing a coastal buffer zone means that the critical environmental conditions in this zone will be protected. Critical riparian ecologies can be restored and protected, and damage from the effects of sea level rise in this zone can be ameliorated.
2.3.2 Urban Design
Establishing a protective buffer zone around the coastal and stream hydrological networks will increase the ability of the Rarawara catchment to absorb rainfall, rather than add to runoff into the upper Waitemat Harbour and to slow and dimmish flooding. To ensure the same economic return is met — that the same number of DUs is constructed as specified in the Auckland Council structure plan — the loss of low- and mediumdensity housing is met by a greater number of apartments with a smaller footprint. The result will be a low-rise domestic landscape of gardens and houses broken by apartment towers that emphasise the unique stream system.2.3.3 Whenuapai Catchment: Environmental Implications of the Rarawara Case Study
The new urban green infrastructure plan (Fig.10) shows how the coastline and stream corridors are protected through buffering. There are three consequences of this action. The first is that the vegetative buffers have the effect of protecting the hydrological network by protecting the streams from the influx of contaminated stormwater and flooding. The second effect is that the ratio of impervious to pervious surface is relaxed,ensuring that more rainfall is able to be absorbed by the uncovered ground. A social consequence of this new green infrastructure network is the establishment of a new path/park system that links the hinterland of the subdivision with the coast. The third consequence of this action is the clustering of the GFA that has been displaced by the new stream/buffer stream network into a series of apartment towers located at the intersection of the stream networks and the coast. All these measures will help build future resilience as the environmental effects of climate change become more and more persistent.
3 Conclusion
Climate change will have a devastating impact on our urban environment. Before the knowledge of the transformative power of climate change was fully known, green infrastructure was successfully articulated as a practice in which conventional infrastructural systems could substituted by hybridised ecological structures. This paper argues that the next step in the development of the concept of green infrastructure is to think about the design of the city as a supra green infrastructure. That is,the city itself is embedded in a larger ecological system. To move to this conceptual position which specifically addresses the impact of climate change, involves the use of several readily available techniques, catchment planning, GIS mapping, and standard hydrological calculations.The consequences of these operations are to develop a new urban green infrastructure design process, in which the subsequent city form is more open, greener, and recognises existing hydrological systems. We suggest that the potential for rethinking the city as a green infrastructure is both a safer and more resilient city and at the same time a city with an increased social realm.
This paper examined the limitations of the conventional green infrastructure approach to climate change adaptation. The concept of green infrastructural urbanism presented in the paper explored a new concept of GI. This idea has the potential to exploit the full capacity of GI: not only to form a green network that absorbs more stormwater, but to establish a supra green open structure for a new urban form. This approach moves the design of green infrastructure to the forefront of the urban design process, presenting a radical shift from conventional green infrastructure design as remediation measure to that of the post city construction.
The methodology described in this paper is a catchment-based approach, which uses the hydrological catchment as the analytical unit to capture the full hydrological implication of climate change. This urban green infrastructure design process provides an effective tool for designers to identify the environmental issues that are likely to be engendered by a new urban development. Design techniques described here,such as increasing pervious surface, protecting the existing hydrological network, and clustering the building form, offer an easy-to-follow guide for designers who are working on greenfield developments.
Using the urban development of Whenuapai,New Zealand as a case study, the paper showcases how this urban GI design method can help the designer to identify hydrological patterns within the Whenuapai catchment and the Rarawa subcatchment. The design process demonstrated how a green infrastructure network was formed by identifying the hydrological pattern and how the green infrastructure system subsequently reconfigured the urban form. The resulting masterplan prioritized climate change adaptation strategies, without compromise the building programme and real estate return.
As the effects of climate change escalate in the future, the concept of an urban green infrastructure will shed a light on a broader definition of green infrastructure and its potential to address climate related issues. The catchmentbased design process and its associated techniques have great potential to change the way we design new cities, making them resilient to the ongoing consequences of climate change. While the study is located in New Zealand, we believe that the concept of Green Infrastructural urbanism and the catchment-based design approach is very applicable to building resilience to the effects of climate change in cities across China.
Acknowledgments:
We would like to thank Kevin Zhu for editing the GIS maps.
(Editor / WANG Yilan)