Performance and transcriptomic response of the English grain aphid,Sitobion avenae,feeding on resistant and susceptible wheat cultivars
2021-12-14LANHaoZHANGZhanfengWUJunCAOHeheLlUTongxian
LAN Hao,ZHANG Zhan-feng,WU Jun,CAO He-he,LlU Tong-xian
Key Laboratory of Northwest Loess Plateau Crop Pest Management of Ministry of Agriculture and Rural Affairs,Northwest A&F University,Yangling 712100,P.R.China
Abstract Plant resistance against insects mainly depends on nutrient restriction and toxic metabolites,but the relative importance of nutrition and toxins remains elusive. We examined performance,nutrition ingestion,and transcriptome response of the English grain aphid,Sitobion avenae,feeding on resistant Xiaoyan 22 (XY22) and susceptible Xinong 979 (XN979) wheat cultivars. Aphids had lower body weight and fecundity when feeding on XY22 than on XN979,although the phloem sap of XY22 had a higher nutritive quality (in terms of amino acid:sucrose ratio). Aphids feeding on XY22 also had a lower honeydew excretion rate than those on XN979,suggesting that aphids ingested less phloem sap from XY22. The transcriptome data showed 600 differentially expressed genes (DEGs),and 11 of the top 20 KEGG pathways significantly enriched in DEGs were involved in nutrient metabolism. We found 81 DEGs associated with the metabolism of sugars,lipids,and amino acids,59 of which were significantly downregulated in aphids feeding on XY22. In contrast,there were 18 DEGs related to detoxifying metabolism,namely eight UDP-glucuronosyltransferases,six cytochromes P450 monooxygenases,one glutathione S-transferase,two ATP-binding cassette transporters,and one major facilitator superfamily transporter; 12 of these were upregulated in the aphids feeding on XY22. Our results indicated that both the quantity and quality of phloem nutrition available to aphids are critical for the growth and development of aphids,and the higher resistance of XY22 is mainly due to the reduction in phloem sap ingested by aphids,rather than toxic metabolites.
Keywords:plant-aphid interaction,transcriptome response,nutrition restriction
1.lntroduction
To counter herbivore attack,plants have developed an array of defensive mechanisms that can act directly by producing specialized morphological structures or secondary metabolites and proteins that are toxic,repellent,and/or antinutritional for herbivorous (direct defense),or indirectly through the release of specific volatiles to attract natural enemies (indirect defense) (Wybouwet al.2015;Aljbory and Chen 2018; Waret al.2018; Huanget al.2019).Actually, chemical defense responses are the most common response,and a vast array of toxic secondary compounds have been identified to date,such as terpenes,phenolics,alkaloids,and nonprotein amino acids (Ramseyet al.2010; Zhanget al.2013; Speedet al.2015; Huanget al.2019). Herbivores must survive exposure to the chemically challenging or toxic environments of their host plants and have in turn evolved various ways to overcome plant defenses or even use them for their own benefit (Heidel-Fischer and Vogel 2015).
Herbivores have evolved a common set of detoxifying enzymes and xenobiotic transporters to counteract xenobiotics (Liet al.2007; Heidel-Fischer and Vogel 2015; Yuet al.2016). The detoxification process of insects is traditionally divided into three phases. Phase I:direct metabolism reduces (or rarely increases) the biological activity of various substrates by oxidationreduction or hydrolysis of enzymes,such as cytochrome P450 monooxygenases (P450s) and carboxylesterases(Hosokawa 2008). Phase II:conjugation occurs,which involves the combination of enzymes and hydrophilic molecules to convert allelochemicals into water-soluble compounds by interacting with the enzymes of Phase I,including glutathioneS-transferases (GSTs) and UDPglucuronosyltransferases (UGTs) (Liet al.2007). Phase III:translocation occurs,which involves the excretion of the conjugated compounds by transmembrane proteins that can specifically conjugate with toxins,like the ATPbinding cassette (ABC) transporters (Reddyet al.2012).Furthermore,the transporters of the major facilitator superfamily (MFS) also play a significant role in the xenobiotic metabolism of herbivores (Celorio-Manceraet al.2013; Wybouwet al.2015). Thus,the effect of toxic metabolites in plant resistance to insects becomes complex owing to the counter-defenses of insects.
Plant resistance to phloem feeders is not always correlated with toxic metabolites (Niemeyer 2009; Eleket al.2013). Hydroxamic acids (HAs),natural defense compounds found in cereals,exhibit negative effects against aphids,and a number of previous reports have shown an association between HAs and wheat resistance against aphids (Niemeyer 2009; Makowskaet al.2015;Handricket al.2016; Züst and Agrawal 2016). However,Pereiraetal(2017) found that the levels of HAs in leaves are not directly correlated with wheat resistance against the English grain aphidSitobionavenae(F.). Moreover,aphids generally prefer and grow on more nutritious tissues,such as young leaves and reproductive tissues,though these tissues contain high levels of defensive metabolites (Gouldet al.2007). Plant phloem sap is the main food source for aphids,which has been considered to be a poor diet,because of the large amount of sucrose and few amino acids (Douglas 2003). The phloem amino acids are the principal nitrogen source for aphids,and their concentration and composition significantly influence the growth and reproduction of aphids (Douglas 2003). Therefore,phloem amino acids are considered to be the key limiting factor for aphid performance.
Sitobionavenae,is a major pest of wheat worldwide,causing substantial wheat yield losses through the direct effects of feeding and by vectoring plant viruses (Fiebiget al.2003; van Emden and Harrington 2007). To determine the relative importance of nutrition and toxins in wheat resistance against aphids,we examined the performance ofS.avenaefeeding on resistant Xiaoyan 22 (XY22) and susceptible Xinong 979 (XN979) wheat cultivars,measured the amino acid and sugar concentration in phloem of wheat plants and aphids,and compared the expression of genes associated with metabolic detoxification and nutrient metabolism inS.avenae. The aphid honeydew excretion rate and relative abundance ofBuchnerawere also quantified.
2.Materials and methods
2.1.Plants and insects
The wheat seeds were germinated on moist filter paper in Petri dishes (15 cm in diameter) at (25±2)°C for 2 days.Wheat seeds were grown in plastic pots (12.5 cm in diameter)in a climate chamber ((22±1)°C,16 h L:8 h D photoperiod,(60±10)% relative humidity (RH)) for rearing aphids,and one wheat seedling was grown in a 7-cm-diameter paper cup.Sitobionavenaeused in all experiments were initially established on XN979 from a single viviparous apterous female adult from the Key Laboratory of Applied Entomology,Northwest A&F University (Yangling,Shaanxi,China). The aphids feeding on XN979 were transferred to XY22 and Aikang 58 (AK58) and cultured for >10 generations.
2.2.Aphid performance assay
To determine the development time (pre-reproductive period),fecundity,and weight ofS.avenaefeeding on XN979 and XY22,one apterousS.avenaeadult selected from XN979 or XY22 was introduced to the first leaf of 6-dayold XN979 or XY22 seedlings caged with a transparent plastic cylinder (30 cm in height,6 cm in diameter) covered with nylon mesh at the top. After 12 h,the adult was removed,leaving one first-instar nymph on the first leaf.Each nymph was checked and molting events were recorded every 12 h until they developed into adults. Adults were weighed on a micro-balance (Sartorius MSA 3.6P-000-DM,Gottingen,Germany). Then,these adults were transferred to new 6-day-old seedlings,and the number of nymphs produced by an adult was counted,and all newborn nymphs were removed every 24 h to avoid overcrowding. Thirty-two replicates were performed for each wheat cultivar.
To eliminate parent effects of aphids on performance assay,we usedS.avenaereared on wheat variety AK58.One apterous adult reared on AK58 was caged on a 6-dayold XN979 or XY22 wheat seedling,and the number of nymphs produced by the adults was counted every 24 h,and all newborn nymphs were removed for 5 days. Thirtytwo successful replicates were obtained for different wheat cultivars.
2.3.Honeydew excretion assay
To investigate the aphid feeding rate on different wheat cultivars,we measured the dry weight of honeydew excreted by the aphids feeding on XN979 and XY22. Two apterous adults feeding on AK58 were confined to the back of the first leaf with a clip cage. After 24 h,all nymphs produced by adults were removed,and one piece of dried and weighed aluminum foil was inserted into the inner surface of each clip cage. The clip cage was placed beneath the aphids so that honeydew dropped onto the aluminum foil. After 24 h,the aluminum foil was oven-dried at 50°C for 30 min,and was weighed on a micro-balance. A total of 10 replicates were carried out for each wheat cultivar.
2.4.Buchnera abundance analysis
To determine the relationship between the symbiotic microorganisms in aphids fed on different wheat cultivars,we measured the relative abundance of the bacterial symbiontBuchnerain 9-day-oldS.avenaefeeding on XN979 and XY22. Samples (about 10 mg aphids per sample) were washed twice with alcohol to remove the microorganisms on the surface of the aphids and then washed twice with ddH2O to remove the residual alcohol. Then,the genomic DNA was extracted from the whole body of apterous aphids using the M5 Universal DNA Mini Kit (Mei5 Biotechnology Co.,Ltd.,China) according to manufacturer’s instructions.Freshly extracted DNA from aphids was diluted in 11 ng μL-1for quantitative real-time PCR (qPCR). 16S rRNA and EF1-α were selected as the target gene and the reference gene,respectively (Appendix A; Chunget al.2018). There were ten replicates for each treatment.
qPCR was conducted on a LightCycler® 480 System(Roche,USA). The DNA diluted to 50-fold was used as templates to detect the relative expression of the target genes in a 20-μL reaction system containing 9 μL of DNA,0.5 μL of both forward and reverse primers,10 μL of 2×SYBR PremixEx TaqII (Tli RNaseH Plus; TaKaRa,Japan) under the following conditions:5 min at 95°C,followed by 40 cycles of 10 s at 95°C and 30 s at 60°C. In this process,there were three biological replicates analyzed for each sample,and each replicate contained three technical replicates.
2.5.Amino acid and sugar analysis
To investigate the relationship between nutrition quality and wheat cultivar,we measured the amino acid and sugar contents in the phloem sap of XN979 and XY22. We used an EDTA-facilitated exudate method to collect the phloem sap (Weibullet al.1990; Thieleet al.2008). The first leaves of 2-week-old wheat seedlings were quickly cut with a blade at 1 cm above the intersection of the branch and the first leaf,and the petioles of the cut leaves were immediately immersed in a 1.5-mL centrifuge tube with 1 mL of 5 mmol L-1EDTA solution (pH=7.0) for 2 h in a dark incubator (24°C,100% RH; eight replicates for each treatment). There were three leaves in each centrifuge tube,and the tube opening was sealed with sealing film. To determine the amino acid:sugar molar ratio in the phloem,we used the LTQ-XL linear ion trap mass spectrometer (Thermo Fisher Scientific,Waltham,MA,USA) to analyze the concentrations of amino acids and sugars (sucrose,glucose,and fructose),as previously described (Caoet al.2016).
To investigate the nutrient differences between aphids feeding on different wheat cultivars,we measured the amino acid and sugar content in 9-day-old aphids feeding on XN979 and XY22,and in aphids feeding on AK58 after being transferred to XN979 and XY22 for 4 days. Amino acids and sugars in aphids were extracted by grinding about 10 mg of aphids in a 990-μL mixture containing 50 mmol L-1HCl and 10 μmol L-1leucine with a glass mortar and pestle and were analyzed as described above (Thieleet al.2008).We also analyzed the concentration of trehalose,as well as sucrose,glucose,and fructose. There were eight replicates for each treatment.
2.6.Transcriptome analysis
Sample collection and RNA extractionTotal RNA was extracted from the whole body of 9-day-oldS.avenaefeeding on XN979 and XY22 using RNAiso Plus (TaKaRa,Japan),following the manufacturer’s instructions. The quality and concentration of RNA were confirmed using a NanoDrop 2000c Spectrophotometer (Thermo Scientific,CA,USA). Part of the total RNA was sent to Novogene Bioinformatics Technology Co.,Ltd.(Beijing,China) for library preparation and Illumina sequencing. The raw data sets have been submitted to the NCBI Sequence Read Archive database (SRA accession:SRP241323).The other part was reverse transcribed into cDNA using a PrimeScriptTM RT Reagent Kit with gDNA eraser (Perfect Real Time; TaKaRa,Japan) following the manufacturer’s instructions,and cDNA templates were stored at -80°C for qPCR analysis to verify the reliability of transcriptome results.
Data analysisTo ensure the quality of information analysis,it is necessary to filter the raw reads to obtain clean reads,such as by removing the reads with adapters or removing the reads with an N ratio>10% (N means that the base information cannot be determined) and removing lowquality reads (>50% of nucleotides with Qphred). Then,all subsequent analyses were based on clean reads. SinceS.avenaehas no reference genome,Trinity (Grabherret al.2011) was used to splice the clean reads to obtain the reference sequence (ref) for subsequent analysis. We used Corset (Davidson and Oshlack 2014) to hierarchically cluster the transcripts,and the longest Cluster sequence was obtained after hierarchical clustering for subsequent analysis.
To obtain comprehensive information on gene function,we used seven databases to annotate gene functions,including NCBI nonredundant proteins (Nr),NCBI nonredundant nucleotides (Nt),protein families (Pfam),eukaryotic orthologous groups/Clusters of Orthologous Groups of proteins (KOG/COG),Swiss-prot,Kyoto Encyclopedia of Gene and Genomes (KEGG),and Gene Ontology (GO).For analyzing the gene expression level,we used the RSEM Software (Li and Dewey 2011) to map the clean reads of each sample to the reference sequence to further obtain the number of readcounts per sample compared to each gene and convert readcounts to the expected number of fragments per kilobase of transcript sequence per million base pairs sequenced (FPKM). We used DESeq2 (Loveet al.2014)for analyzing the differential expression of genes,and the screening conditions for differential genes were:Padj<0.05.To better study the function of differentially expressed genes(DEGs),we not only conducted enrichment analysis for all DEGs in each combination (GO and KEGG enrichment),but also conducted enrichment analysis for DEGs in each combination according to up-or down-regulation.
qPCR analysisTo verify the RNA-Seq data,12 target genes with annotated protein functions that were involved in detoxification and nutrient metabolic processes and were significantly differentially expressed (Padj<0.05) were selected for qPCR analysis. The specific primers of target genes and reference genes (β-actin) were designed with Online Primer Blast tools and are listed in Appendix A (Xueet al.2016). The method for qPCR was described above.
2.7.Statistical analysis
All data were analyzed using the IBM SPSS Statistics package 25 (SPSS Inc.,Chicago,IL,USA). The Student’st-test was used to compare means in all our data. The relative expression and fold changes of selected unigenes were calculated by the 2-ΔΔCTmethod.
3.Results
3.1.Performance of S.avenae
Sitobionavenaeexhibited longer development time from nymph to adult when feeding on XY22 than on XN979(t-test,P<0.001; Fig.1-A and B). AdultS.avenaefeeding on XY22 was significantly lighter by about 50% compared with those on XN979 (t-test,P<0.001; Fig.1-C). The fecundity ofS.avenaewas also significantly lower when feeding on XY22 (t-test,P<0.001; Fig.1-C). In the first 2 days after being transferred to XN979 and XY22,the number of nymphs produced by aphids feeding on AK58 was not significantly different (t-test,P<0.001; Fig.1-D). However,from the third day,the fecundity of aphids transferred to XY22 was significantly lower than that of those transferred to XN979 (t-test,P<0.001; Fig.1-D). In addition,the aphids transferred to XY22 produced about three nymphs per day in the first 4 days,while aphids transferred to XN979 produced about 4.5 nymphs per day in the third and fourth days (Fig.1-D).
3.2.Honeydew excretion and symbiotic microorganism assays
The honeydew production rate was significantly higher from aphids feeding on XN979 than those on XY22(t-test,P<0.001; Fig.2-A). Furthermore,Buchnerawere significantly more abundant in aphids feeding on XN979 than in those feeding on XY22 (t-test,P<0.001; Fig.2-B).
3.3.Amino acid and sugar assay
Except Gly and Cys,the other 18 common amino acids were detected in the phloem of wheat leaves (t-test,P<0.001;Fig.3-A). There was no difference in total amino acid content in the phloem of XN979 and XY22,but the composition of amino acids was different. In XY22,the content of Ala,Asn,Asp,Glu,and Ser was high,accounting for 78.01%(7.28,10.22,20.17,28.61,and 11.73%,respectively),while in XN979,only two amino acids (Asp and Glu) had high content,which accounted for 60.13% (16.49 and 43.64%,respectively) (t-test,P<0.001; Fig.3-A). In addition,the molar ratio of amino acid:sucrose in the phloem sap of XY22 was significantly higher compared with that of XN979 (t-test,P<0.001; Fig.3-B).
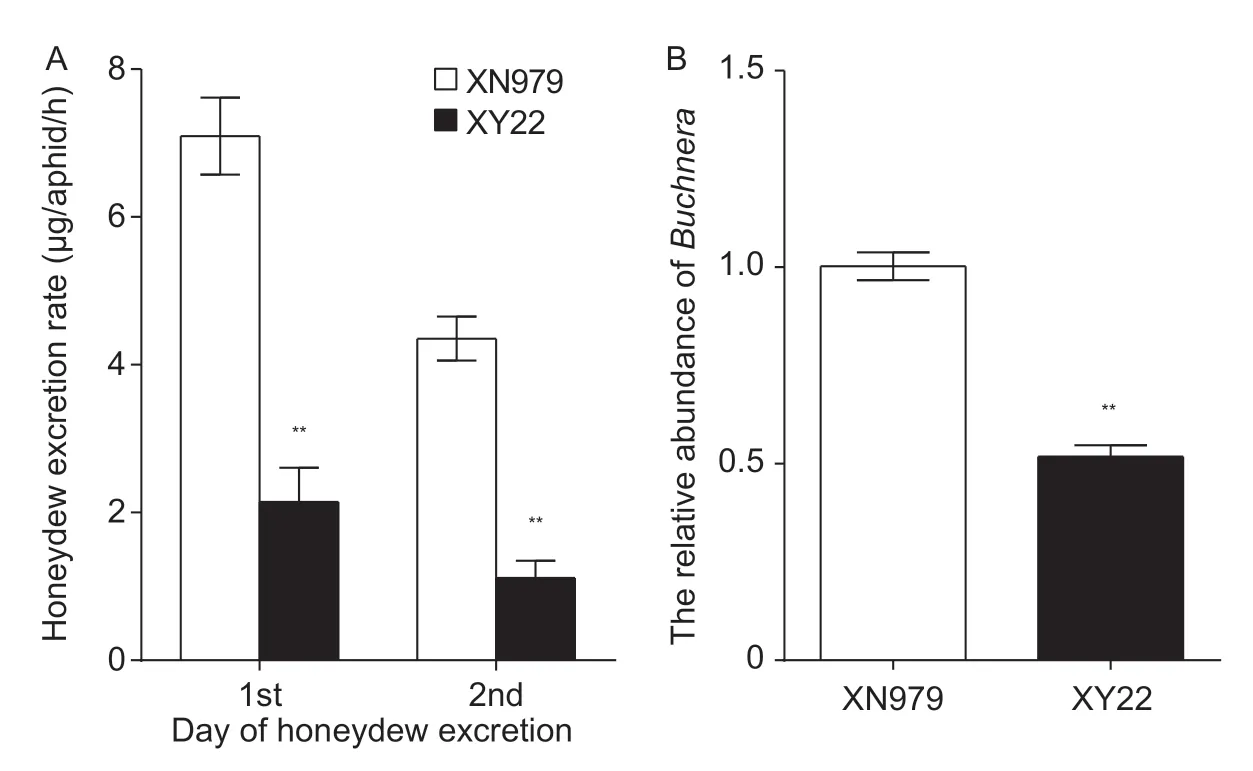
Fig.2 The honeydew excretion rate (A) and relative abundance of Buchnera (B) of Sitobion avenae feeding on resistant Xiaoyan 22 (XY22) and susceptible Xinong 979 (XN979) wheat cultivars. Values are mean±SE (n=10). **,significant difference at P<0.01 (Student’s t-test).
Twenty amino acids were detected in the aphids feeding on XN979 and XY22,and there were 11 amino acids with significant differences,including five essential amino acids(His,Lys,Thr,Trp,and Val) and six non-essential amino acids (Ala,Asn,Asp,Gln,Gly,and Cys) (t-test,P<0.001;Fig.4-A). There were eight amino acids higher in the aphids feeding on XY22 than those on XN979,namely Ala,Asn,Gln,Gly,Cys,Lys,Thr,and Val,whereas three amino acids were lower than those on XN979,namely Asp,His,and Trp (Fig.4-A). In addition,four sugars were detected in the aphids feeding on XN979 and XY22,namely trehalose,glucose,fructose,and sucrose. All sugars were significantly different between aphids feeding on XN979 and XY22,and the concentrations of all sugars were higher in aphids feeding on XY22 than in those on XN979,except for trehalose (t-test,P<0.001; Fig.4-B).
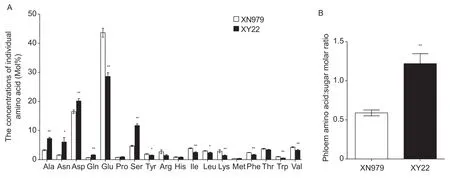
Fig.3 Nutrition quality in different wheat cultivars. The amino acid concentration (A) and amino acid:sugar molar ratio (B) in the phloem sap of resistant Xiaoyan 22 (XY22) and susceptible Xinong 979 (XN979) wheat cultivars. Values are mean±SE (n=8). *and **,significant difference at P<0.05 and P<0.01,respectively (Student’s t-test).
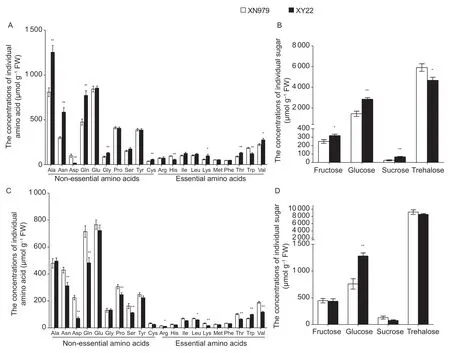
Fig.4 Nutrient differences in Sitobion avenae feeding on different wheat cultivars. A and B,the amino acid concentrations and sugar concentrations in S.avenae feeding on resistant Xiaoyan 22 (XY22) and susceptible Xinong 979 (XN979) wheat cultivars.C and D,the amino acid concentrations and sugar concentrations in S.avenae feeding on Aikang 58 wheat cultivar after being transferred to XN979 and XY22 for 4 days. Values are mean±SE (n=8). * and **,significant difference at P<0.05 and P<0.01,respectively (Student’s t-test).
Moreover,20 amino acids were also detected in the aphids feeding on AK58 after being transferred to XN979 and XY22 for 4 days,and there were 12 amino acids with significant differences,including seven essential amino acids (Arg,Ile,Leu,Lys,Thr,Val,and Trp) and five nonessential amino acids (Asn,Asp,Gln,Pro,and Ser) (t-test,P<0.001; Fig.4-C). Except for Trp,the other 11 amino acids were significantly higher in the aphids transferred to XN979 than those transferred to XY22 (t-test,P<0.001;Fig.4-C). In addition,four sugars (trehalose,glucose,fructose,and sucrose) were detected in the aphids feeding on AK58 after being transferred to XN979 and XY22 for 4 days. There were no differences in the concentrations of trehalose,fructose,and sucrose between aphids,whereas the glucose concentration was also significantly higher in aphids transferred to XY22 compared with those transferred to XN979 (t-test,P<0.001; Fig.4-D).
3.4.Transcriptome assembly and annotation
A total of 103 278 283 raw reads were generated from two aphid lineages,and over 49.88 and 50.35 million raw reads were found in transcriptome sequencing of aphids feeding on XN979 and XY22,respectively (Table 1). After the raw reads were filtered,49 876 175 and 50 349 666 clean reads were obtained,respectively. Using the merged data set,the total number of transcripts produced bydenovoassembly for theS.avenaetranscriptome was 88 769,and the mean length was 2 176 nt. The total number of unigenes was 34 236 with a mean length of 1 513 nt. All the unigenes were annotated with Nr,Nt,Pfam,KOG/COG,Swiss-prot,KEGG,and GO (Appendix B). Furthermore,39.84% ofS.avenaeunigenes were annotated in the NR database (Appendix B),and 63.3 and 22.4% of them were annotated according to the genome ofAcyrthosiphonpisumandMyzuspersicae,respectively (Appendix C).
3.5.ldentification of DEGs and differentially regulated KEGG pathways
Compared to the aphids feeding on XY22,600 differentially expressed unigenes (DEGs;Padj<0.05) were found in the aphids feeding on XN979,which included 213 downregulated genes and 387 upregulated genes(Appendix D). In the KEGG analysis,600 DEGs were assigned to 185 KEGG pathways,and the top 20 significantly enriched KEGG pathways were shown (Fig.5).Of these,11 were involved in nutrient metabolism,such assugar metabolism (6),amino acid related metabolism (2),lipid metabolism (1),and vitamin-related metabolism (2),and three pathways were related to metabolic detoxification:peroxisome,antigen processing and presentation,and lysosome.
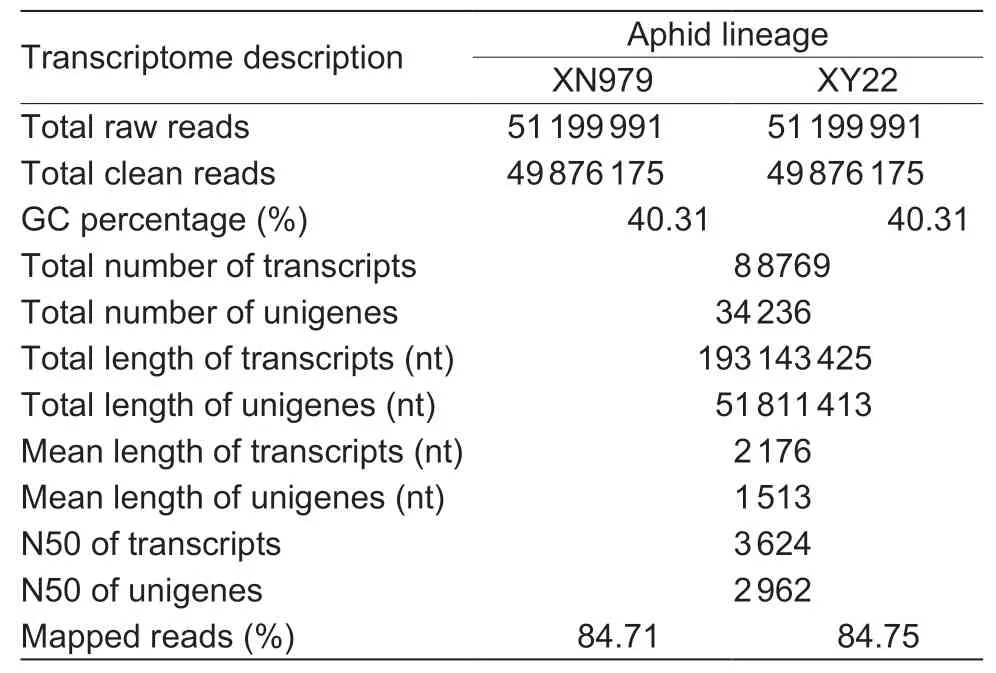
Table 1 Summary of the transcriptomes of Sitobion avenae feeding on resistant Xiaoyan 22 (XY22) and susceptible Xinong 979 (XN979) wheat cultivars
3.6.Expression analysis of nutrition-related genes
We found 81 DEGs involved in nutrient metabolism from the 600 DEGs. Based on functional categories,81 DEGs were grouped into sugar metabolism,amino acid and proteinrelated metabolism,and lipid metabolism (Fig.6-A-C).Twenty-five DEGs were associated with sugar metabolism,and only four of them were upregulated in the aphids feeding on XY22 (Fig.6-A). According to the functional annotation of DEGs,there were 24 DEGs associated with lipid metabolism,five of which were upregulated in the aphids on XY22 (Fig.6-B). For amino acid and proteinrelated metabolism,six of eight amino acid transporter genes and one of seven cathepsin genes were upregulated in the aphids on XY22 (Table 2). In addition,17 genes related to amino acid metabolism were found to be differentially expressed,and six of them were upregulated in the aphids on XY22 (Fig.6-C). In addition to the above-mentioned major nutrient metabolism-related DEGs,we also found two ecdysone 20-monooxygenase and one vitellogenin,and they were all downregulated in the aphids on XY22 (Table 2).
3.7.Expression analysis of detoxification-related genes
According to the functional annotation of DEGs,there were 16,8,1,2,and 1 member of P450s,UGTs,GSTs,ABC transporters,and MFS transporters,respectively,which were significantly differentially expressed (Table 3). Therewere 6 of 16 P450s DEGs belonging to the CYP3 clan,four of which were upregulated in aphids feeding on XY22.Furthermore,eight genes were in the CYP4 clan,showing high expression levels in the aphids feeding on XY22,while two genes belonging to the CYP27 clan were upregulated in the aphids feeding on XN979. Five of eight differentially expressed UGT genes were upregulated in the aphids on XN979. In addition,four DEGs coding for GSTs,ABC transporters,and MFS transporters were also more highly expressed in the aphids feeding on XY22.
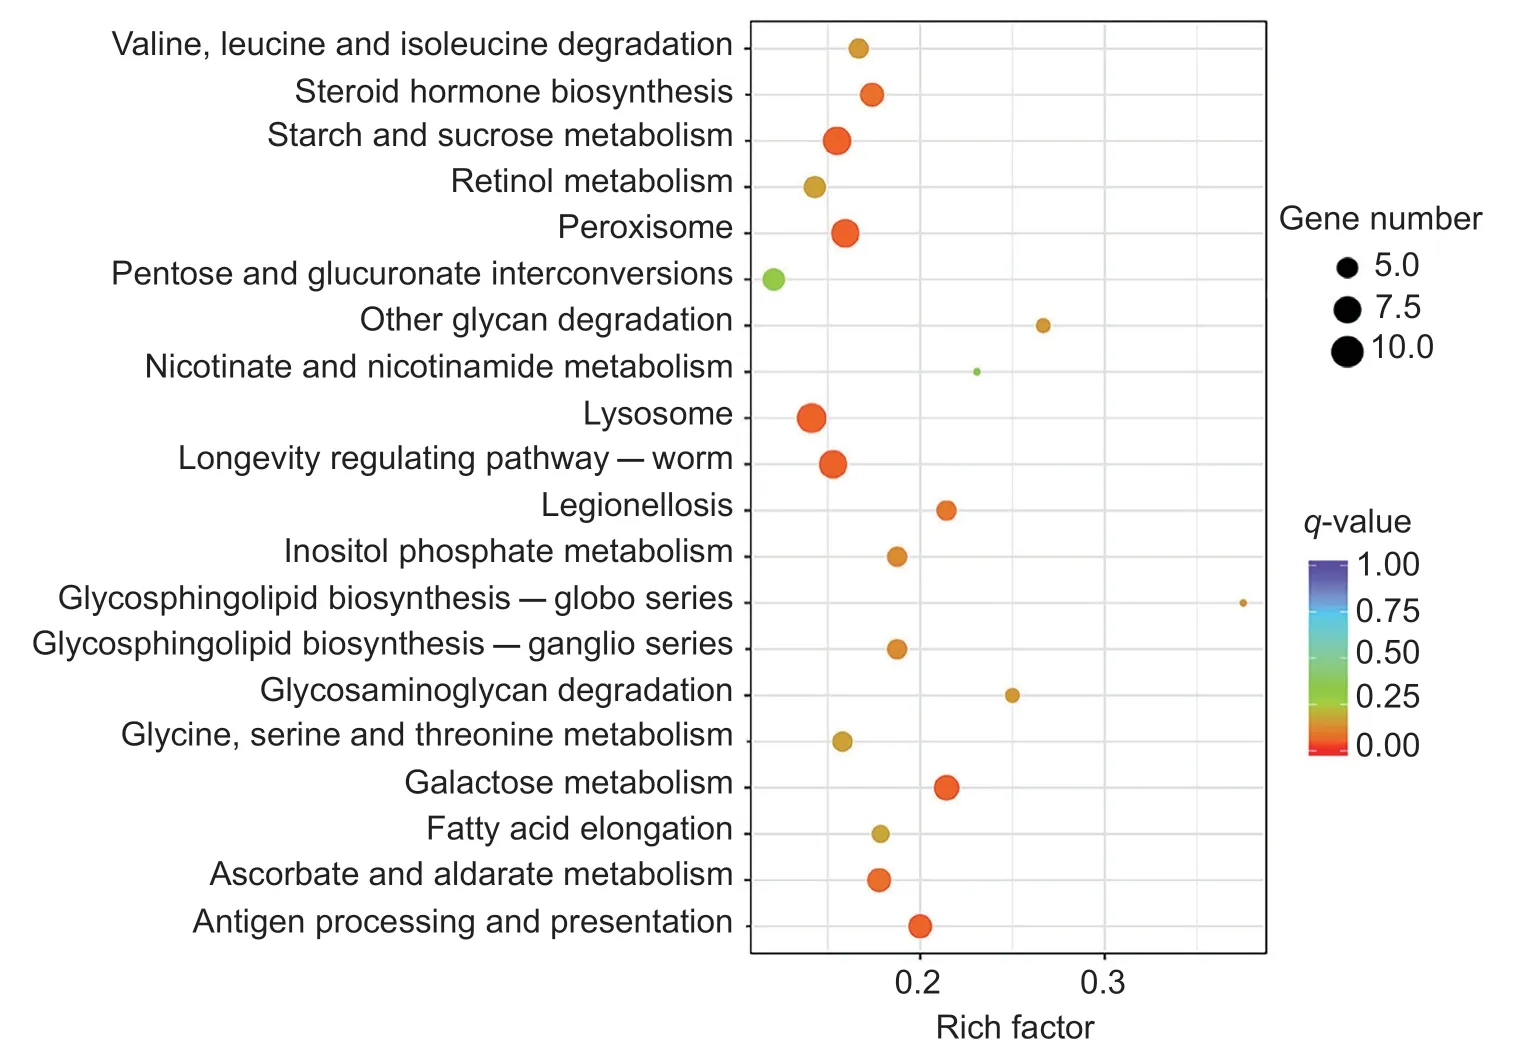
Fig.5 The top 20 significantly enriched Kyoto Encyclopedia of Gene and Genomes (KEGG) pathways of differentially expressed genes among Sitobion avenae feeding on resistant Xiaoyan 22 (XY22) and susceptible Xinong 979 (XN979) wheat cultivars.
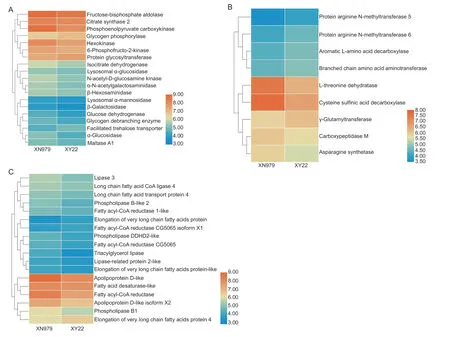
Fig.6 Expression analysis of nutrition metabolism related genes in Sitobion avenae on different wheat cultivars. A,the heat map of expression patterns of sugars metabolism in S.avenae on resistant Xiaoyan 22(XY22) and susceptible Xinong 979 (XN979) wheat cultivars. B,the heat map of expression patterns of amino acid metabolism in S.avenae on XY22 and XN979. C,the heat map of expression patterns of lipid metabolism in S.avenae on XY22 and XN979.Candidates with q-value less than 0.05 and FPKM greater than 10 were included.
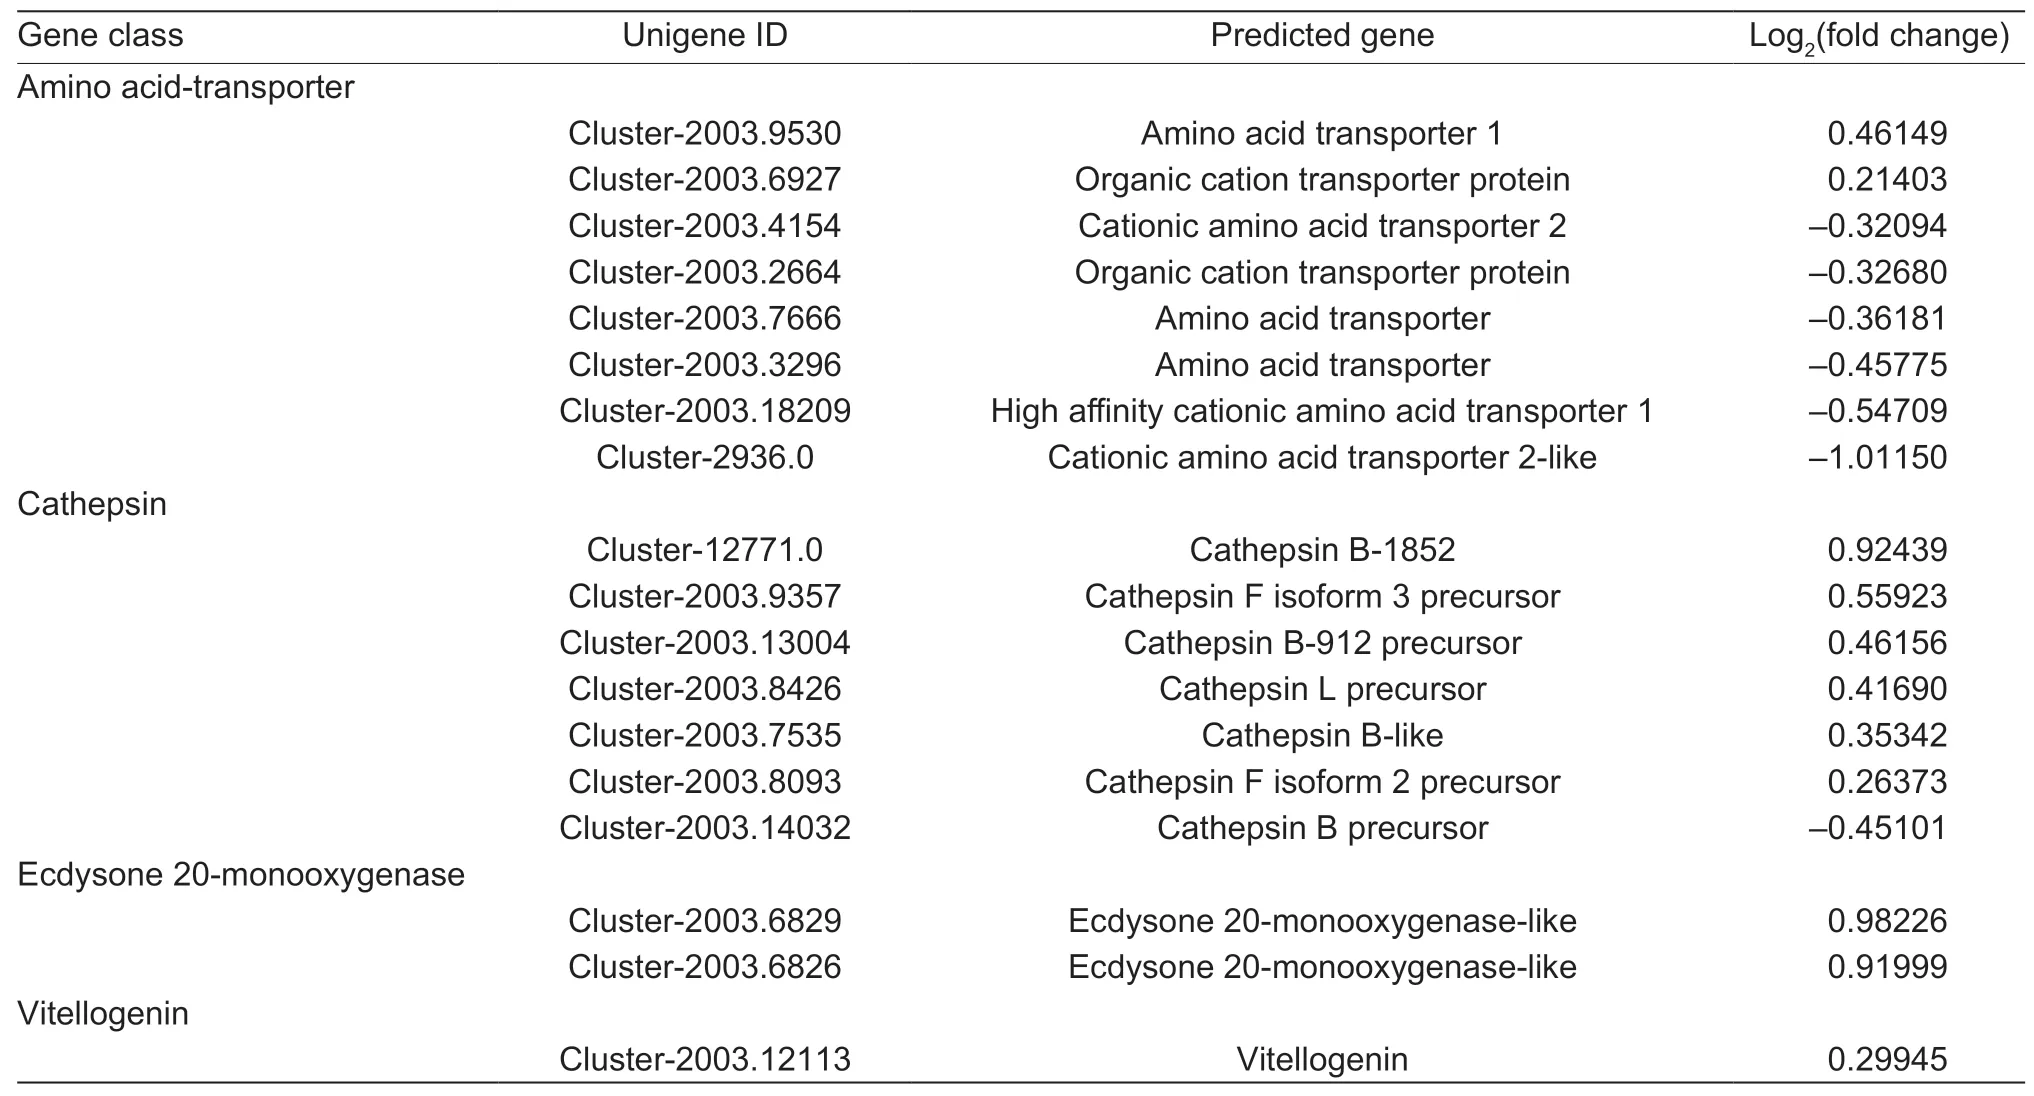
Table 2 Differentially expressed levels of additional nutrition-related genes in Sitobion avenae feeding on resistant Xiaoyan 22(XY22) and susceptible Xinong 979 (XN979) wheat cultivars
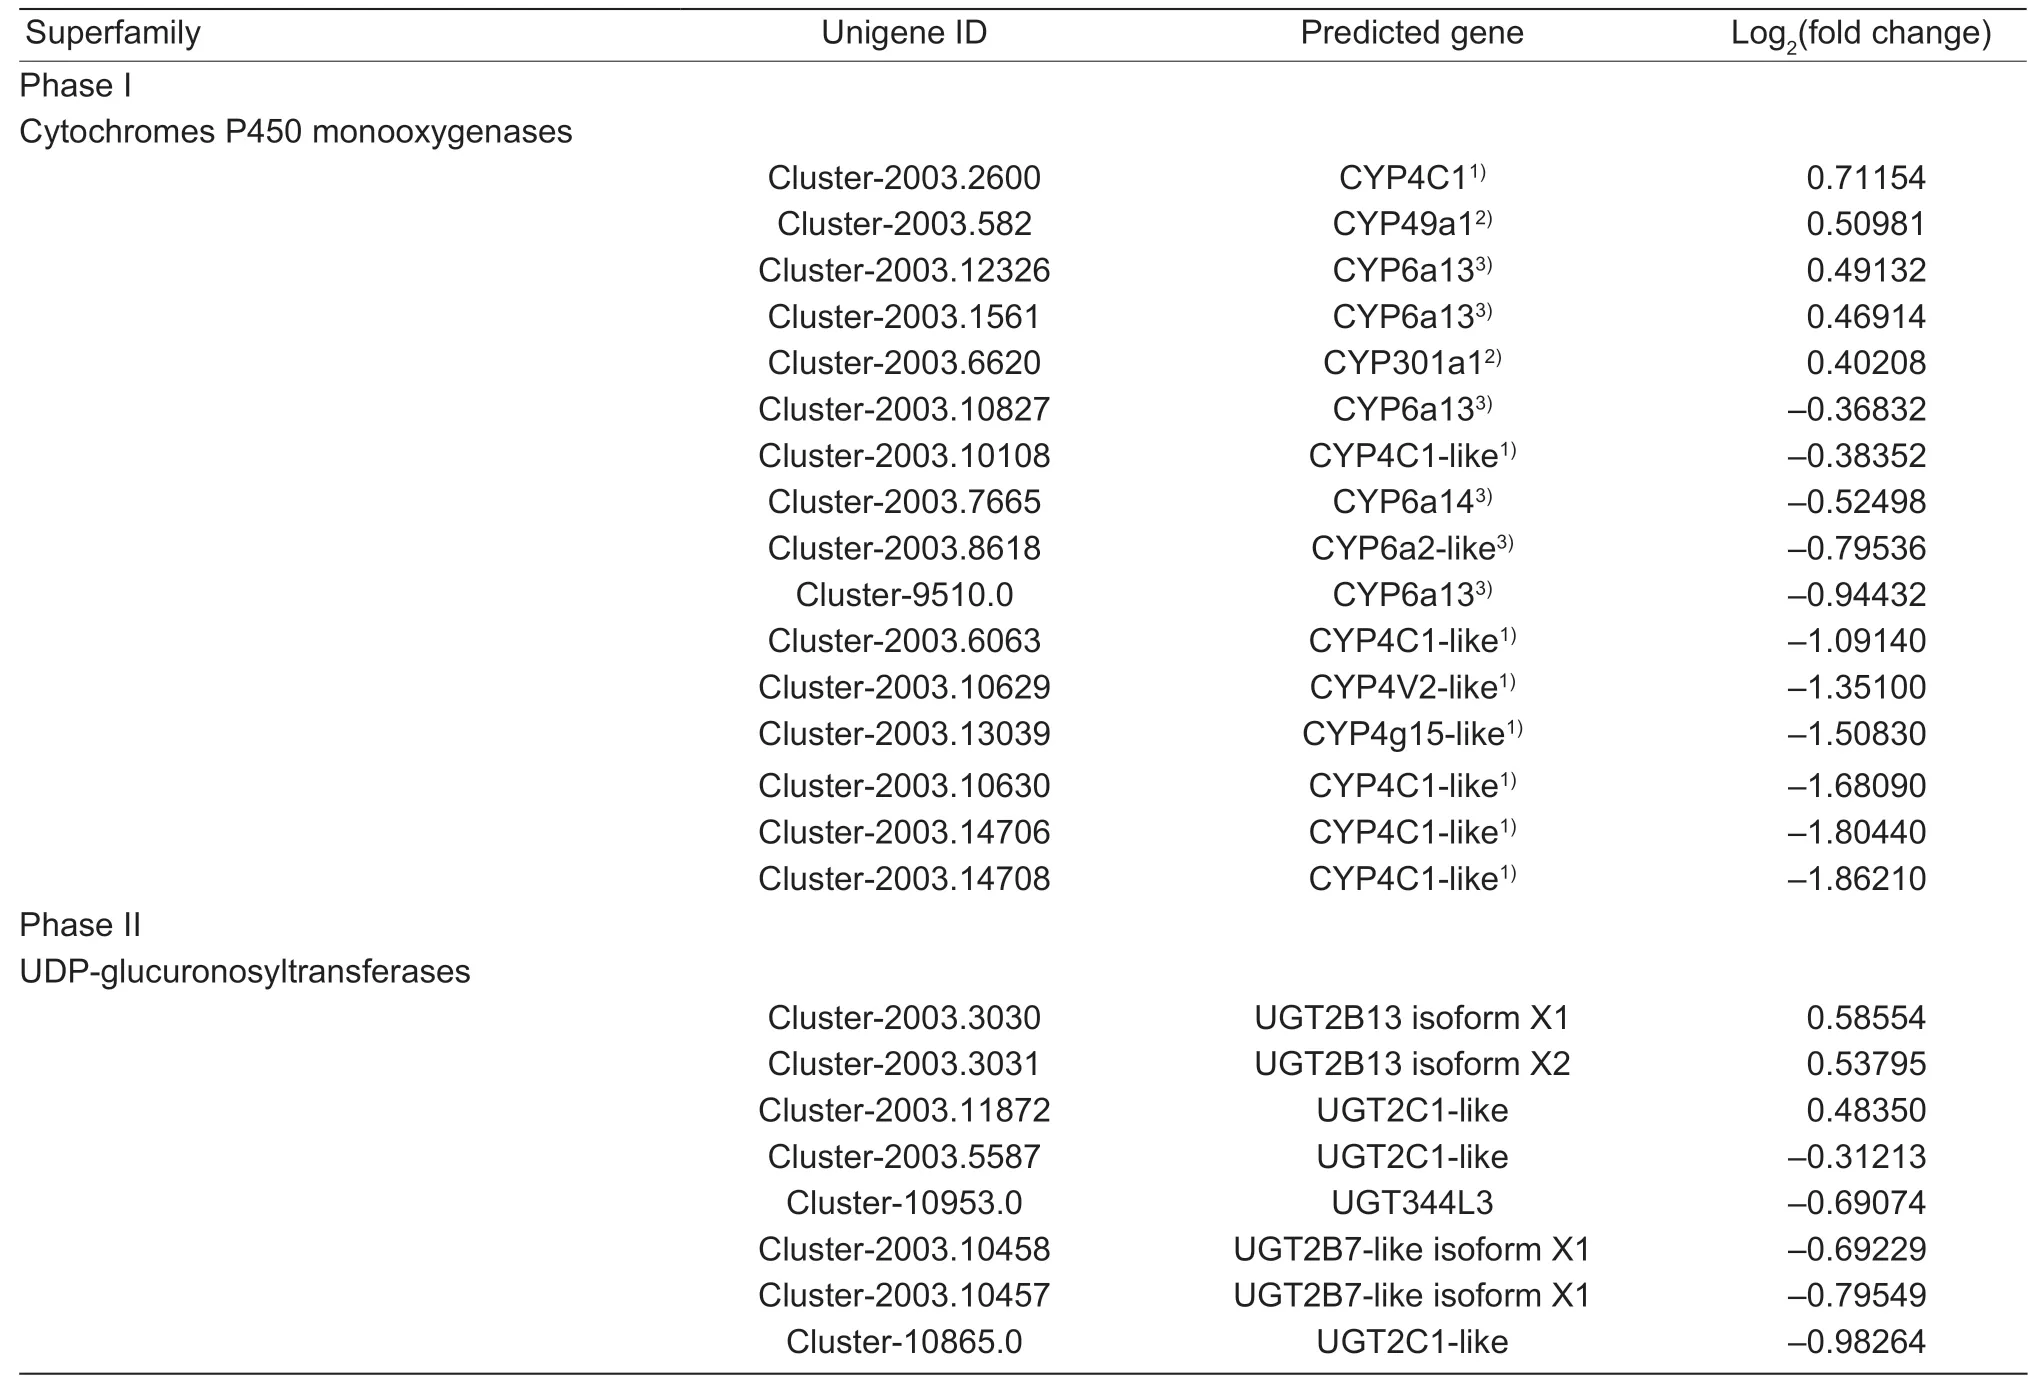
Table 3 Differentially expressed levels of detoxification metabolism-related genes in Sitobion avenae feeding on resistant Xiaoyan 22(XY22) and susceptible Xinong 979 (XN979) wheat cultivars
(Continued on next page)

Table 3 (Continued from preceding page)
3.8.Validation of selected DEGs by qPCR
All three selected downregulated genes in the aphids on XN979 were also significantly downregulated in qPCR(Fig.7). Expression levels of all nine selected upregulated genes were significantly higher in the aphids on XN979 than in the aphids on XY22 measured by qPCR (Fig.7). The gene expression pattern measured by qPCR was similar to that indicated by RNA-Seq. Thus,the RNA-Seq data in this study were reliable.
4.Discussion
Life-history traits of insects,including weight,development time,and fecundity,are generally used to assess the adaptability of insects to the resistance of host crops. In the present study,we found that the two wheat cultivars have different effects on the growth and reproduction ofS.avenae. Compared with the aphids feeding on XN979,aphids feeding on XY22 took longer to develop from nymphs to adults,and their body weight and fecundity were significantly lower,suggesting thatS.avenaefeeding on XY22 performed significantly worse than those on XN979,and thus,XY22 are more highly resistant to aphids than XN979.
Aphids obtain their nitrogen nutrition from food and symbiotic micro-organisms (Douglas 2003). For phloemfeeding insects,the amino acid concentration and composition and amino acid:sugar molar ratio in the phloem sap are important indicators of nutrition quality(Douglas 2003). The composition of amino acids differed in the phloem of XN979 and XY22,with five amino acids at a higher ratio in XY22,whereas only two amino acids at a higher ratio were observed in XN979. Furthermore,the amino acid:sugar molar ratio in the phloem sap was significantly higher in XY22 than in XN979. Our results indicate that XY22 phloem is of higher quality than XN979.The honeydew excretion of aphids during feeding can reflect the amount of food ingested by aphids (Douglas 2003). The honeydew production rate of aphids feeding on XY22 was significantly lower than that on XN979,suggesting that the aphids ingest less phloem sap from XY22. Similarly,the previous results of electrical penetration graph indicated that aphids had difficulty in accepting and continuously ingesting the phloem sap of XY22 (Caoet al.2015). Reduced phloem sap ingestion is usually involved in plant resistance to aphids(Willet al.2013). Hence,the quantity and quality of phloem nutrition available to aphids are both important for the growth and development of aphids.
During the life of a parthenogenetic aphid,nutrients were preferentially assigned to the reproductive system,and embryogenesis began in the nymphs (Dixon 1998),suggesting that the number of nymphs produced by aphids may also reflect the status of the nutrients ingested by aphids.We found that the number of nymphs was significantly lower after the aphids feeding on AK58 were transferred to XY22 compared with those transferred to XN979. Moreover,the concentration of amino acids decreased,and the glucose concentration increased in the aphids transferred to XY22 for 4 days compared with those transferred to XN979. Our results indicated that the phloem sap availability of XY22 was lower for aphids,and thus,aphids needed to consume their own nutrients to meet the demands of embryo development when they were transferred to XY22.
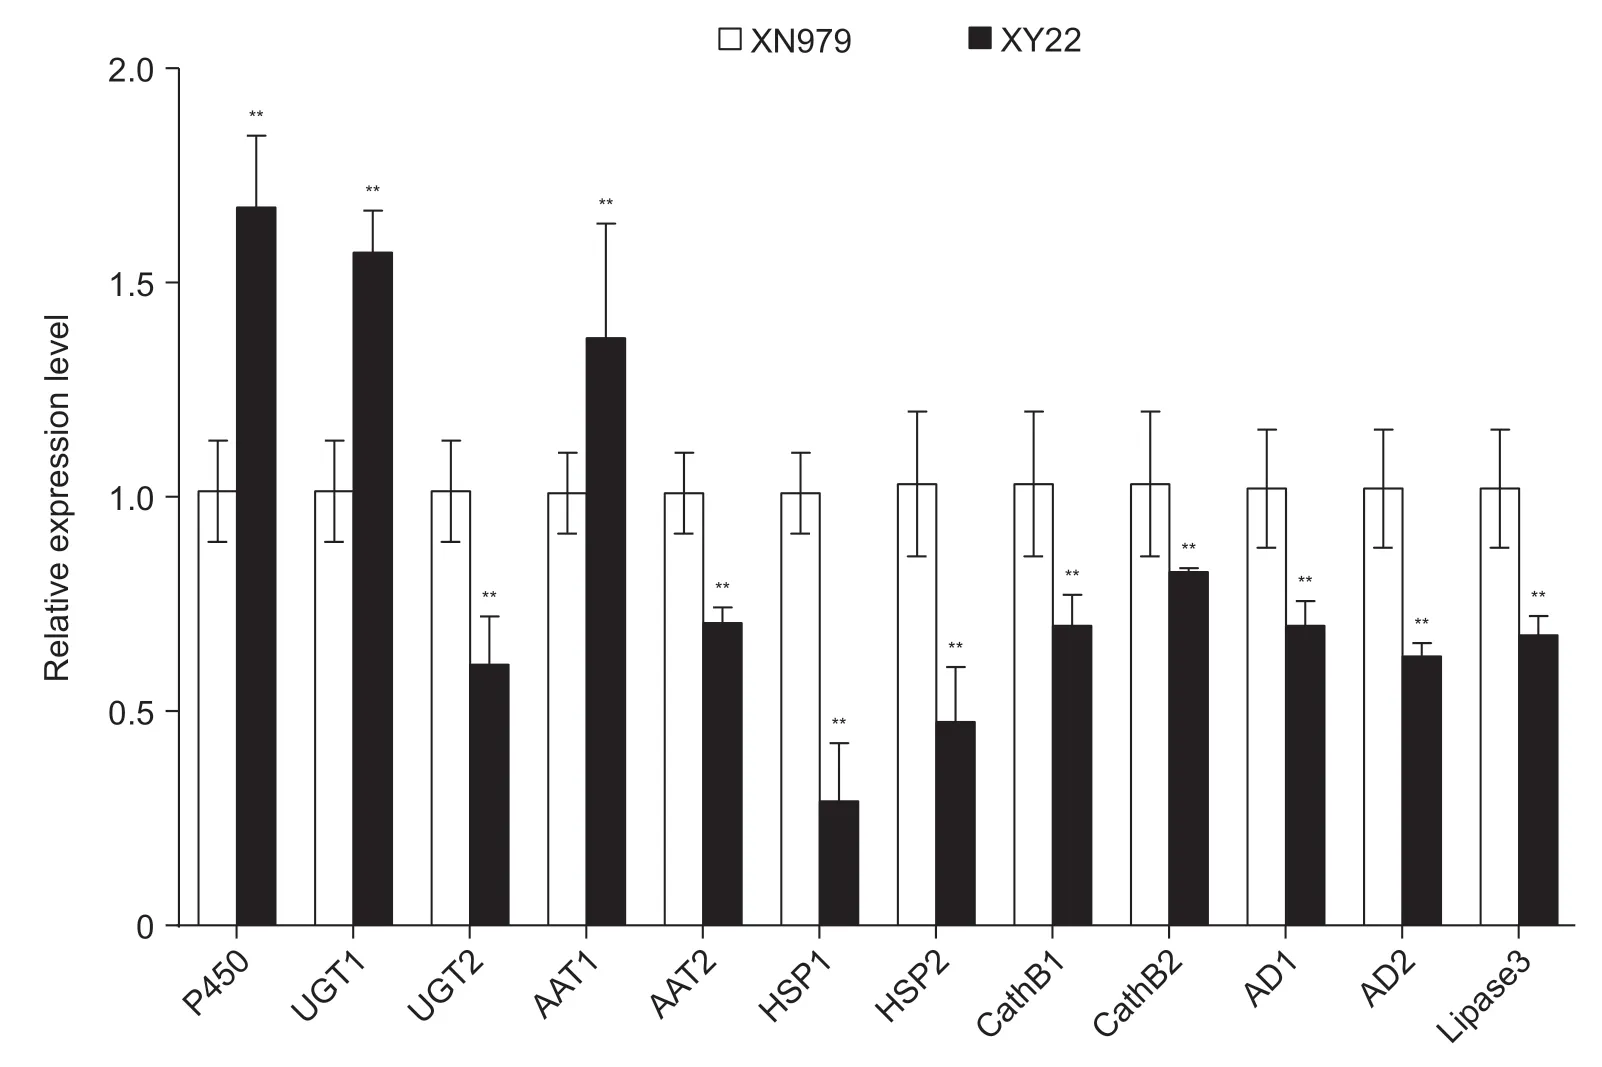
Fig.7 Validation of RNA-Seq results with qPCR of 12 unigenes. P450,cytochrome P450 6a2-like; UGT1,UDP-glucuronosyltransferase 2B7-like; UGT2,UDP-glucuronosyltransferase 2B13; AAT1,high affinity cationic amino acid transporter 1; AAT2,amino acid transporter 1; HSP1,heat shock protein 70 A1-like; HSP2,heat shock protein 68-like; CathB1,cathepsin B-like; CathB2,cathepsin B-912 precursor; AD1,apolipoprotein D-like 1; AD2,apolipoprotein D-like 2; Lipase 3,lipase 3 isoform X1. **,significant difference at P<0.01 (Student’s t-test). Bar is SE (n=3).
In addition,Buchnerahas genes encoding all the enzymes involved in the synthesis of nine essential amino acids,and it is essential for aphids as an endogenous supply of essential amino acids (Rispe and Moran 2000;Douglaset al.2002). OurBuchneraassay result showed that the relative abundance ofBuchnerain the aphids feeding on XY22 was only half of that in those on XN979,suggesting that the nutrition provided byBuchnerawas also lower in the aphids feeding on XY22.Buchneracannot exist independently without the nutrients provided by aphids because its genome lacks many genes required for independent existence (Shigenobuet al.2000; Tamaset al.2002),suggesting that the abundance ofBuchneramay depend on the nutrient supply of aphids. Hence,regardless of the higher nutritional quality of XY22 phloem,the lower phloem sap availability of XY22 may cause the decreased performance of the aphids feeding on XY22.
Genetic information regarding the molecular responses of aphids to different wheat cultivars was obtained from the transcriptome. Based on the analysis with DESeq2,there were 600 DEGs betweenS.avenaefeeding on XN979 and XY22. Eleven of the top 20 KEGG pathways in which DEGs were significantly enriched were involved in nutrient metabolism,whereas only three KEGG pathways were related to metabolic detoxification,suggesting that nutrition rather than toxic metabolites likely play an important role in wheat resistance to aphids.
Herbivorous insects can modify the expression of genes coding for nutrient metabolism and metabolic detoxification when feeding on different host plants,which is most likely a mechanism for responding to varying nutritional value(Celorio-Manceraet al.2013; Dermauwet al.2013). Based on the above results,we speculated that the low phloem sap availability of XY22 was the main reason for XY22 resistance. Therefore,it is not surprising that most of the DEGs involved in the metabolism of sugars,lipids,and amino acids were significantly downregulated in the aphids feeding on XY22,except for genes coding for amino acid transporters. Amino acids can be directly assimilated by the gut wall of animals without prior modification (Wolfersberger 2000). Therefore,the higher expression levels of the amino acid transporter genes in the aphids feeding on XY22 suggest that amino acid transport was more efficient when aphids were feeding on XY22,which was consistent with the higher nutrition quality in the phloem sap of XY22.Furthermore,the low expression levels of genes involved in nutrient metabolism in the aphids feeding on XY22 caused the low nutrition utilization,and thus,eight of 11 significantly different amino acids and all sugars except for trehalose showed higher concentrations in aphids on XY22.
In addition,although there were 16 differentially expressed genes coding for P450s differentially expressed,only six genes that belonged to the CYP3 clan were associated with xenobiotic compound detoxification (Maoet al.2006; Puineanet al.2010; Ramseyet al.2010).Therefore,only 19 detoxification genes were differentially expressed following adaptation to XY22 and XN979 over 10 generations,including six P450s,nine UGTs,one GST,two ABC transporters,and 1 MFS transporters. Furthermore,12 of them were upregulated in the aphids feeding on XY22,suggesting that aphids feeding on XY22 may face more challenges with toxic metabolites. The composition and content of toxic metabolites,such as phenolic compounds,flavonoids,alkaloids,and HAs,were varied among different wheat cultivars (Argandoñaet al.1987; Habib and Majid 2007; Khakimovet al.2014; Losviket al.2017),which may have partly contributed to the differential response ofS.avenaegene expression.
5.Conclusion
Overall,our results indicate that the quantity and quality of phloem nutrition available to aphids are both important for the growth and development of aphids,and the higher resistance of XY22 is mainly due to the reduction of phloem sap ingested by aphids,rather than toxic metabolites.
Acknowledgements
This work was supported by the National Natural Science Foundation of China (31272089). We are grateful for the assistance of all the members in the Key Laboratory of Northwest Loess Plateau Crop Pest Management of Ministry of Agriculture and Rural Affairs,Northwest A&F University,Yangling,Shaanxi,China.
Appendicesassociated with this paper can be available on http://www.ChinaAgriSci.com/V2/En/appendix.htm
杂志排行
Journal of Integrative Agriculture的其它文章
- lnfectious disease-resistant pigs:Will they fly?
- Crop photosynthetic response to light quality and light intensity
- Alginate oligosaccharides preparation,biological activities and their application in livestock and poultry
- Genome-wide pedigree analysis of elite rice Shuhui 527 reveals key regions for breeding
- TaSnRK2.4 is a vital regulator in control of thousand-kernel weight and response to abiotic stress in wheat
- Development and characterization of new allohexaploid resistant to web blotch in peanut
