lntegrative analysis of the metabolome and transcriptome reveals seed germination mechanism in Punica granatum L.
2021-12-14FUFangfangPENGYingshuWANGGuibinYousryELKASSABYCAOFuliang
FU Fang-fang,PENG Ying-shu ,WANG Gui-binYousry A.EL-KASSABY,CAO Fu-liang
1 Co-Innovation Center for Sustainable Forestry in Southern China,Nanjing Forestry University,Nanjing 210037,P.R.China
2 Department of Forest and Conservation Sciences,Faculty of Forestry,The University of British Columbia,Vancouver,B.C.,V6T 1Z4,Canada
Abstract We conducted an integrative system biology of metabolome and transcriptome profile analyses during pomegranate (Punica granatum L.) seed germination and utilized a weighted gene co-expression network analysis (WGCNA) to describe the functionality and complexity of the physiological and morphogenetic processes as well as gene expression and metabolic differences during seed germination stages. In total,489 metabolites were detected,including 40 differentially accumulated metabolites. The transcriptomic analysis showed the expression of 6 984 genes changed significantly throughout the whole germination process. Using WGCNA,we identified modules related to the various seed germination stages and hub genes.In the initial imbibition stage (stage 1),the pivotal genes involved in RNA transduction and the glycolytic pathway were most active,while in the sprouting stage (stage 4),the pivotal genes were involved in multiple metabolic pathways. In terms of secondary metabolic pathways,we found flavonoid 4-reductase genes of anthocyanin biosynthesis pathway are most significantly affected during pomegranate seed germination,while the flavonol synthase gene was mainly involved in the regulation of isoflavonoid biosynthesis.
Keywords:seed germination stages,weighted gene co-expression network analysis (WGCNA),metabolome,transcriptome,flavonoid pathway
1.lntroduction
Seed germination begins with water uptake by the quiescent dry seed and is completed by radicle protrusion through the embryo-surrounding tissues. This process involves a series of orderly physiological and morphogenetic processes involving seed energy conversion,nutrient consumption,and changes in metabolites (Bewley and Black 1994). Research has focused on the associated processes related to seed after-ripening and dormancy and how they are affected by signal and hormone transduction across a range of plant families (Finch-Savageet al.2006; Holdsworthet al.2008;Fenget al.2017a,b). Studies involving physiological metabolism and nutritional changes during seed germination have indicated that some species’ sprouts contain more nutrients and display higher antioxidant capability than do their seeds (e.g.,mung bean:Guoet al.2012; radish buds:Hanet al.2015; safflower:Shirvaniet al.2016) and that this phenomenon was not associated with any side effects (Linet al.2008). Pomegranate (PunicagranatumL.) seeds are also known for their high value-added products and for their rich contents of oils,unsaturated fatty acids,and phenols(Bedelet al.2017). Additionally,germinating pomegranate seeds are characterized by decreased fat content and increased protein and mineral content. Remarkably,knowledge of the antioxidant capability of pomegranate seeds has been greatly improved (Falcinelliet al.2017);however,this improvement is only limited to the physiological level,and understanding of the metabolic activities that take place during germination is lacking.
The transcriptome represents a collection of complete transcripts in a cell at a specific developmental stage or under specific physiological conditions. Understanding the transcriptome is essential for explaining the functional elements of the genome,revealing the molecular composition of cells and tissues,leading to understanding seed germination development. Additionally,the transcriptome can offer valuable information on the significant biological processes underlying the maintenance of cell functionality.At present,transcriptome sequencing is routinely used as an experimental platform,making significant contributions to the discovery and identification of genes that participate in metabolic pathways (Teshomeet al.2019; Yanget al.2019).In plants,many functional genes have been annotatedviatranscriptome sequencing (e.g.,strawberry:Hossainet al.2018; apple:Liet al.2019; pear:Xiaoet al.2019). Ophiret al.(2014) used transcriptomic technology to assess the genetic diversity of pomegranate germplasm. However,research on the molecular regulatory pathways involved in and metabolites present during pomegranate seed germination is lacking.
Along with genes and proteins,metabolites can play a critical role in plant studies. Metabolomics is an important comparative tool for studying the global metabolite levels in a sample under various conditions. Metabolomics can provide detailed information on ongoing intracellular activities regulated by metabolites,such as cell signal transduction and energy transfer (Vinayavekhin and Saghatelian 2010).Metabolites are important indicators of cellular function,as they are involved in enzyme-catalyzed chemical reactions.Upstream biological disruptions can result in a series of metabolomic changes; therefore,the metabolome holds a large amount of information that is considered the strongest predictor of phenotypes (Schrimpe-Rutledgeet al.2016).
Recently,the combination of metabolomics and other omics tools has become a common way to identify functional genes and elucidate pathways involved in plant metabolism (Janzet al.2010; Guoet al.2020).For example,the mechanism underlying color formation in pepper fruit was analyzed through metabolomics and transcriptomics,and the synthesis and accumulation of flavonoids and carotenoids in the fruit were elucidated(Liuet al.2020). Similarly,Wanget al.(2016) studied the pathways of primary and secondary metabolic changes and the protective mechanism of flavonoid structure against abiotic and biotic stress throughout the different stages of cocoa seed maturation. Generally,it is largely believed that during seed germination,important physiological and biochemical features change (Guoet al.2012); however,few studies have attempted to investigate the gene expression and metabolic changes that occur during seed germination.
The main purpose of the present study was to explore the key regulatory genes and their functions during pomegranate seed germination. Through Kyoto Encyclopedia of Genes and Genomes (KEGG) enrichment analysis and weighted correlation network analysis (WGCNA),the core regulatory genes among tens of thousands of individual genes can be screened. To analyze the germination process of pomegranate seeds,we comprehensively compared the changes in primary and secondary metabolic pathways during the various germination stages. We selected four representative pathways of primary metabolites that correspond to published physiological experimental data.We further investigated the flavonoid synthesis pathway as a representative of the secondary metabolic pathway based on the results of the enrichment analysis. This research is intended to clarify the molecular mechanism of metabolic transformation during pomegranate seed germination,which is an important supplement to the physiological and metabolic changes that occur during seed germination.
2.Materials and methods
2.1.Seed materials
The seeds of “Tunisian soft seed” pomegranate (from Xingyang City,Henan Province,China) were washed and air-dried for 4 days before being used for germination experiments. The process of seed germination can be divided into four stages (Mileset al.1988),which include:1) imbibition stage (when the seed absorbs water and reaches saturation),which is often reached after 48 h of water absorption (Appendix A); 2) preliminary stage (when the protoplasm and seed cell wall are hydrated and the protoplasm changes from the gel state to the solid state(during this stage,various enzymes begin to become activated,and respiration and metabolism sharply increase);3) emergence stage (when the embryo breaks through the seed coat); and 4) germination stage (before the first cotyledon is unfolded and after the stem formation reaches a length of 3 mm) (Fig.1). An experimental sample of 2 000 pomegranate seeds was placed in a total of ten Petri dishes lined with double-layer filter paper and germinated under 28°C for 20 days when the germination rate reached 80% and 10 mL of water was added to each Petri dish every day. The experimental materials were collected on the 5th,10th,and 15th days after the imbibition stage and classified into stage 1-stage 4 according to the morphology (Fig.1).All seed samples were dissected and seed coat removed.The remaining kernels were immediately frozen in liquid nitrogen,and then stored at -80°C until further use.
2.2.Metabolite extraction and parameter setting
All samples with three replicates were analyzed as follows:1) the sample (50 mg of seed kernel powder) was extracted with 450 μL of 75% methanol,to which 10 μL 2-chloro-Lphenylalanine was added for 30 s,and afterwards,ceramic beads were added,treated with a 45 Hz grinder for 4 min and then ultrasonicated for 5 min (ice water bath,centrifugated at 12 000 r min-1for 15 min at 4°C); 2) 200 μL of the supernatant was transferred to a 1.5-mL tube,and the extract was subsequently dried in a vacuum concentrator; 3) 80 μL of methoxyamine salt reagent (methoxyamine hydrochloride,dissolved in pyridine 20 mg mL-1) was added to the dried extract,mixed gently,and then incubated at 80°C for 30 min;4) 100 μL of trimethylsilyl (N,O-bis) trifluoroacetamide with trimethylchlorosilane containing 1% trimethylchlorosilane(TMCS) (N,O-bis-(trimethylsilyl) trifluoroacetamide (BSTFA)(with 1% TMCs (v/v))) was added to each sample,after which the mixture was incubated at 70°C for 1.5 h,cooled to room temperature,and mixed together with 5 μL of fatty acid methyl esters (FAME,soluble in chloroform); and 5) samples were then randomly selected for gas chromatography/mass spectrometry (GC/MS) detection by an Agilent 7890B GC system (Santa Clara,CA,USA) equipped with an Agilent DB-5MS column (30 m×250 μm×0.25 μm; J&W Scientific,Folsom,CA,USA). The specific analytical conditions of the gas chromatography-time-of-flight mass spectrometry(GC-TOF MS) are as follows:sample volume,1 μL; front inlet mode,spitless; column flow,1 mL min-1; carrier gas,helium; front injection temperature,280°C; oven temperature ramp,50°C hold for 1 min,increase to 310°C at a rate of 10°C min-1,hold for 8 min; column,DB-5 MS (30 m×250 μm×0.25 μm); transfer line temperature,280°C; ion source temperature,250°C; electron energy,-70 eV; mass range,50-500m/z; acquisition,12.5 spectra s-1; solvent delay,6.03 min; front inlet septum purge flow,3 mL min-1.
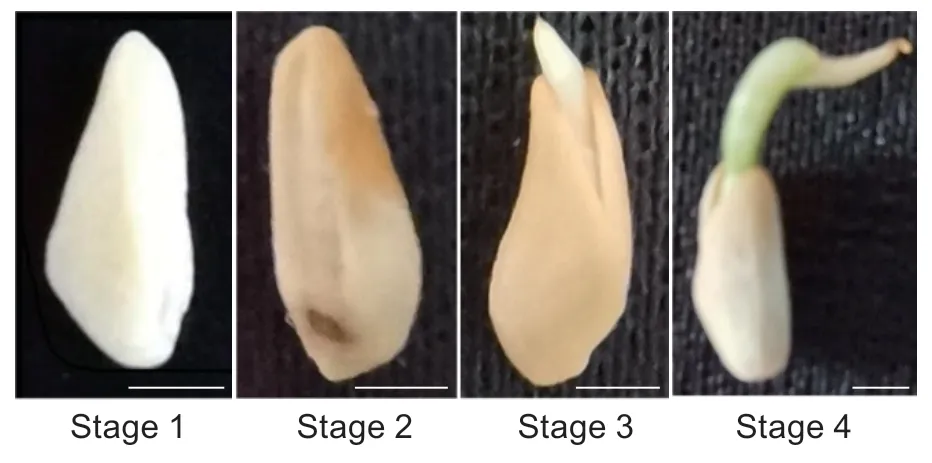
Fig.1 Morphology of Punica granatum seed at four different germination stages. Bar=0.2 cm.
2.3.ldentification and quantification of metabolite
The peak extraction,baseline correction,deconvolution,peak integration,and peak alignment of the mass spectrometry data were analyzed using the LECO v4.3x chromatography software (Kindet al.2009). The LECOFiehn Rtx5 database,including mass spectrum matching and retention time index matching,was used for the qualitative analysis of substances. Peaks with detection rates below 50% in the quality control samples were ultimately removed (Dunnet al.2011). The identification criterion for differentially accumulating metabolites was significant from Student’st-test atP<0.05.
Additionally,to explain the physical and chemical properties and the biological functions of the metabolites,KEGG pathway analysis (http://www.kegg.jp/) was used to perform level-one and level-two identifications and annotations.
2.4.RNA library construction
Briefly,a total of 12 RNA libraries from the samples at four developmental stages with three replicates were constructed as follows:1) methods involving Nanodrop,Qubit 2.0,and Agilent 2100 devices were used to detect the purity,concentration,and integrity of the RNA samples to ensure that the qualified samples were used for transcriptome sequencing; 2) fragmentation buffer was added to randomly interrupt the mRNA; 3) first-strand cDNA was synthesized with mRNA used as a template and random hexamers followed by synthesis of second-strand cDNA with dNTPs,RNase H and DNA polymerase I,and the double-stranded cDNA was subsequently purifiedviaAMPure XP beads and subjected to an end-repair process by the addition of individual adenine (A) nucleotides to the 3´ ends,after which the fragment size was selected; and 4) the cDNA library was obtained by PCR enrichment. The 12 libraries were sequenced on an Illumina Hiseq X Ten platform and 150-bp paired-end reads were generated.
2.5.Analysis of differentially expressed genes(DEGs)
The raw reads were analyzed as follows:1) remove the sequencing adapter (adapter) and primer sequences in Reads; 2) Filter low-quality data and remove reads with a ratio of N (N means that base information cannot be determined) greater than 10%; 3) Remove low-quality reads(the number of bases with a quality value Q≤5 accounts for more than 50% of the total reads). High-quality reads or bases were obtained after the above series of quality control. After sequencing quality control,106.27-Gb clean data were obtained. All data have been submitted to the NCBI Gene Bank Sequence Read Archive (SRA) database under BioProject identifier PRJNA611541.
All clean reads were aligned onto pomegranate genome(Yuanet al.2018). We used the fragments per kilobase of transcript per million fragments mapped (FPKM) method to calculate the unigene expression abundance. DEGs were detected by DESeq2 (Loveet al.2014) with a |log2(fold change (FC))|≥1 and a false discovery rate (FDR) <0.05 as selection criteria. The Venn diagram was generated by python script,and R package topGO (Alexaet al.2006)and cluster Profiler (Yuet al.2012) were used for the Gene Ontology (GO) and KEGG enrichment analysis,respectively.
2.6.WGCNA
Co-expression networks were constructed using the WGCNA package in R. Eigengene values were calculated for each module and used to test associations with each germination stage. For the correlation analysis of metabolites with genes,the Pearson correlation coefficient was calculated and the plot was constructed using the python script.
3.Results
3.1.Metabolomics profiling
The seeds of pomegranate (PunicagranatumL.) undergo four different stages during the germination according to the water absorption and the morphology (Mileset al.1988).To examine the metabolic change during this process,we collected the seeds at each stage (Fig.1) and performed an untargeted metabolome analysis. After the internal standard (IS) for normalization was applied,a total of 723 peaks were produced. Filtering for single peaks with a null value less than 50% resulted in 489 peaks. During seed germination,12 differentially accumulating metabolites(P<0.05) were identified in stage 1vs.stage 2,28 in stage 1vs.stage 3,and 26 in stage 1vs.stage 4 (Fig.2). Among these differentially accumulating metabolites,sorbitol,naringenin 7-O-β-D-glucoside (prunin),4-aminobutyic acid,tryptophan,and phenylalanine were significantly different among these three stages comparisons,indicating their active state during the seed germination process. Notably,1) most of the differentially accumulating metabolites are primary metabolites,including various amino acids,such as glycine,tyrosine,proline,serine,isoleucine; 2) some are saccharides,such as raffinose,mannose,and fructose lactulose; and 3) some exists in small amounts representing secondary metabolites,including alcohols such as sorbitol and inositol,galactinol,24,25-dihydrolanosterol,lipids,and trehalose 6-phosphate (T6P).
KEGG functional enrichment analyses of these metabolites also showed that different pathways were enriched at different stages and most are associated with primary metabolic pathways. Compare to the stage 1,the concentration of retrograde endocannabinoids is significantly increased at stage 2,the aminoacyl tRNA synthesis pathway,mineral absorption pathway,and protein digestion and absorption pathway at stage 3 and stage 4 were greatly enriched (Appendix B). That is the increase in mineral content and the significant decrease in protein content occurred in the later stages of the seed.
3.2.Transcriptome analysis of seed germination
The gene expressions in the seeds collected at four germinating stages were then analyzed by RNA sequencing.A comparison of all the up-and down-regulated genes according to the criteria of a fold change (FC)≥2 atP≤0.05 revealed 9 861 DEGs between stage 1 and stage 2 (4 913 upand 4 948 down-regulated),14 031 DEGs between stage 1 and stage 3 (7 490 up-and 6 541 down-regulated),and 15 103 DEGs between stage 1 and stage 4 (8 041 up-and 7 062 down-regulated). Generally,the further apart the seed germination stages are,the more DEGs they have(Fig.3-A). The Venn diagram showed that the expression levels of 6 984 genes significantly changed throughout the whole germination process (Fig.3-B).
GO enrichment analysis was carried out for all of the DEGs during the four germination stages,which revealed that these DEGs were widely distributed among the three functional groups (biological processes,molecular functions,and cellular components) (Fig.3-C). According to the GO analysis,the metabolic process group is the largest in the biological process category,followed by the cellular process group. Genes related to “cell”,“cell part”,and “organelle”were predominant in the cellular component category,while those involved in catalytic activity and binding were predominant in the molecular function category (Fig.3-C).
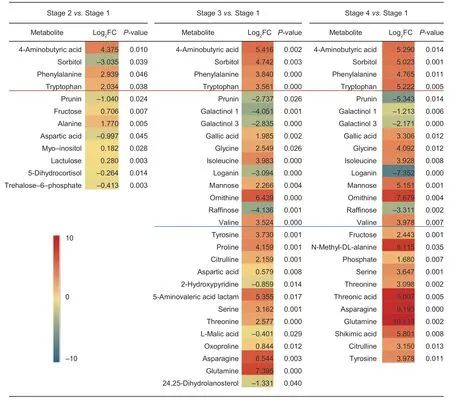
Fig.2 Differentially accumulating metabolites in Punica granatum at different seed germination stages. FC,fold change. Red means the increased accumulation,blue means the decreased accumulation; the darker the color,the larger the change. Top five metabolites are presented in three comparison (above red line); some others are changed at both stage 3 and stage 4 (above blue line).
3.3.WGCNA
To understand the biological process of pomegranate seed germination from the perspective of the overall network,a WGCNA was performed (Fig.4). Modules were defined as clusters of highly interconnected genes; genes within the same cluster have high correlation coefficients,with each tree branch constituting a module and with each leaf representing one gene. Differences between modules are distinguished by different colors. WGCNA classified all DEGs into 20 detailed modules (Fig.4-A). Some modules showed strong correlations,such as the brown and green modules (Fig.4-B),as the genes in these modules exhibit similar expression patterns at different seed germination stages,the expression of these genes was first up-regulated and then down-regulated,but the amplitudes of their expression curves were different (Fig.4-B and C). Some modules are highly correlated with the individual germination stage,such as turquoise,black and magenta modules with stage 1,either positively or negatively,brown and salmon modules with stage 2,gray60 and blue modules with stage 3,and yellow module with stage 4 (Fig.4-C and D). In other words,the genes in these modules can reflect the metabolic changes that occurred during the different seed germination stages.
3.4.Association between modules and KEGG enrichment analysis
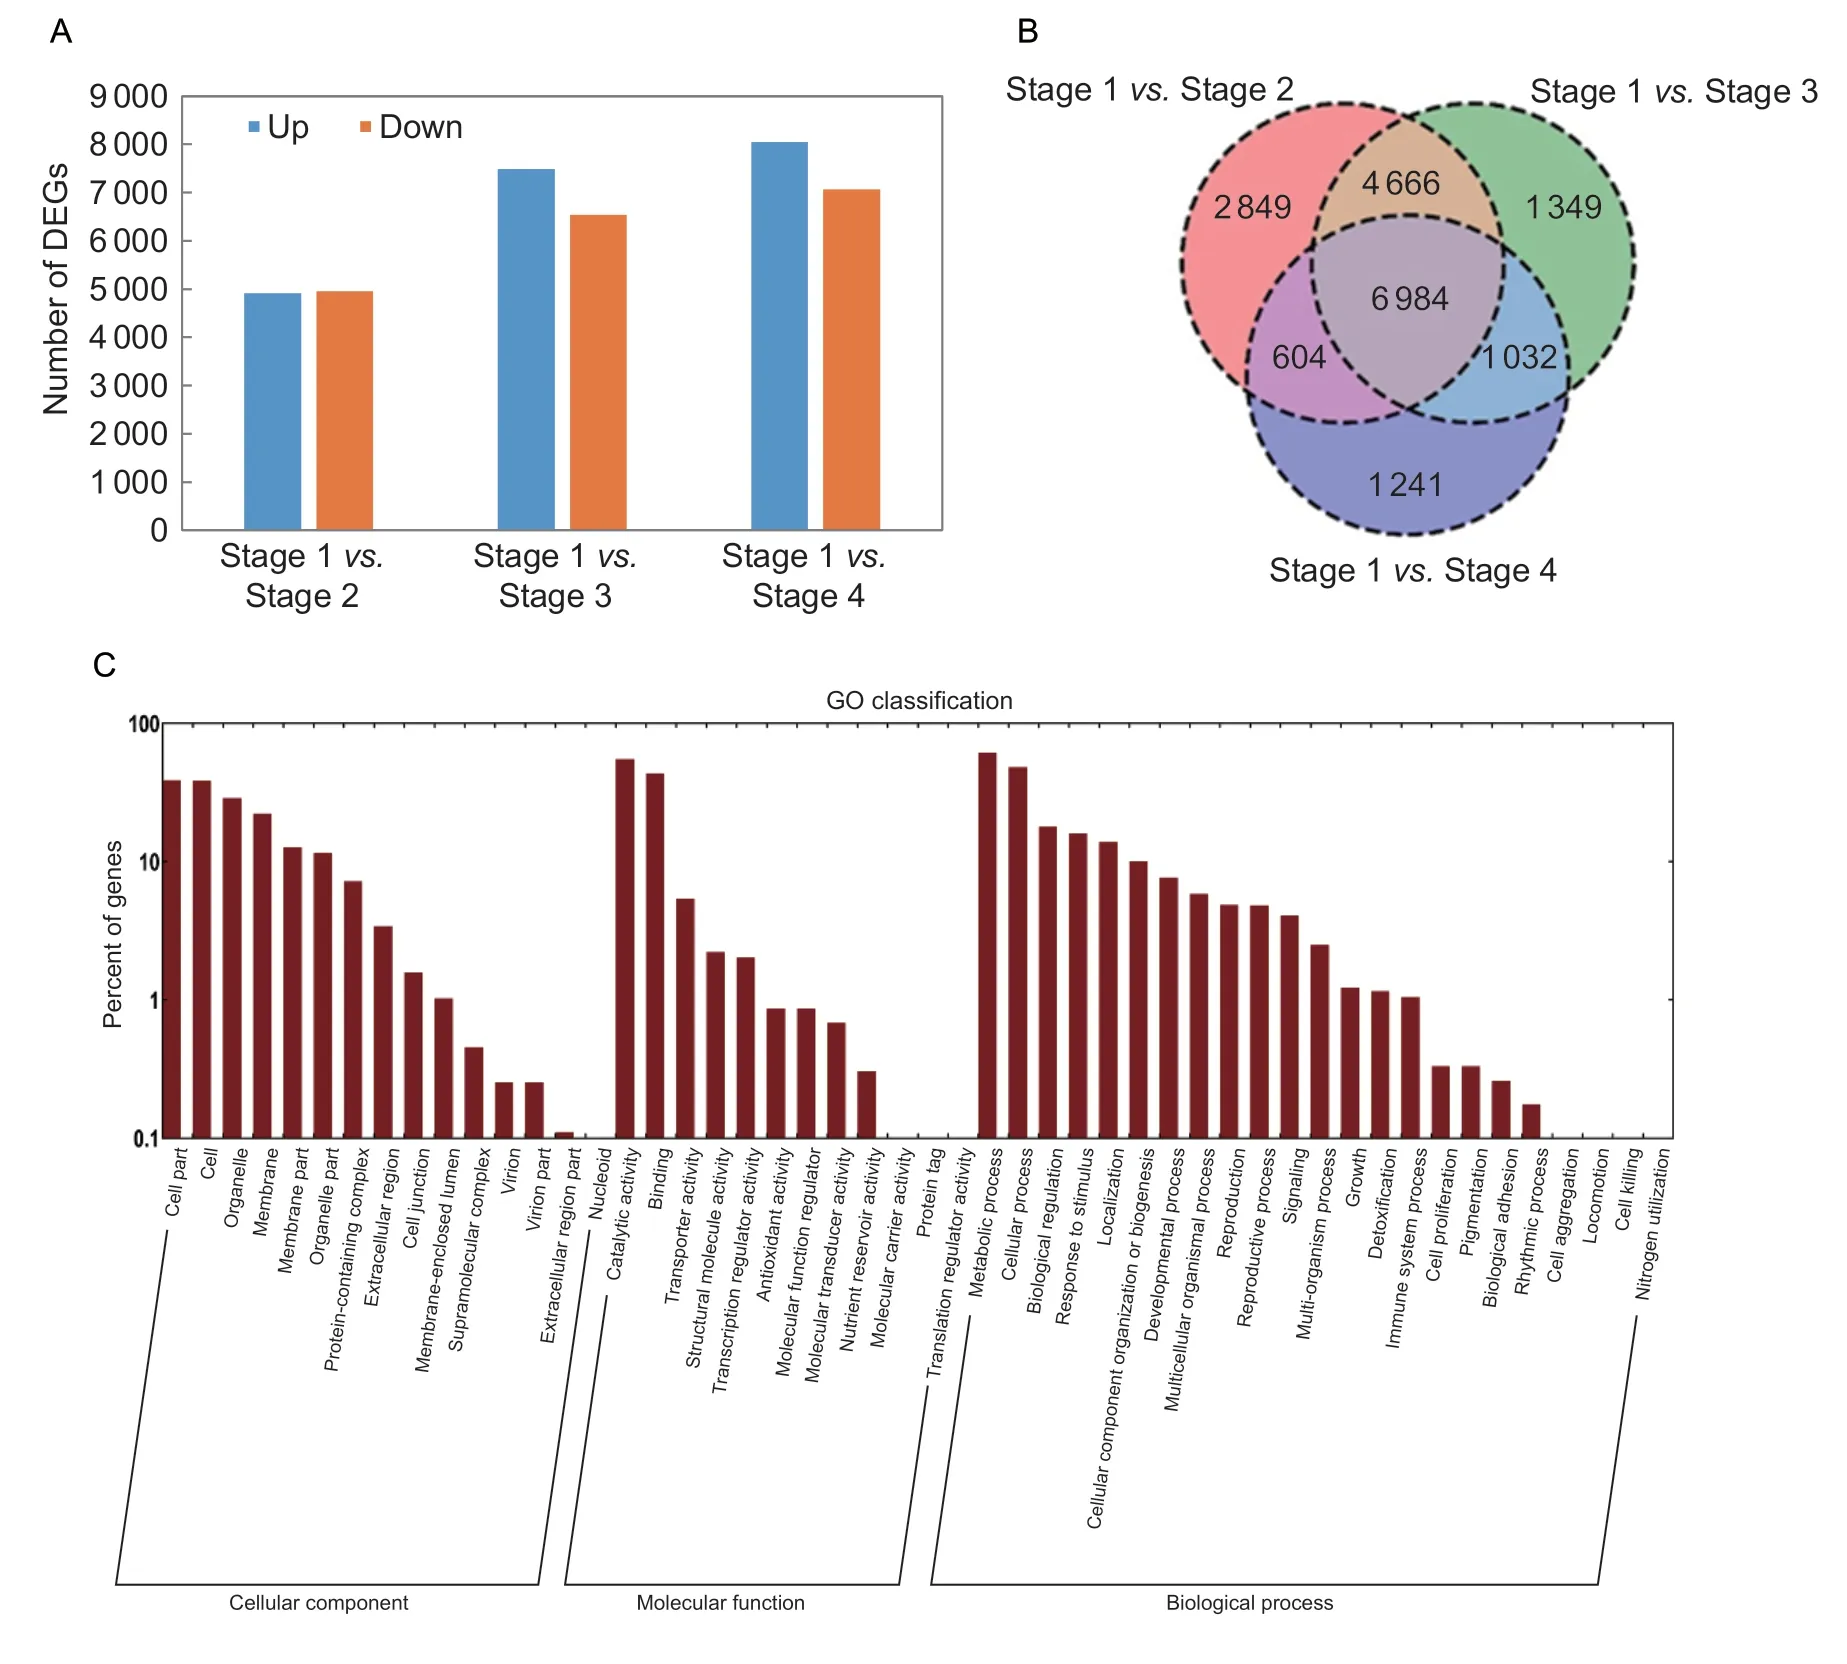
Fig.3 Differential expressed genes (DEGs) during the four stages of Punica granatum seed germination. A,up-and down-regulated DEGs at stages 2,3 and 4 compared with stage 1,respectively. B,Venn diagram of DEGs. C,Gene Ontology (GO) enrichment analysis of DEGs. The GO classification involved all annotated unigenes being divided into three functional GO categories:cellular component (CC),molecular function (MF),and biological process (BP).
Among the modules highly correlated with different germination stages,the turquoise and yellow modules are the most stage-specific,with correlation coefficient higher than 0.9,and correlated with seed germination stage 1 and stage 4,respectively (Fig.4-C and D). To compare the start stage with the end stage of the germination,we chose the turquoise and yellow modules for further analysis.The correlation between gene expression and module eigenvalues can reflect the relationship between genes within the module. The closer the correlation coefficient is to 1,the more relevant the genes in the module are. We analysed the correlations and significance of genes in the turquoise and yellow modules,and the results showed that the expression of these genes was significantly different and that they were expressed at high levels,with correlation coefficients of 0.75 and 0.70,respectively (Appendix C).This confirmed that genes in the same module have similar expression characteristics.
The KEGG enrichment analysis showed that glycolysis and pyruvate metabolic pathways are the most enriched in the turquoise module,among which the fatty acid degradation pathway,amino acid biosynthesis pathway,and tricarboxylic acid (TCA) cycle pathway are also highly enriched (Fig.5-A).This indicates that sucrose transformation was initiated at the early stage of germination and that glycolysis and the TCA cycle pathway were activated. In the yellow module,the differences in enrichment between the different metabolic pathways were not significant. The number of DEGs was the highest among metabolic pathways and secondary metabolic pathways,revealing that in the late stage of seed germination,the regulation of substances that synthesize macromolecules is very active (Fig.5-B).
3.5.ldentification of key genes related to seed germination stage 1 and stage 4
The WGCNA method was used to identify co-expressed gene modules,explore the association between gene networks,and identify the target of interest and key genes in the network. To further search for hub genes related to stage 1 and stage 4,we identified the top 50 hub genes with the highest internal connectivity,which measures the importance of genes among the modules (Appendix D),all of the annotated genes are shown in Table 1. In the turquoise module,most genes encode enzymes such as glycosyl hydrolase,dehydrogenase reductase and alphamannosidase,which indicate that carbohydrate metabolism is very active at the early stage of seed germination. In addition,there are ABC transporters and an oligopeptide transport family protein; notably,anAP2/ERFfamily transcription factor was identified with top rank,suggesting its key regulation at the beginning of the germination.
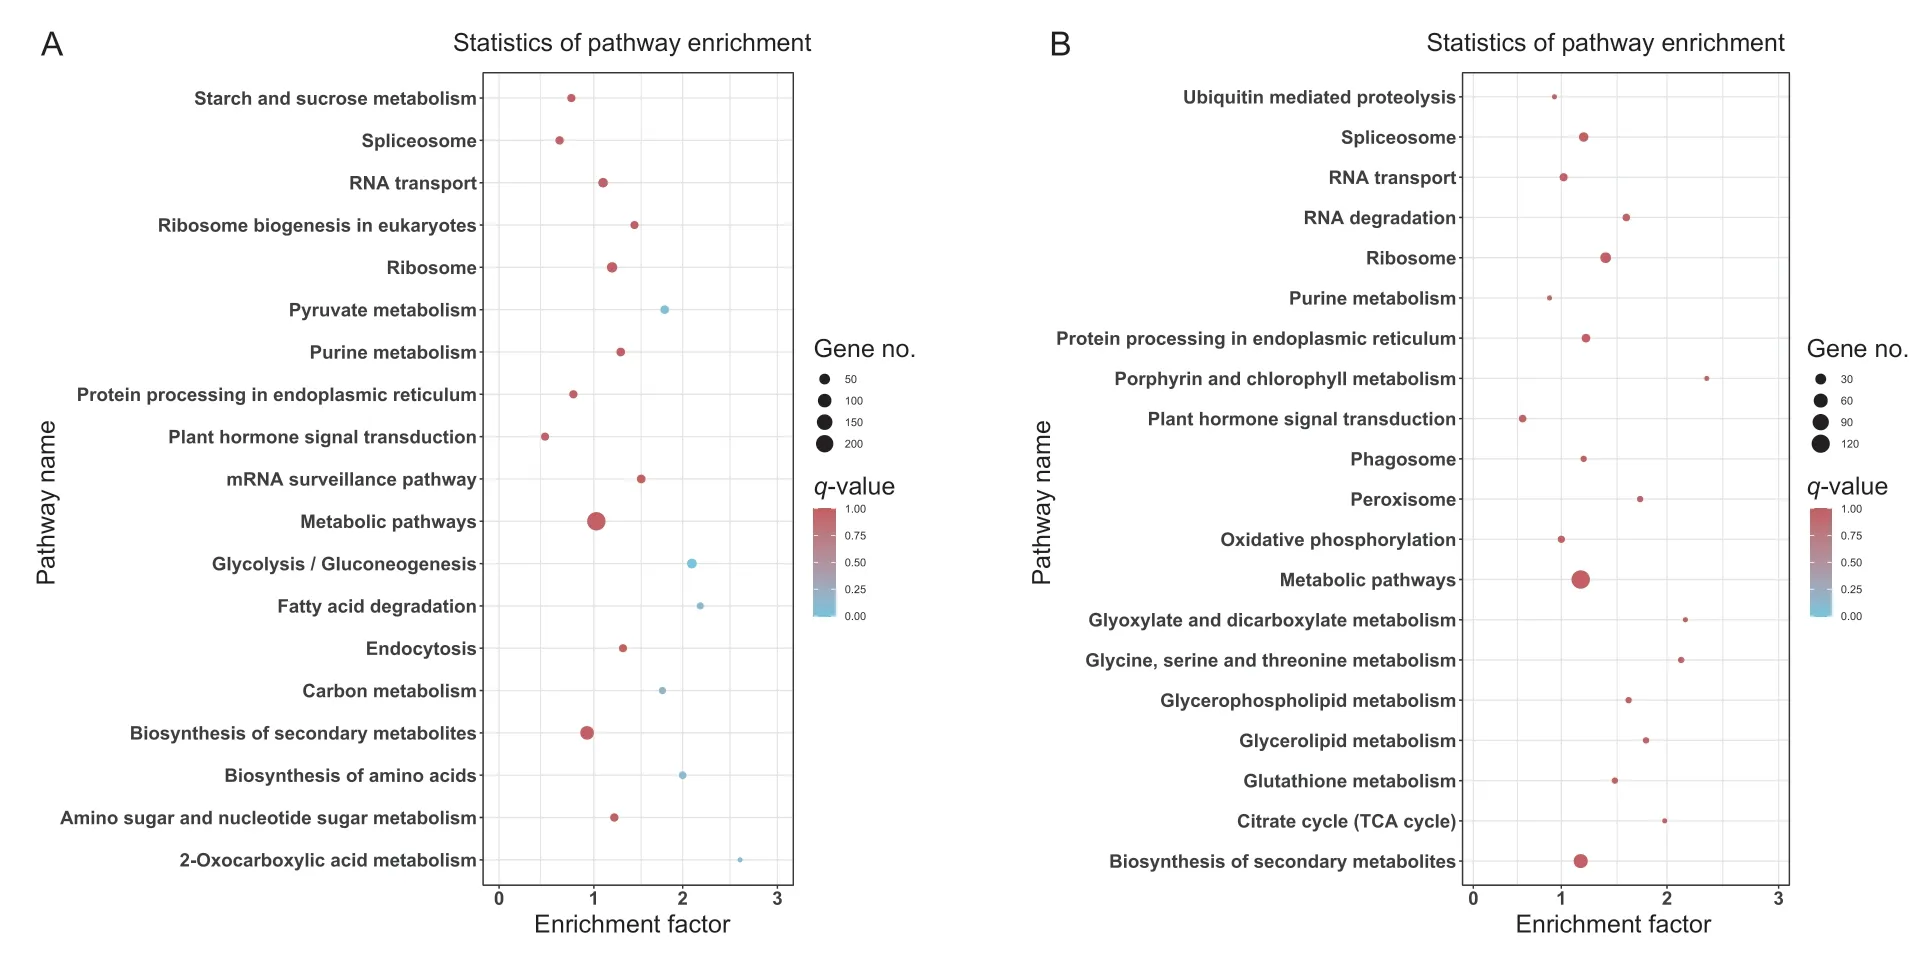
Fig.5 Top 20 KEGG pathways enriched with differential expressed genes (DEGs). A,turquoise module. B,yellow module. The q-value is represented by the color of the dot. The number of DEGs is represented by the size of the dots.
In the yellow module,more transcription factors such asTCPandhomeoboxfamily members are involved,representing the active transcriptional regulation at the late stage of germination. Some other genes with different functions were also identified,including chlorophyllregulated zinc finger proteins,magnesium transporters,calmodulin,and filamentous plant proteins and several types of enzymes. Especially,MSTRG.4069encodes a senescence-associated protein,a ribulose bisphosphate carboxylase zinc finger protein (chloroplastic) and has transferase activity,andCDL15_Pgr015762encodes a hydrolase which hydrolyzes O-glycosyl compounds and is involved in metabolic processes. An argonaute gene(CDL15_Pgr020896) that involved in the regulation of translation,ribosomal structure and biogenesis in cell function is presented,indicating the potential regulation of siRNA during this stage (Table 1).
3.6.Network diagram and correlation analysis of primary metabolic pathways
Previous experiments have shown that the crude fat and oil content of pomegranate seed significantly decreased after germination,while the sugar content increased (Peng 2019).Based on this,we investigated the detailed metabolite changes of the starch and sucrose pathway,and galactose metabolic pathways. In addition,the ABC transporter pathway can reflect changes in protein families,and the alanine,aspartate and glutamate metabolic pathway can clarify changes in amino acid metabolism. Therefore,we identified 16 metabolites related to the above-mentioned four pathways. These metabolic pathways contain at least one metabolite that undergoes significant changes in content at different germination stages (Appendix E).
We then identified the DEGs up-and down-stream of these metabolites involved in the four important primary metabolic pathways,that obtained in total of 30 genes,and analysed the correlations between the key metabolites and the DEGs (Appendix F). The network graph analysis was also performed on substances whose correlation coefficient was ≥0.8 (Fig.6),which can intuitively reflect the relationships between the substances. The more genes or metabolites connected,the larger its range of influence is.In the ABC protein transduction pathway,the genes were strongly positively correlated with phosphate and sorbitol,while mannose was negatively correlated (Fig.6-A). In the galactose metabolic pathway,all of the four metabolites especially galactinol,galactinol-3 and raffinose were reduced (Appendix E). Half of the genes in this pathway correlated with these metabolites negatively,suggesting the inhibition function of the genes to this metabolic pathway(Fig.6-B). Four metabolites were identified in the starch and sucrose metabolic pathway:trehalose-6-phosphate(T6P),sucrose,fructose,and isomaltose. Among them,T6P plays an important role,and it has a significant negative correlation with maltase-glucoamylase (Fig.6-C,Appendix F). In the alanine,aspartate and glutamate metabolic pathway,L-glutamic acid,carbamoyl phosphate synthase,and CAD were the most critical metabolites and genes,and they were significantly related to multiple genes and metabolites. Moreover,CAD and L-glutamic acid were significantly and positively correlated. Additionally,the alanine,aspartic acid and glutamic acid metabolic pathwayinvolved in more metabolites than did the other pathways,and the accumulation levels of these metabolites were also high (Fig.6-D,Appendix F).
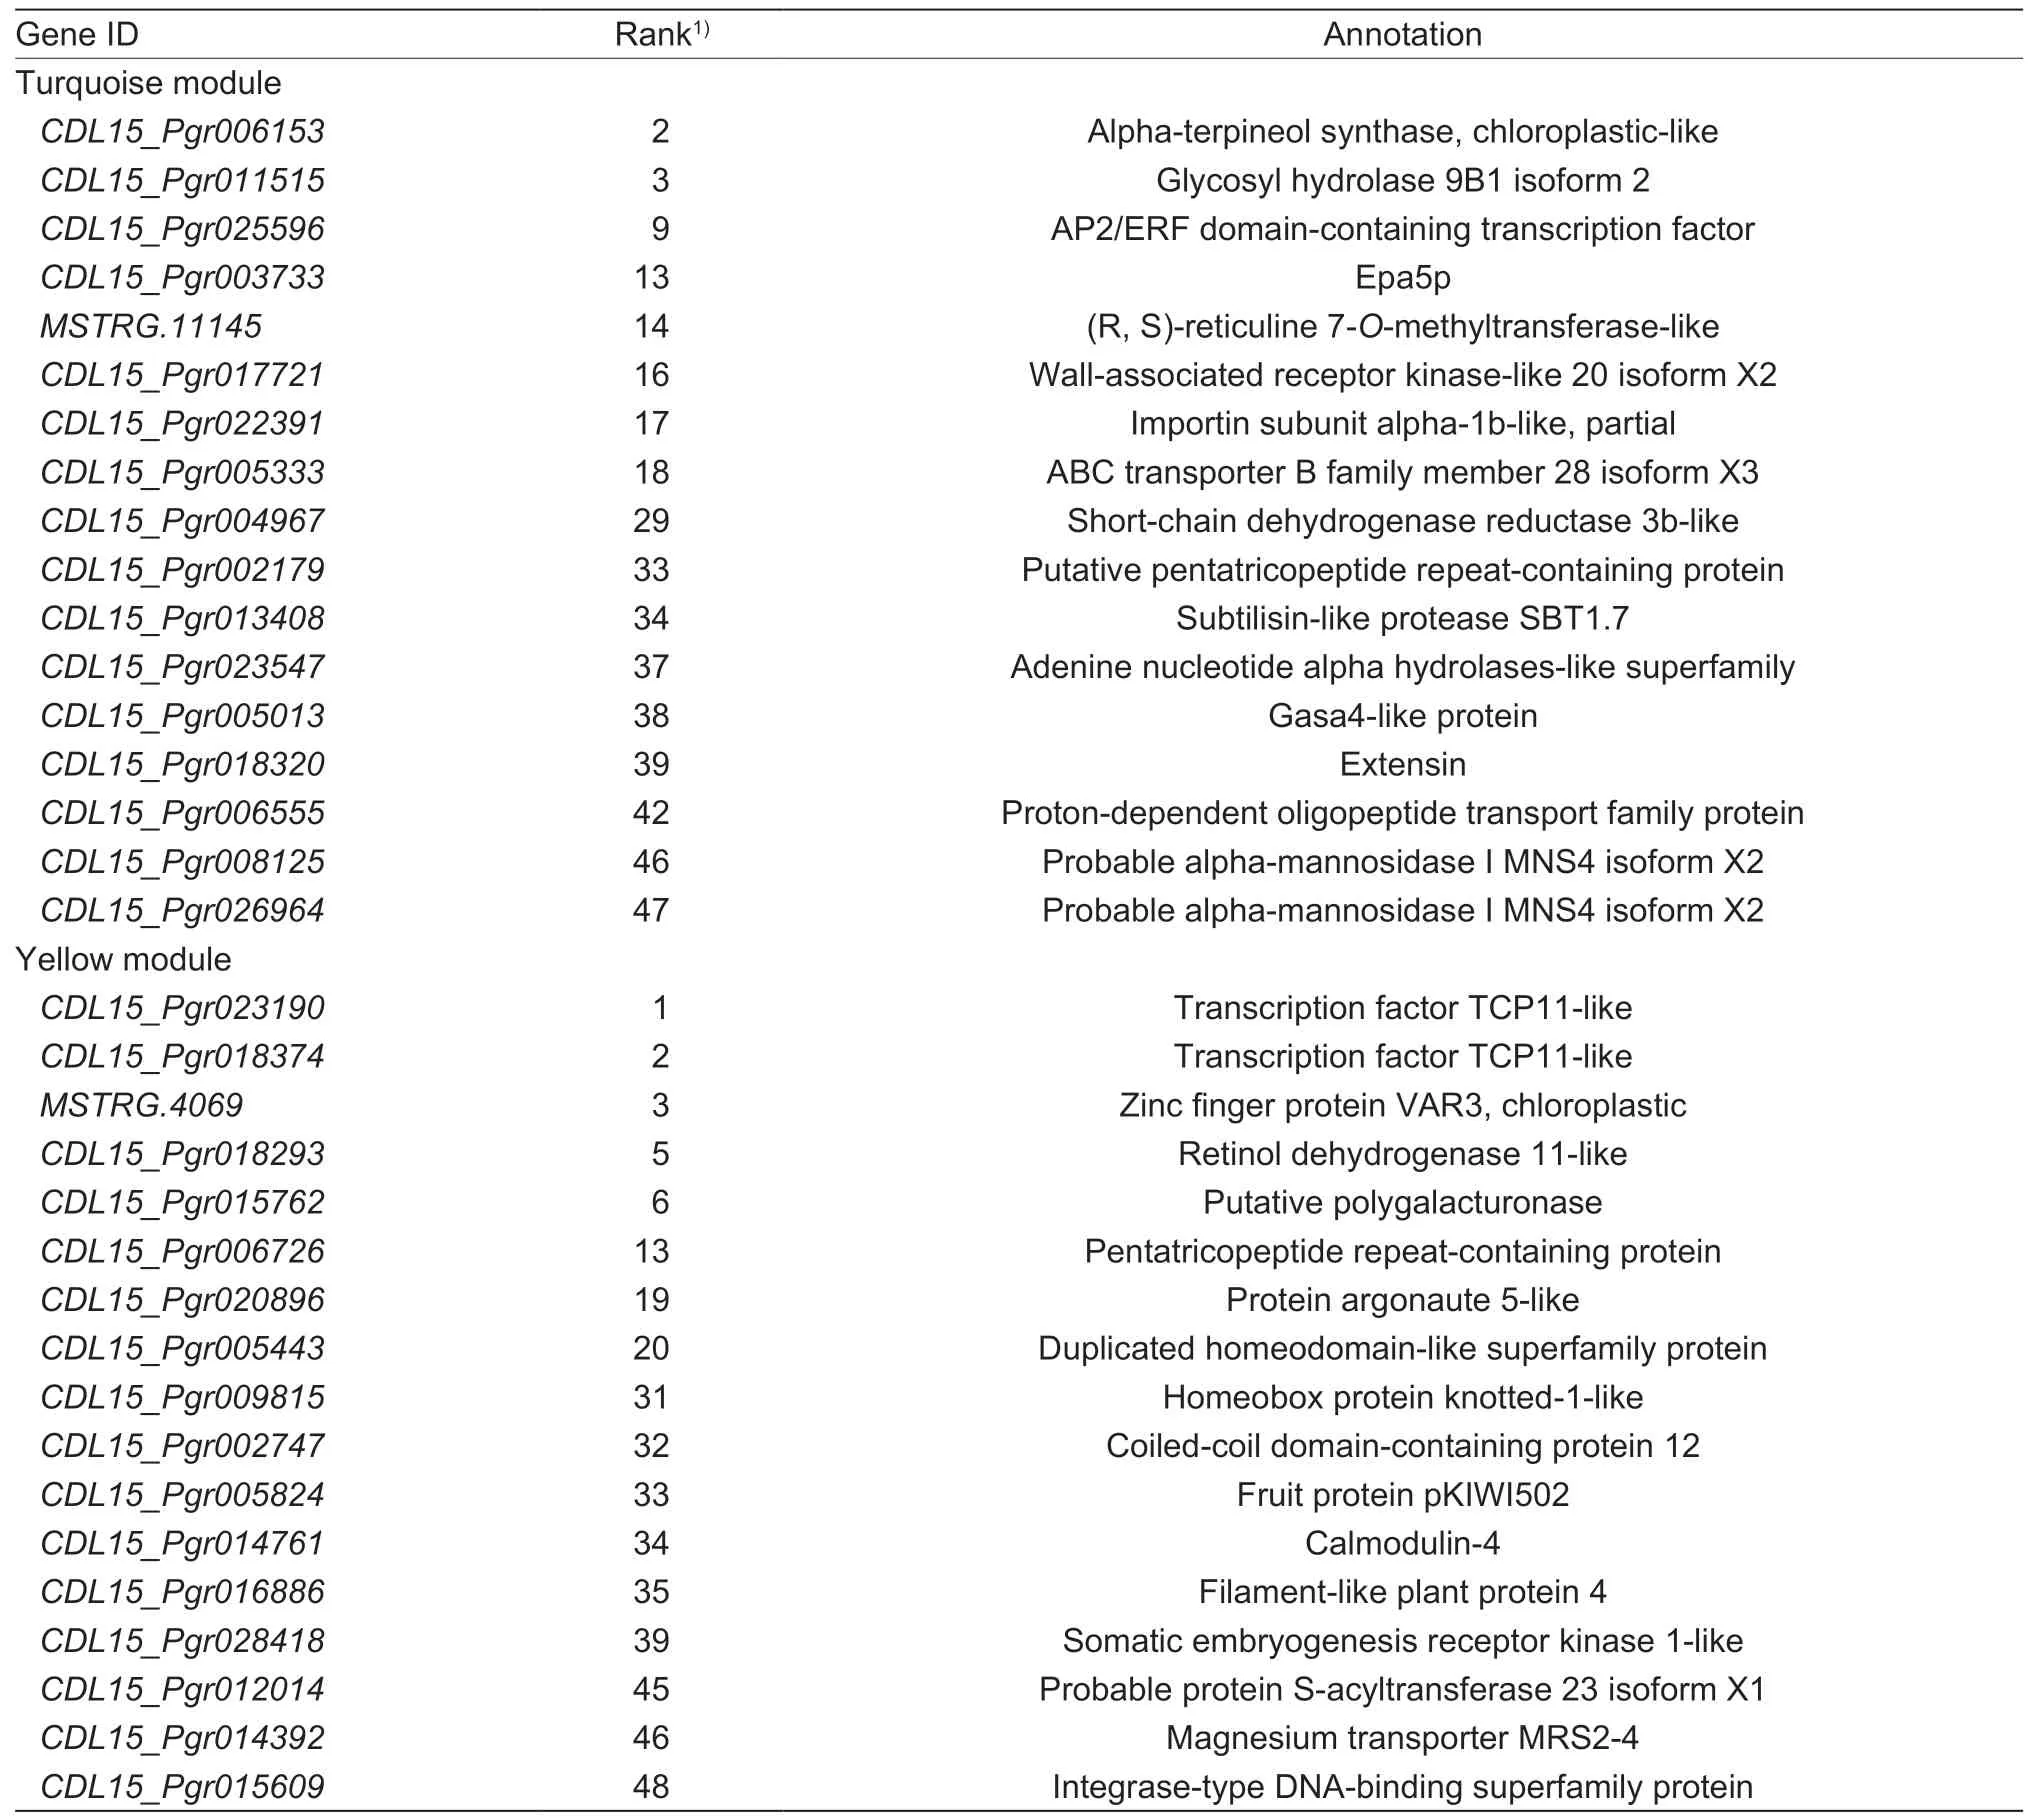
Table 1 Annotated of top 50 key genes in the turquoise module and yellow module
3.7.Transcriptome and metabolome integrated analysis of the flavonoid pathway
KEGG analysis showed the most enriched secondary metabolites are involved in the flavonoid biosynthesis pathway (Appendix B),therefore we integrated the transcription of DEGs and differentially accumulating metabolites in this pathway (map00491) (Fig.7,Appendix G).Four metabolite synthesis branches are involved,representing phenylpropanoid,isoflavonoid,anthocyanin,and flavone and flavonol biosynthesis. Cinnamoyl-CoA initiates the entire metabolic process and acts as the substrate of both CYP73A and chalcone synthase (CHS).The expression ofCYP73Agene was increased at stage 2 and stage 3 while two ofCHSgenes were upregulated through the whole germination process. These three genes are the prerequisites for the different changes in the expression of genes and the accumulation of metabolites in downstream pathway. Together with the increase of the expression of threeE5.5.1.6genes,they may contribute to the change of the accumulation in prunin,which is one of the downstream products.
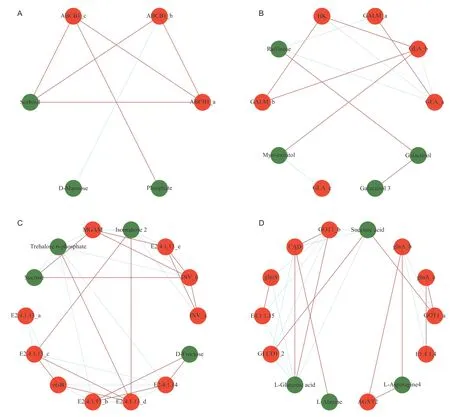
Fig.6 Metabolites and genes network of the four primary metabolic pathways. A,ABC transporters. B,galactose metabolism. C,starch and sucrose metabolism. D,alanine,aspartate and glutamate metabolism (The correlation coefficient between the DEGs and metabolites is ≥0.8.). The red lines represent positive correlations,and the green dotted lines represent negative correlations.
Other downstream genes have also changed to different extents.Naringin3-dioxygenase(F3H) gene was upregulated at stage 4. Three family of genes involved in the following step were all upregulated,includingflavonolsynthase(FLS),flavonoid4-reductase(DFR),andanthocyaninsynthase(ANS) genes. The expression ofFLSgene peaked at stage 2 and stabilized afterwards.DFR gene was not expressed at stage 1 and increased significantly after stage 2. The expression ofANSinvolved in the different steps of the pathway was also greatly upregulated.
4.Discussion
4.1.Metabolic processes during seed germination
In total,723 metabolites were detected in our study,including 40 differentially accumulating metabolites. These differentially accumulating metabolites were the substances whose abundance differed the most among the seed germination stages (1 to 4),for which references can be provided for future studies. The changes in metabolite accumulation during seed germination occurred mainly for primary metabolites,such as amino acids and sugars(Fig.2). KEGG enrichment analysis showed that the endogenous cannabinoid signalling pathway (map04723)was the most enriched pathway in the early stage of seed germination (stage 1vs.stage 2) (Appendix B). Activation of phospholipases,either through calcium-mediated or receptor-mediated signalling,leads to the formation and release of endocannabinoids (Kreitzer and Regehr 2002).
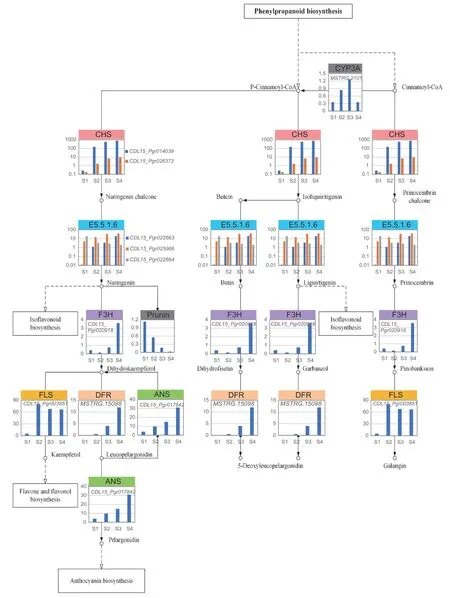
Fig.7 Expression profiles of differentially expressed genes (DEGs) (|log2(FC)|>1,FDR<0.001) involved in the flavonoid biosynthesis pathway. Two genes of CHS,three genes of E5.5.1.6,each gene of CYP73A,F3H,DFR,FLS and ANS were presented. The amount of prunin was also shown. Each cell includes the values at four stages. The colors of column head represent different gene families.
In addition,the expression of cannabinoids has been shown to be strongly correlated with lipid metabolismrelated genes in mice (Crespilloet al.2011). Therefore,we speculate that the observed changes in fat metabolism are the most obvious in the initial stage of seed germination.The enrichment analysis results of stage 1vs.stage 3 and stage 1vs.stage 4 indicated that the mineral pathway is very active in the late stage of seed germination (Appendix B).Previous studies have shown that the mineral content of seeds before germination is significantly different from that after germination (Peng 2019). Additionally,during the germination process,there was a significant (P<0.05)increase in iron,magnesium,calcium,and sodium contents of barnyard millet flour (Sharmaet al.2016). Phytase,which is a phytate-specific phosphatase,is activated and hydrolyses phytate to inositol,freeing orthophosphate and releasing minerals (Sharmaet al.2016). Notably,sorbitol,prunin,and phenylalanine significantly differentially accumulated in the comparisons among the three germination stages,and the content of prunin gradually decreased with the germination process. Prunin is mainly involved in the flavonoid metabolic pathway and was found to act as a growth inhibitor of wheat coleoptile elongation(Erez and Lavee 1969).
4.2.Analysis of key genes and metabolic pathways during seed germination
The WGCNA method aims to identify co-expressed gene modules and explore the association between gene networks and the objective of interest in the network.Enrichment analysis of genes in the module of interest can lead to detailed information within the module. Enrichment analysis of the turquoise modules revealed associations with pyruvate metabolism,the glycolysis pathway,and fatty acid degradation,whereas the genes in the yellow modules were associated with metabolic pathways and biosynthesis of secondary metabolites.CDL15_Pgr011515andCDL15_Pgr004967are key genes of the turquoise module,and involved in glycolysis metabolism at the early stage of seed germination (Seubert and Schoner 1971;Opassiriet al.2006).CDL15_Pgr011515is a member of the glycosyl hydrolase family involved in important physiological processes in plants,such as coping with biotic and abiotic stress,resisting herbivores,hormone activation,and cell wall lignification (Opassiriet al.2006). This indicates that the hormone activation and lignification processes are triggered early in seed germination.MSTRG.4069is a zinc finger protein,which is essential for chloroplast RNA editing (Sunet al.2015). We speculate that zinc finger protein plays an important role in regulating seed cotyledon opening in the late stage of seed germination
4.3.Analysis of key primary metabolic pathways during seed germination
Germinating seed deprived of an efficient mineral uptake system and photosynthetic apparatus rely on the mobilization of reserves for germination and seedling establishment,observation consistent with earlier work (Bewley 1994).At different seed germination stages,the accumulation of metabolites involved in the protein and starch metabolic pathways significantly changed. T6P is a key metabolite of starch and sucrose metabolism and an intermediate product of trehalose biosynthesis. It is essential for the control and development of primary metabolism (Schluepmannet al.2003). Studies have shown that T6P can degrade starch in plants. The regulation of starch synthesis inArabidopsisleaves during the day is minimal,but it has an effect on plant starch degradation at night (Schluepmannet al.2004). In the present study,the expression of T6P was low and tended to decrease during seed germination,but the differences were not significant at any stage. These results show that the degradation of starch gradually decreases; that is,the rapid degradation of starch mainly occurs during the early stage of seed germination.
Footitt and Cohn (1995) reported that fructose-2,6-bisphosphate (Fru-2,6-bisP) is a potential marker in the dormant or germination stage of red rice (Oryzasativa)before seed coat breaks. In non-dormant seeds,the Fru-2,6-bisP content in the embryo remains stable until the seed coat division begins (12 h),after which the content rapidly increases. This is consistent with the fructose expression trend detected in the present study. During the first three stages of seed germination (stage 1-stage 3),the accumulation of fructose increased slowly until the last stage of seed germination (stage 4),when the fructose accumulation increased significantly. In addition,fructose could also improve the germination rate and germination index of seed under stress (Linget al.2005).
4.4.Analysis of flavonoid synthesis pathway during seed germination
Plant metabolites can be generally divided into two categories:primary and secondary metabolites. Flavonoids are important secondary metabolites involved in plant growth and stress resistance. Many studies have shown that flavonoids have biological activity,including anti-allergy,antiviral,anti-inflammatory and vasodilatory effects,as well as other medicinal properties (Pietta 2000). A growing number of consumers are concerned about the number of natural flavonoids in plants and their health benefits.Therefore,it is essential to explore how metabolites and genes involved in the flavonoid metabolic pathway interact with each other during seed germination. In general,flavonoids comprise six major subgroups whose members are found in a large number of higher plants; these are chalcones,flavones (generally in herbaceous families,e.g.,Labiatae,Umbelliferae,Compositae),flavonols (generally in woody angiosperms),flavanones,anthocyanins,and isoflavonoids (Pietta 2000). Flavanones,which are important intermediates and branch point compounds in flavonoid biosynthesis,often occur in plants as glycosides(Prasadet al.2010). Prunin is the only flavonoid metabolite that differentially accumulates in the flavonoid metabolism pathway (Figs.2 and 7). Berhow and Vandercook (1989)found prunin in immature grape skins,suggesting that they can biosynthesize flavonoids from simple precursors.However,during pomegranate seed germination,prunin showed significantly decreased expression; thus,we speculate that isoflavonoid biosynthesis has already gradually weakened during germination process.
TheCHS,E5.5.1.6,andDFRgenes are significantly associated with anthocyanin synthesis,and their expression was upregulated. This suggests that the anthocyanin content of pomegranate may also increase during the germination process which has been verified in physiological experiments during the germination of other seeds (Paskoet al.2009). From the original off-white seeds to the green cotyledon shoots,the flavonoid content increased sharply,and anthocyanins were also rapidly synthesized(Paskoet al.2009). In addition,theDFRgene was not expressed during the initial stage of pomegranate seed germination. From stage 2,it exhibited very significant upregulated expression,suggesting its effects on the anthocyanin synthesis happened on the middle and late stages. Furthermore,theFLSgene is mainly involved in the regulation of isoflavonoid biosynthesis.
5.Conclusion
In the present study,an integrative system biology of metabolome and transcriptome profile analysis during pomegranate seed germination and the WGCNA were performed to describe the functionality and complexity of the physiological and morphogenetic processes as well as the gene expression and metabolic differences during seed germination. Through WGCNA,two modules positively correlated with stage 1 and stage 4 were identified,in which the genes encoding enzymes or transcription factor,such asCDL15_Pgr011515,CDL15_Pgr004967,andCDL15_Pgr025596,were predicted to be hub genes at the early stage of seed germination. Transcription factors such asTCP11andhomeoboxfamily members play an important role at the final stage of seed germination. An argonaute gene presented also suggests the potential role of siRNA here. Moreover,during pomegranate seed germination,the expression of most of the genes in the flavonoid pathway was upregulated. We identified key expressed genes and differentially accumulating metabolites in the flavonoid synthesis pathway,which provided an important complement to the study of flavonoid metabolism during seed germination. This research not only provided new insights into the changes in cells and metabolism during pomegranate seed germination but also laid a solid foundation for seed research at the molecular level.
Acknowledgements
This work was supported by the Doctorate Fellowship Foundation of Nanjing Forestry University,China (163010550)and the Priority Academic Program Development of Jiangsu High Education Institutions,China (PAPD).
Appendicesassociated with this paper can be available on http://www.ChinaAgriSci.com/V2/En/appendix.htm
杂志排行
Journal of Integrative Agriculture的其它文章
- lnfectious disease-resistant pigs:Will they fly?
- Crop photosynthetic response to light quality and light intensity
- Alginate oligosaccharides preparation,biological activities and their application in livestock and poultry
- Genome-wide pedigree analysis of elite rice Shuhui 527 reveals key regions for breeding
- TaSnRK2.4 is a vital regulator in control of thousand-kernel weight and response to abiotic stress in wheat
- Development and characterization of new allohexaploid resistant to web blotch in peanut
