Protective effects on acute hypoxic-ischemic brain damage in mfat-1 transgenic mice by alleviating neuroinflammation
2021-12-04XueGengMengWangYunjunLengLinLiHaiyuanYangYifanDaiYingWang
Xue Geng, Meng Wang, Yunjun Leng, Lin Li, Haiyuan Yang,2,✉, Yifan Dai,2,✉, Ying Wang,2,✉
1Jiangsu Key Laboratory of Xenotransplantation, Nanjing Medical University, Nanjing, Jiangsu 211166, China;
2Key Laboratory of Targeted Intervention of Cardiovascular Disease, Collaborative Innovation Center for Cardiovascular Disease Translational Medicine, Nanjing Medical University, Nanjing, Jiangsu 211166, China.
Abstract Acute hypoxic-ischemic brain damage (HIBD) mainly occurs in adults as a result of perioperative cardiac arrest and asphyxia. The benefits of n-3 polyunsaturated fatty acids (n-3 PUFAs) in maintaining brain growth and development are well documented. However, possible protective targets and underlying mechanisms of mfat-1 mice on HIBD require further investigation. The mfat-1 transgenic mice exhibited protective effects on HIBD, as indicated by reduced infarct range and improved neurobehavioral defects. RNA-seq analysis showed that multiple pathways and targets were involved in this process, with the anti-inflammatory pathway as the most significant.This study has shown for the first time that mfat-1 has protective effects on HIBD in mice. Activation of a G protein-coupled receptor 120 (GPR120)-related anti-inflammatory pathway may be associated with perioperative and postoperative complications, thus innovating clinical intervention strategy may potentially benefit patients with HIBD.
Keywords: hypoxic-ischemic brain damage, mfat-1 transgenic mice, n-3 PUFAs, RNA-seq, neuroinflammation,GPR120 receptor
Introduction
Cerebral hypoxic-ischemic damage mostly occurs during the perinatal period[1–2], whereas acute hypoxicischemic injury in adults is largely attributed to cardiac arrest during the perioperative period and thus asphyxia should not be underestimated. Cerebral ischemia after cardiothoracic surgery in the perioperative period is a major risk factor for adult encephalopathy and cognitive decline[3–5]. Previous studies have employed various pharmacological and non-pharmacological methods and animal models to study cerebral ischemia, including the effects of longchain fatty acids[6]. Polyunsaturated fatty acids(PUFAs) are a class of fatty acids enriched in the brain and are necessary for organisms to maintain physiological stability[7–9]. According to its chemical structure, PUFAs can be divided into two categories:n-3 PUFAs and n-6 PUFAs. Epidemiological and dietary nutrition studies have shown that people with higher intake of n-6 PUFAs are at a higher risk of neurological diseases[10–12]. However, possible protective targets and underlying mechanisms of a high proportion of n-3/n-6 PUFAs on hypoxicischemic brain damage (HIBD) during the adult perioperative period have yet to be investigated. The desaturase encoded by the fat-1 gene can convert n-6 PUFAs into n-3 PUFAs[13]. In mfat-1 transgenic mice,chicken actin promoter and CMV enhancer were integrated, and the coding region ofCaenorhabditis elegansfat-1 cDNA was optimized to further enhance the expression of fat-1 in mammalian cells[14–15]. The mfat-1 transgene transferred into the mice encodes desaturated lipase and increases the endogenous n-3 PUFAs in the brain directly. The mfat-1 transgenic mice were more suitable for analyzing the effects of n-3/n-6 PUFA ratio in brains for elimination of the need to manipulate the diet, which will avoid possible confounding effects of dietary supplements in the study[15–16].
The brain undergoes complex pathophysiological processes in the ischemic phase, such as excitotoxicity, depolarization around the infarction,inflammatory response and apoptosis processes[17]. In this research, an HIBD model was established to successfully simulate perioperative acute hypoxiaischemic stroke in adult mfat-1 mice[18]. RNA-seq analysis showed that multiple pathways and targets are involved in this process, and the anti-inflammatory pathway is the most significant. The findings established a novel role for the n-3/n-6 PUFA ratio on amelioration of brain injury, which might profit from differential changes in multiple pathways, especially anti-inflammation in the brain.
Materials and methods
Animals
All animal experiments were approved by the Institutional Animal Care and Use Committee of Nanjing Medical University, with protocol number of IACUC-1911024. The mfat-1 mice (6 to 7 weeks old)were obtained by prokaryotic microinjection as previously reported[14]. The experimental animals in the present study were all male adult mice in order to exclude the influence of gender-related factors[19]. The mfat-1 heterozygotes of C57BL/6J and wild-type(WT) C57BL/6J mice were crossed to obtain mfat-1 transgenic mice and WT littermates. The genotypes of the mice were identified by PCR amplification(Supplementary Fig. 1, available online). Feeding conditions: temperature: (22±2) °C; relative humidity,50%–70%; 12-hour cycle lighting; free intake of food and water.
Acute hypoxic-ischemic brain damage model
The establishment of a perioperative acute hypoxicischemic stroke model was based on the Vannucci mode[18]. The offspring mice obtained by mating of mfat-1 and WT mice weighing (22±2) g were selected for modeling grouping. After isoflurane ether anesthesia (2%), the left common carotid artery was exposed and ligated with nylon wire. The above operations were performed under a stereo microscope(Nikon, Japan). After suture, hypoxia was performed in the hypoxia chamber (Tianchen XL-2CL, China)for 50 minutes. 92% nitrogen and 8% oxygen were pumped into the hypoxia chamber. The sham group underwent the same anesthesia and exposure as the surgery group, ignoring ligation and hypoxia.
Analysis of fatty acid composition
Total lipids were extracted by the fatty acid extraction kit (Sigma-Aldrich, USA), and then dried under nitrogen for transesterification immediately.Fatty acids were methylated with boron trifluoride and methanol (heated at 70 °C for 1 hour). After addition of 1 mL of hexane and 1 mL of distilled water and then vortex, centrifugation was performed at 500gfor 5 minutes. The trans esterified lipids were reconstituted with hexane and transferred to a GC vial.Methylated fatty acids were then analyzedviagas chromatography flame ionization detection on gas chromatograph as previously described[20].
Longa score and Bederson score
Neurological defects and neurobehavioral performance were used by Longa's[21]5-point scale after HIBD. A score of 0: no neurological deficit; a score of 1: failure to extend left forepaw fully; a score of 2: circling to the left; a score of 3: falling to the left;and a score of 4: did not walk spontaneously and had a depressed level of consciousness. The evaluation standards of Bederson score were divided into 4 grades[22], normal grade 0: no observable deficit;moderate grade 1: forelimb flexion; severe grade 2:decreased resistance to lateral push (and forelimb flexion) without circling; grade 3: same behavior as grade 2, with circling.
Rotarod test
For the rotating test, an accelerating rotarod(Giliang DigBehv-010, China) was used as described previously[23–24], which accelerated in speed of 20 rpm over 5 minutes. The time for the mouse to fall for the first time and the number of drops (mice were reloaded on rotarod as soon as possible after falling)were recorded within 300 seconds. The mice were acclimatized to the rotarod for three trials, with an intertrial interval of 30 minutes.
2,3,5-Triphenyte-trazoliumchloride staining
After anesthesia, fresh brain tissue was taken immediately, washed with pre-cooled buffer solution(1× PBS). The brain was cut into 2- to 3-mm tissue blocks with a lycra blade (Leica, Germany) in the brain tank (RWD Life Science, China), put into the prepreheated 2,3,5-triphenyte-trazoliumchloride (TTC)incubation solution (Sigma-Aldrich), placed in the oven at 37 °C and incubated in the dark for 15 minutes.The reaction between TTC reagent and dehydrogenase in normal tissues was red, while the dehydrogenase activity in ischemic tissues was reduced and could not be reacted, thus presenting a pale color. Brain infarct volume(%)=[left hemisphere–(right hemisphere–infarct area)]/left hemisphere×100%[25].
Nissl staining and hematoxylin and eosin staining
Paraffin-embedded formaldehyde fixed specimens were cut into 4-μm thick slices, dewaxed with xylene,and rehydrated with a series of graded alcohols. Nissl staining and hematoxylin and eosin (H/E) staining were performed in accordance with the instructions.Microscopically, corpuscle was round and plump with slightly stained nuclei, and Nissl bodies are abundant and the average optical density was higher, which was regarded as intact cells after injury. The wrinkled Nissl bodies and the deformed and stained nucleus were considered to be seriously damaged neurons, in which average optical density decreased. In order to facilitate scientific statistical processing, fields were selected for neuronal damage in each section from different mice. Relative ratio of injured neurons(%)=(Nissl staining average optical density on the normal side−average optical density on the injured side)/average optical density on the normal side×100%[26].
Immunohistochemical analysis
The procedure of paraffin section was the same as Nissl staining. Brain serial coronal sections with antigen repair in citric acid buffer (3% trisodium citrate and 0.3% sodium citrate) and washed before fixed for 30 minutes. Then, the sections were incubated with anti-G protein-coupled receptor 120(GPR120) antibody (Santa Cruz Biotechnology, USA)at 4 °C. The antibodies used in this section are also illustrated inSupplementary Table 1(available online). After 12 hours, the sections were incubated with the secondary antibody and added with 4′,6-diamidino-2-phenylindole at room temperature.Images were obtained using a confocal microscope from different mice (Carl Zeiss LSM710, Germany).
Terminal deoxynucleotidyl transferase dUTP nickend labeling assay
Terminal deoxynucleotidyl transferase dUTP nickend labeling (TUNEL) staining was performed according to the manufacturer's instructions (KeyGEN BioTECH, China) for quantification of neuronal apoptosis[27]. Fluorescent images were acquired using a 40× objective on confocal microscope from different mice (Carl Zeiss LSM710). The TUNEL-positive cells were counted in the cortex, hippocampus and striatum for series of sections (at least 15 sections per mouse).The results were expressed as the number of TUNEL+neurons/DAPI (%).
Enzyme-linked immunosorbent assay
The concentrations of tumor necrosis factor-α(TNF-α), interleukin 6 (IL-6), and interleukin-1β (IL-1β) in ischemic injured regions of each group were quantified using an enzyme-linked immunosorbent assay (ELISA) kit (Elabscience Biotechnology,China). Absorbance at 450 nm was recorded and the concentration of the target protein was calculated according to the standard curve and normalized against the protein of the samples. Result was expressed as pg/mg protein.
RNA-seq analysis
Total RNA extraction
The ischemic brain tissue was ground evenly with a cryogenic grinder. Trizol was used to extract total RNA from brain tissue. Finally, DEPC water was added to dissolve the sample. The total RNA quality was analyzed using Nano Drop and Agilent bioanalyzer (Thermo Fisher Scientific, USA).
mRNA library construction
Oligo(dT)-attached magnetic beads were used to purified mRNA. First, the purified RNA was added to the buffer to cut it into small fragments. Next, primers were designed to synthesize cDNA by reverse transcription, and then the second one was synthesized. A-Tail mix and RNA Index Adapter were added to repair the product. The cDNA fragment was purified using Ampure XP Beads. Single-stranded circular DNA (ssCir DNA) was formatted into the final library.
Bioinformatics analysis
RNA-Seq (raw reads) applies quality control.HISAT2 (v2.0.4) was applied to locate the clean reads in the reference genome and Bowtie2 was used to compare them with the reference genome. The level of gene expression was calculated by RSEM. The heatmap was drawn using pheatmap software.DESeq2 software was used for differential expression analysis with Q value ≤0.05. GO (http://www.geneontology.org/) and KEGG (https://www.kegg.jp/)were performed for analysis of enrichment of differentially expressed genes (DEGs) by Phyper(https://en.wikipedia.org/wiki/Hypergeometric_distrib ution).
Western blotting
Proteins were extracted by homogenizing in RIPA buffer (Sigma-Aldrich, USA) with phenylmethanesulfonyl fluoride and phosphatase inhibitor (Bimake,USA). Proteins were separated by SDS-PAGE gel(Bio-Rad, USA) and then transferred to polyvinylidene fluoride (Bio-Rad) membranes.Antibodies are listed inSupplementary Table 1(available online). After incubating the antibody, the membrane was washed, and the band was observed by the ECL reaction (Bio-Rad) for appropriate exposure.Quantify with ImageJ software (version 1.41)
Real-time RT-PCR
Reverse transcription was performed using a cDNA synthesis kit HiScript II Q RT SuperMix (Vazyme Biotech, China). Quantitative PCR was performed with ChamQ SYBR qPCR Master Mix (Vazyme Biotech) and detected by StepOnePlus Real-Time PCR Systems (Applied Biosystems, USA). The expression of target genes was measured in triplicate and normalized toActbas an internal control. The−ΔΔCt values of each group were analyzed, mRNA expression levels were normalized to the control group and calculated by the 2−ΔΔCtmethod. Primers are listed inSupplementary Table 2(available online).
Statistical analysis
GraphPad Prism 8.0.1 software (La Jolla, USA)was used to analyze data and form the graphs in this work. Data were expressed as means±SD.Independentt-tests were used to estimate the differences between groups in the statistical analysis of polyunsaturated fatty acids, the relative volume of TTC infarcts and quantification of Nissl staining (no infarction was found in the sham group), the behavioral score (the scores of Longa score and Bederson score in sham group are both 0), and the verification of the DEGs on HIBD. Mortality rate was calculated using the chi-square test of two sample rates. Other tests were analyzed by two-way ANOVA.
Results
Expression of the mfat-1 transgene increased the ratio of n-3/n-6 PUFAs
Brain tissues of mfat-1 and WT mice were analyzed for fatty acid composition using gas chromatography.n-3 PUFAs mainly include alpha-linolenic acid(ALA), eicosapentaenoic acid (EPA), docosapentaenoic acid (DPA), and docosahexaenoic acid(DHA). n-6 PUFAs mainly include linoleic acid (LA)and arachidonic acid (AA).Fig. 1AandBshow that the n-6 PUFAs in the brains of mfat-1 mice were significantly reduced (P<0.05) and n-3 PUFAs significantly increased (P<0.05). InFig. 1C, the ratio of n-3/n-6 PUFAs was significantly higher than that in WT mice in the same litter (P<0.01). In sum, mfat-1 mice not only contained a higher proportion of DHA,but also contained EPA and DPA that were almost absent in the brain of WT mice.
Neuroprotective effects on mfat-1 mice with HIBD
After HIBD, the mortality rate of the WT+HIBD group was higher than that of the mfat-1+HIBD group(Fig. 2A,P<0.001). InFig. 2B, the WT+HIBD group showed that the central part of ischemia was severely swollen and exhibited more bleeding in the surrounding area. Clinical studies have shown that severe acute ischemic stroke is accompanied by secondary hemorrhage based on cerebral infarction.Hemorrhagic transformation is one of the complications of stroke disease and often leads to irreparable consequences[28]. H/E staining additionally confirmed that in the WT+HIBD group, small focal hemorrhage occurred in the cerebral cortex. However, this type of hemorrhage rarely occurred in the mfat-1+HIBD group (indicated by an arrow). InFig. 2C, TTC staining showed that in the mfat-1+HIBD group, the infarct volume was significantly reduced (P<0.001)compared to that of the WT+HIBD group. InFig. 2D,a higher number of hippocampus and cortical neurons were lost and more typical damaged neurons were observed, which were defined by severe chromatin agglutination, shrinkage, and deformed cell body, dark red cytoplasm, unclear outline, and appearance of foam cells (indicated by an arrow)[29]. However, in the mfat-1+HIBD group, there was only slight chromatin condensation in the hippocampus and cortical neurons, but no significant neuronal loss, and typical damaged neurons were observed. These results indicated that transgenic expression of mfat-1 has neuroprotective effects on HIBD.
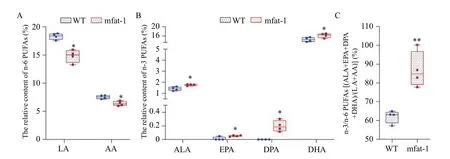
Fig. 1 Expression of mfat-1 transgene increases the ratio of n-3/n-6 PUFAs. A–C: Brain tissues came from mfat-1 mice and WT littermates. In the gas chromatographic column peak diagram, the area corresponding to each component of PUFAs is divided by the area of all components. Data are expressed as mean±SD; n=4 per group. Student's t-test was performed. *P<0.05, **P<0.01. WT: wild-type; PUFAs:polyunsaturated fatty acids; AA: arachidonic acid; ALA: α-lipoic acid; DPA: docosapentaenoic acid; DHA: docosahexaenoic acid; EPA:eicosapentaenoic acid; LA: linoleic acid.
Improved neurobehavioral performance in mfat-1 mice with HIBD
Fig. 3AandBshow that all mice in the sham groups had a neurologic grade of 0, whereas in the HIBD group, mfat-1 mice obtained a lower Longa score and Bederson scores compared with the WT group and exhibited better neurobehavior (P<0.001).Subsequently, we investigated motor coordination and balance using the rotarod test after HIBD. In the sham operation groups, mice had coordinated limbs on the rotating rod and had strong balance ability. In the HIBD groups, the WT mice showed more significant motor function defects, shorter latency to falls(P<0.001) and greater frequency of drops within 300 seconds (P<0.001) than mfat-1 mice (Fig. 3CandD).These results indicated that mfat-1 mice possessed low neurological deficits and relatively better motor coordination and balance maintenance ability after HIBD.
mfat-1 protected against HIBD-induced neuronal apoptosis in mice
Typical neuronal lesions in the hippocampus and cortex in the WT+HIBD group are shown inFig. 4A.The central Nissl corpuscle was dissolved, which was mainly manifested as neuron swelling and rounding;nucleoli were larger, the cytoplasmic central Nissl body had disintegrated, dissolved, and disappeared.Quantitative analysis showed that the mfat-1+HIBD group had a lower degree of neuronal damage and less loss of Nissl bodies in the hippocampus (P=0.001) and cortex (P<0.05). Approximately 24 hours after HIBD,cleaved caspase-3 was upregulated in the ischemic hemisphere of the WT compared with the mfat-1 mice(Fig. 4B,P<0.05). InFig. 4C, TUNEL staining further confirmed that the number of apoptotic neurons in the mfat-1 group significantly decreased compared with the WT group in the hippocampus as well as the cortex and striatum (P<0.05). The aforementioned results demonstrated that mfat-1 transgenic mice could prevent apoptosis damage caused by acute hypoxiaischemia during the perioperative period.
The mfat-1 transgenic mice showed reduced neuroinflammation in HIBD
HIBD caused a significant increase in the secretion of TNF-α, IL-6, and IL-1β compared with sham treatment. However, mRNA expression levels ofTnfa,Il6, andIl1bwere significantly decreased in mfat-1 transgenic mice compared with the WT+HIBD group(Fig. 5A–C,P<0.05). Correspondingly, a significant decrease in the protein levels was also detected(Fig. 5D–F,P<0.05). In sum, the mfat-1 transgene in mfat-1 mice can attenuate the HIBD-induced inflammation of the brain tissue, indicating a potential protective effect.
RNA-seq analysis on HIBD
We performed RNA-seq analysis of brains in the same litters in the sham groups.Fig. 6Ashows the cluster heat map of all DEGs. GO and KEGG pathway analysis were used for functional annotation to determine the biological significance of the differential clustering of all DEGs. Most of these significant pathways were closely related to the synthesis and metabolism of unsaturated fatty acids,neurogenesis and neuron development, and signal transduction. The above results showed that mfat-1 transgenic mice not only contained a high proportion of n-3/n-6 PUFAs, but also differed from WT mice in terms of genes related to PUFAs metabolism and neurotrophic metabolism. Furthermore, after acute hypoxia-ischemia, a series of pathological processes were triggered in the lesion area. RNA-seq was performed to identify the full DEGs of WT and mfat-1 mice after HIBD with ipsilateral hemispheres. After DEG screening, 1936 downregulated genes and 1315 upregulated genes were obtained, as shown in the volcano map (Fig. 6B). The top 20 pathways enriched by downregulated and upregulated genes are shown in the bubble chart (Fig. 6CandE). Cytoscape software was used for enrichment analysis of the DEGs involved in KEGG pathways (Fig. 6DandF).Statistical analysis revealed that in the 1936 downregulated DEGs, 247 pathways were enriched. Most of the downregulated pathways were closely related to inflammatory response, indicating that mfat-1 transgenic mice could inhibit the inflammatory response induced by HIBD. In contrast, among the 1315 upregulated DEGs, 247 pathways were enriched.Compared with the WT mice, most of these upregulated pathways were closely related to nerve growth and differentiation, cholinergic synapse development, and nervous system signal transduction.Neurotrophic factors are of great significance to the restoration of tissues and the reconstruction of blood vessels[30]. This detailed analysis indicated that the gene related to PUFA metabolism and decomposition in the brain of mfat-1 mice had significantly changed due to transgenic introduction. Furthermore, the neuroprotective effects exhibited by transgenic mice after acute ischemia and hypoxia were associated with multiple molecular pathways and targets. For example, the down-regulated KEGG top10 pathway involved osteoclast differentiation, ribosome, TNF,NOD-like receptor, PI3K-Akt, MAPK and chemokine signaling pathway, neuroactive ligand-receptor interaction, and apoptosis. And the down-regulated KEGG top 10 pathway mainly involved the phosphatidylinositol signaling system, glutamatergic synapse, aldosterone synthesis and secretion,neurotrophin signaling pathway, phospholipase D signaling pathway, axon guidance, long-term depression, and calcium signaling pathway. Among the down-regulated DEGs, the most obvious one was the anti-neuroinflammatory pathway, while the most important one is the amplification of neurotrophic signals in the upregulated DEGs.
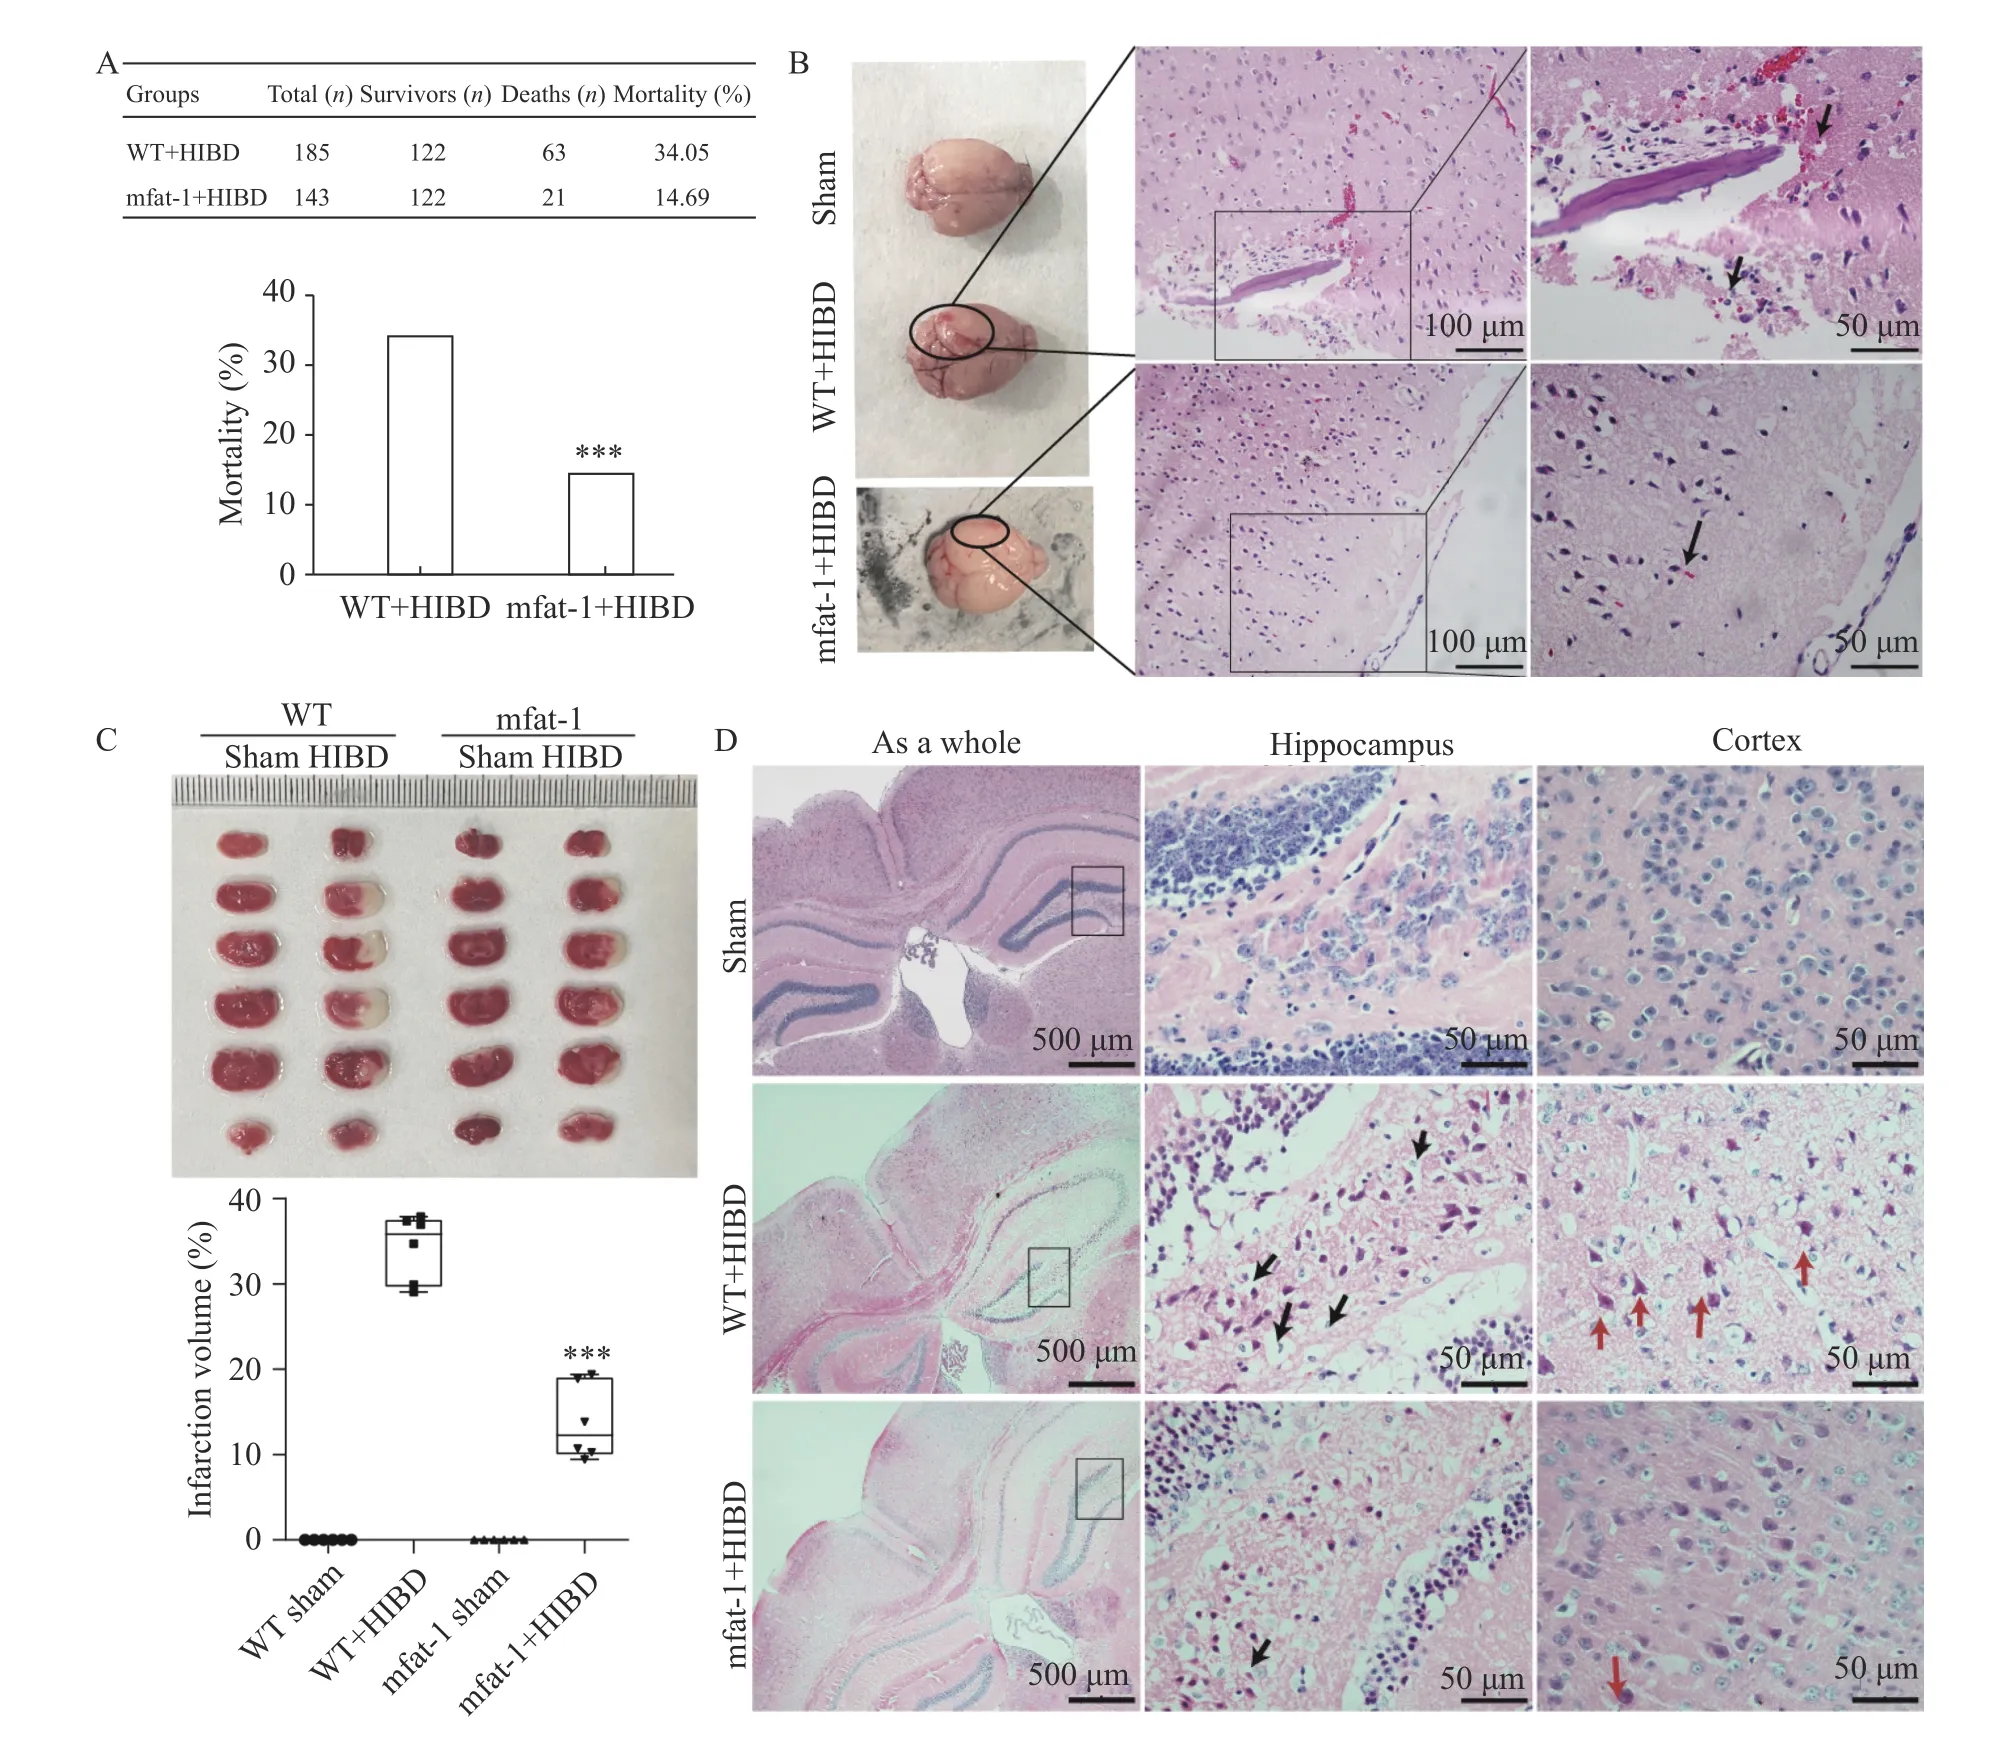
Fig. 2 Neuroprotective effects on mfat-1 mice with HIBD. A: Mortality rate within 24 hours after HIBD. Data were analyzed by the Chisquare test. ***P<0.001. B: Left panel of the images showed that the central part of ischemia (indicated by a circle). H/E staining showed small focal hemorrhage occurred in the cerebral cortex, and many red blood cells overflowed around the damaged vessel wall in the WT+HIBD group (indicated by an arrow). Scale bar, 100 μm (left panel) and 50 μm (right panel). C: TTC staining in the coronal section of infarction. Infarction was observed in white and the normal tissue in red. Statistics in the bar chart below showed quantification of infarct volume in mfat-1 groups and WT groups. The data are expressed as the mean±SD; n=6 per group. Student's t-test was performed. ***P<0.001.D: H/E staining indicated neuronal morphology and pathological characteristics in ischemic regions. Black and red arrows represented typical red neurons with shrunken bodies, highly condensed chromatin, and vacuolated cytoplasm in hippocampus and cortex respectively.HIBD: hypoxic-ischemic brain damage; WT: wild-type; H/E: hematoxylin and eosin; TTC: 2,3,5-Triphenyte-trazoliumchloride.
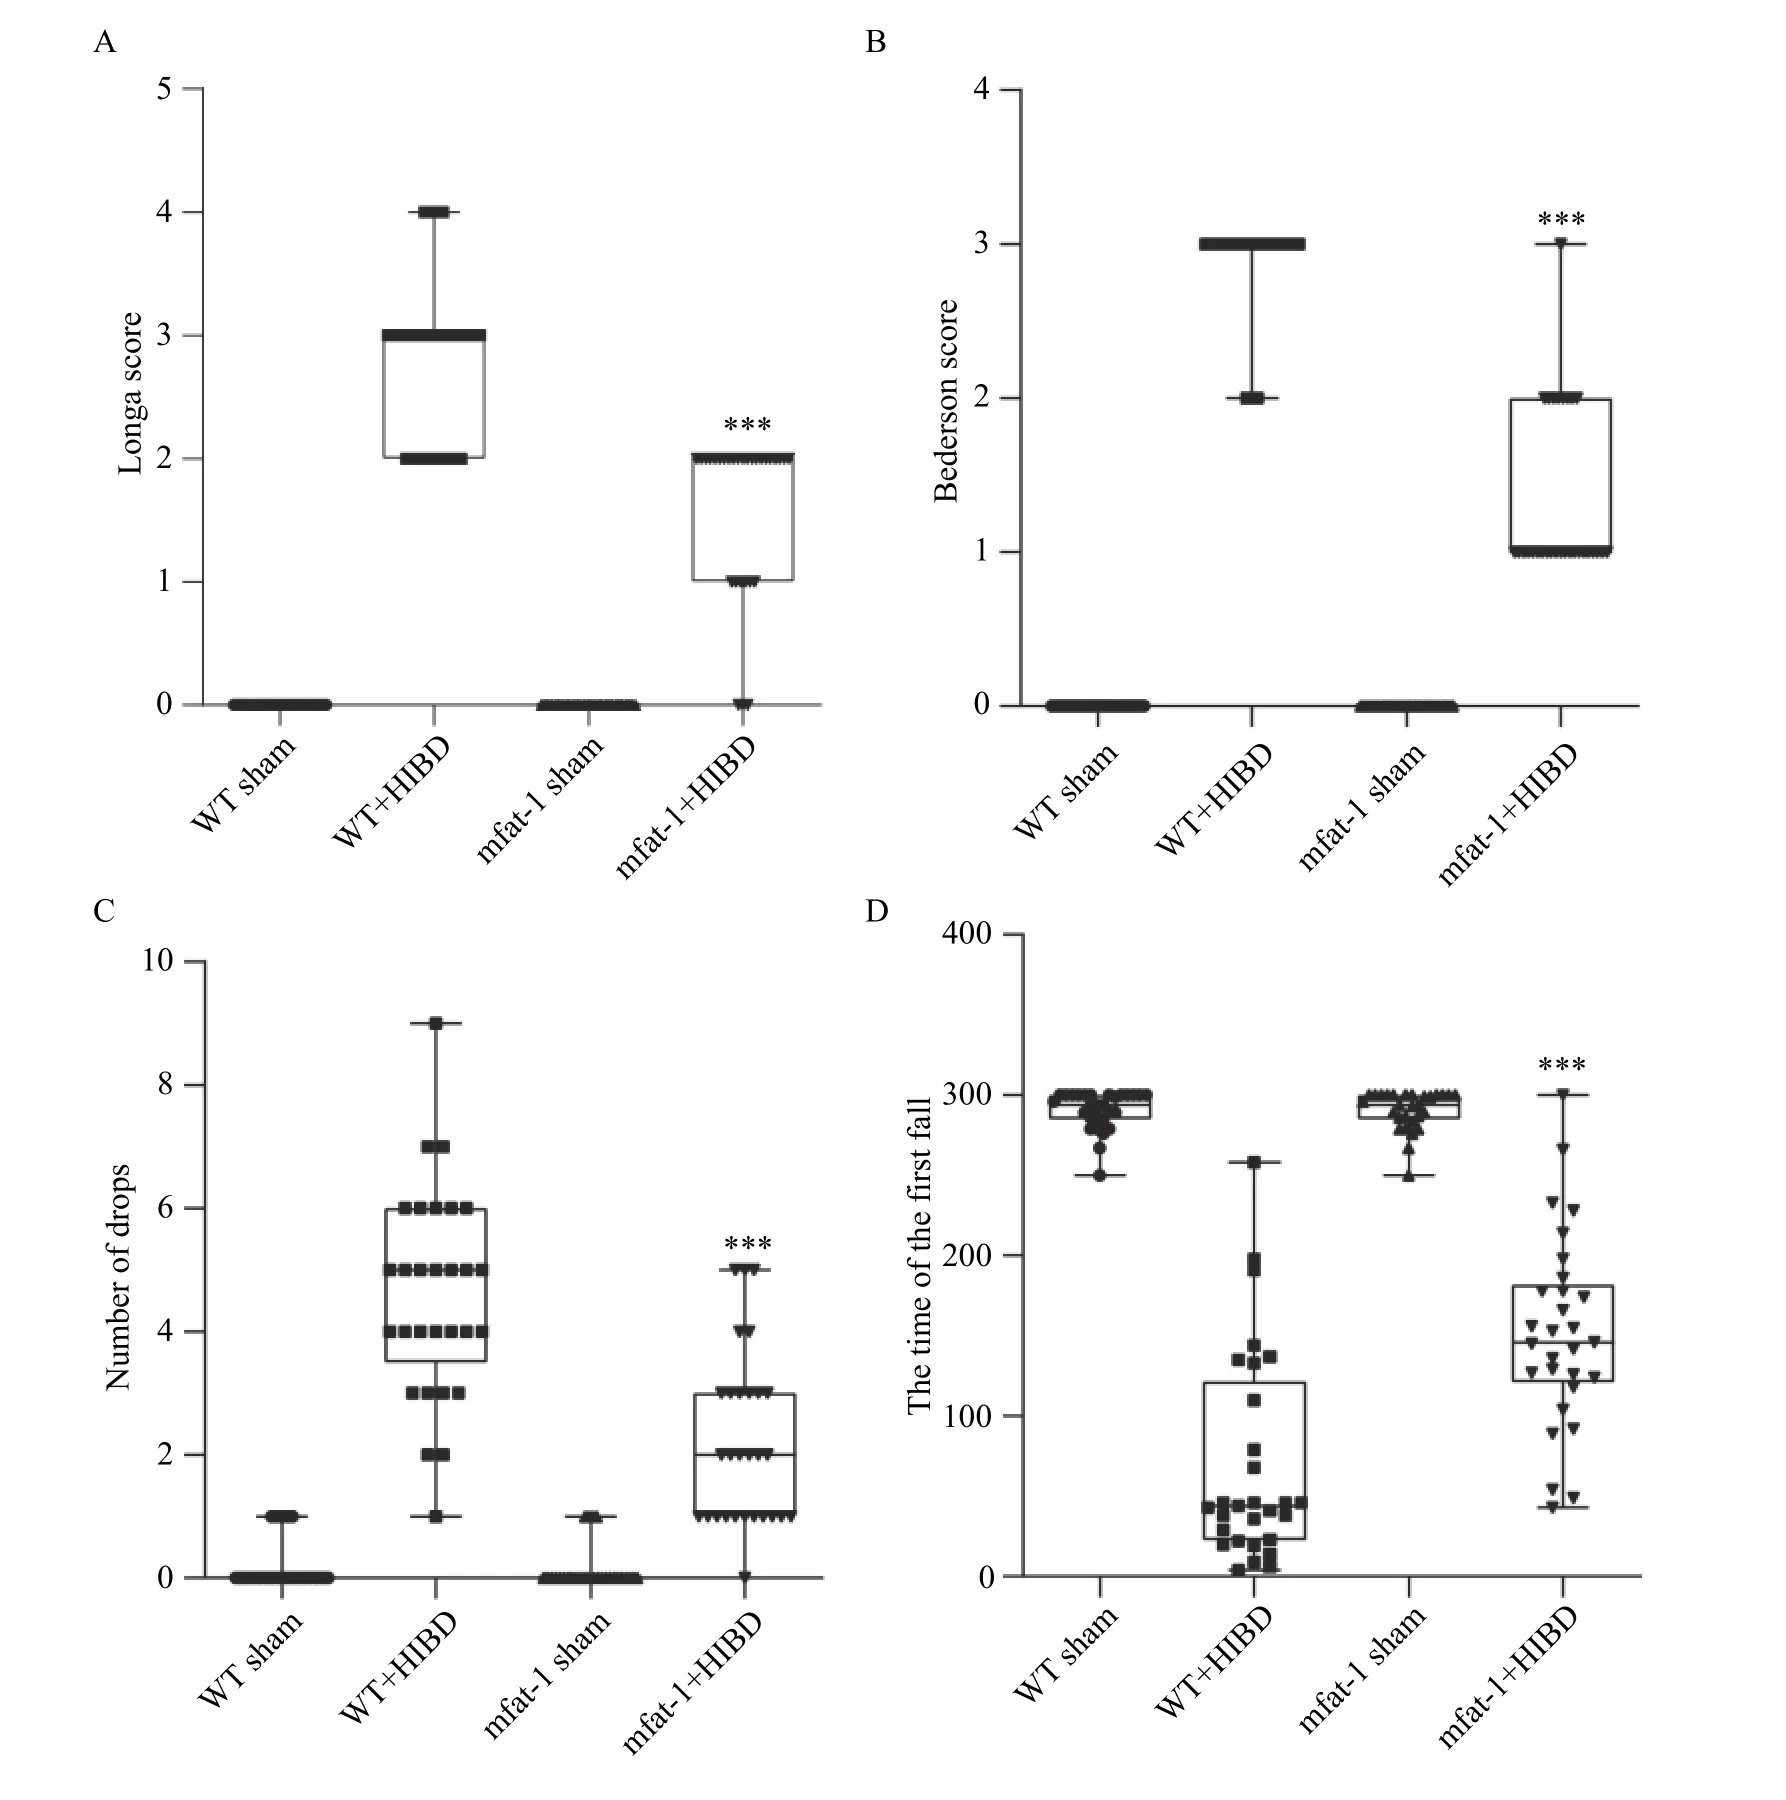
Fig. 3 mfat-1 mice with HIBD improved neurobehavioral performance. A: Longa 5-point scores after HIBD in 24 hours. B: Bederson score after HIBD in 24 hours. n=30 per group. C and D: Represented frequency of drops and latency to falls within 300 seconds. n=29 per group. All values were expressed as mean±SD. Student's t-tests were performed. ***P<0.001. HIBD: hypoxic-ischemic brain damage;
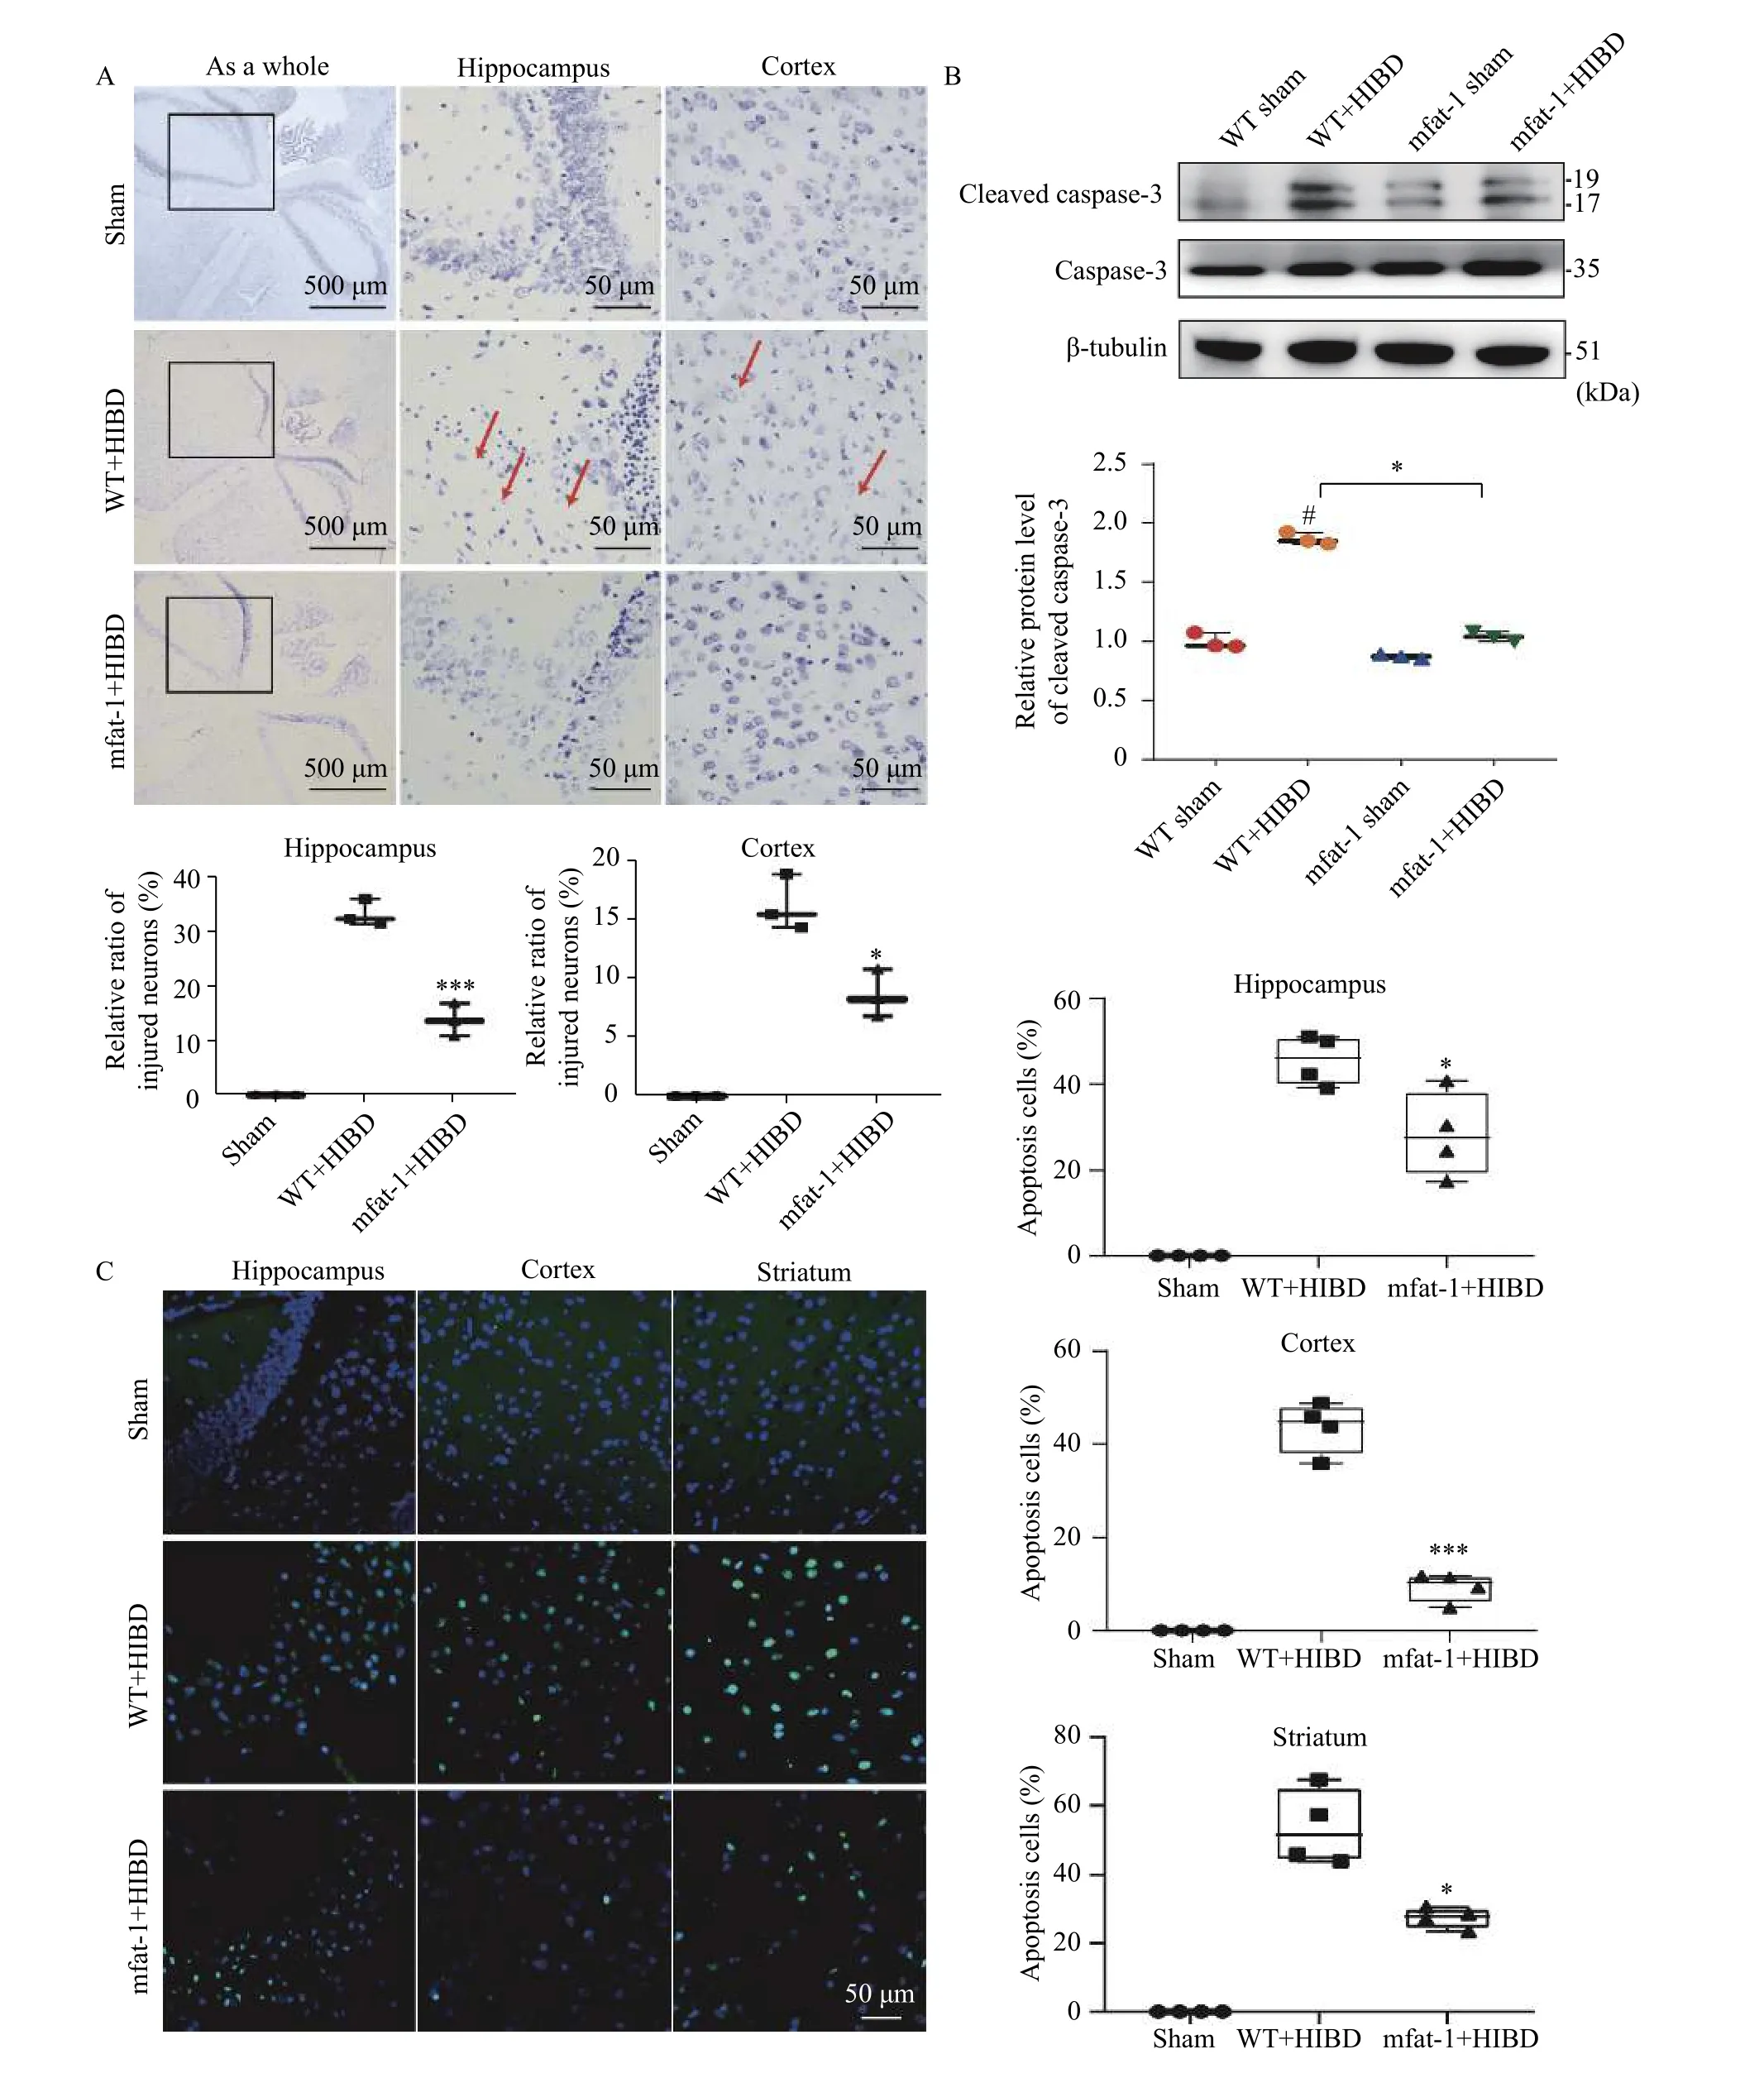
Fig. 4 mfat-1 mice protected against HIBD-induced neuronal apoptosis. A: Nissl staining. The red arrow pointed to damaged neurons with shrunken bodies, concentrated nuclei, pale cytoplasm, and vacuoles. Scale bar: 500 μm in the left panel; 50 μm in the middle and right panels. Below is a quantitative analysis of the loss of Nissl corpuscle in the hippocampus and cortex. The data are expressed as the mean±SD; n=3 per group. Student's t-test was performed. *P<0.05, **P<0.01. B: Cleaved caspase-3 protein expression of the ischemic regions after HIBD by western blotting. The above panel showed cleaved caspase-3 and the corresponding β-tubulin bands (representative). The below panel showed the densitometric analysis. The data are expressed as the mean±SD; n=3 per group. Two-way ANOVA and post hoc Tukey tests were performed. #P<0.05 vs. sham, *P<0.05 vs. WT. C: Representative photomicrographs showing TUNEL staining in the ischemic regions (left). Scale bar, 50 μm. The percentage of TUNEL-positive cells in the hippocampus, cortex and striatum respectively(right). The data are expressed as the mean±SD; n=4 per group. Student's t-test was performed. *P<0.05, ***P<0.001. HIBD: hypoxic-ischemic brain damage; WT: wild-type.
Verification of the differentially expressed genes on HIBD
Enrichment network analysis revealed thatIl6,Il1b,Tnfα, Jun proto-oncogene (Jun), Matrix metallopeptidase 3 (Mmp3), Toll-like receptor 4(Tlr4), Chemokine (C-X-C motif) ligand 1 (Cxcl1),Cxcl2,Cxcl3, Chemokine (C-C motif) ligand 2 (Ccl2),andCcl2were involved in most of the pathways that were significantly enriched by all downregulated genes. The mRNA and protein expression levels of inflammatory factors were also verified (Fig. 5),which coincided with the RNA-seq results. In addition, we also found thatMapk12,Pik3r3,Itpr3,Foxo3,Itrp1,Grid2, andRps6ka1were involved in the regulation of most of the pathways that were significantly enriched by upregulated genes. These genes belonged to the neurotrophin pathway. Then,protein interaction analysis was performed on these highly enriched genes (Fig. 7AandC). Next, RTqPCR was conducted to verify the expression of these screened, and the results coincided with the findings of RNA-seq transcriptome analysis (Fig. 7BandD).Analyze of the protein-protein interactions of these highly involved DEGs verified the reliability of our RNA-seq results.

Fig. 5 mfat-1 transgenic mice showed reduced neuroinflammation in HIBD. A–C: qRT-PCR for brain tissue after HIBD: representation of the fold changes of the mRNA levels of Tnfa, Il6, and Il1b. D–F: After HIBD, expression levels of pro-inflammatory factors, TNF-α, IL-6 and IL-1β were measured by ELISA assay. The data are expressed as the mean±SD; n=3 per group. Two-way ANOVA and post hoc Tukey tests were performed. *P<0.05, ***P<0.001; #P<0.05, ##P<0.01, ###P<0.001 vs. sham group. HIBD: hypoxic-ischemic brain damage; WT: wildtype.
Repressed neuroinflammation in mfat-1 mice is related to GPR120
The results of RNA-seq analysis showed that the most extensive changes in brain after HIBD were related to pathways of inflammatory response.According to reports, as a key receptor/sensor for n-3 PUFA, GPR120 can be paired with β-arrestin2 to further endocytose the receptor and inhibit the activation of transforming growth factor β-activated kinase 1 (TAK1), thereby mediating a powerful and extensive anti-inflammatory effects[31]. However,studies on GPR120 in the nervous system are limited.In our case, GPR120 expression level was higher in the mfat-1+HIBD group compared with the WT+HIBD group, and its expression was verified by immunofluorescence (Fig. 8AandB,P<0.05).Interestingly, in the brains of mice without ischemia and hypoxia, the protein expression level of GPR120 in mfat-1 mice was significantly higher than that in WT mice (Fig. 8C,P<0.05), which may be related to the high ratio of n-3/n-6 PUFAs in the brain. A recent study revealed that mfat-1 mice and n-3 PUFAs-fed WT mice exhibited upregulated GPR120 expression in the adipose tissues[32]. Previous studies have reported that through the GPR120 signaling pathway, n-3 PUFAs pretreatment could inhibit downstream proinflammatory responses such as the phosphorylation of TAK1 and nuclear factor-κB (NF-κB)[33–34]. TAK1,has dual functions,i.e., as a cell death inducer and a master regulator of numerous inflammatory signaling molecules[35]. The phosphorylation activation of NFκB plays a key regulatory role in the inflammatory response[36]. Hence, we performed western blotting of p-NF-κB p65 and p-TAK1. However, there were low levels of phosphorylated TAK and NF-κB in mfat-1+HIBD group (Fig. 8DandE,P<0.05). This may be related to the classic anti-inflammatory pathway mediated by GPR120. However, this is not absolute,because in our research, we found that GPR120 in mfat-1 mice significantly increased under physiological conditions, the levels of phosphorylated TAK and NF-κB did not decrease. This indicates that there is not a single pathway regulating the expression of downstream molecules of inflammatory signals. In addition to the anti-inflammatory effect mediated by GPR120,other molecular mechanisms should be explored.
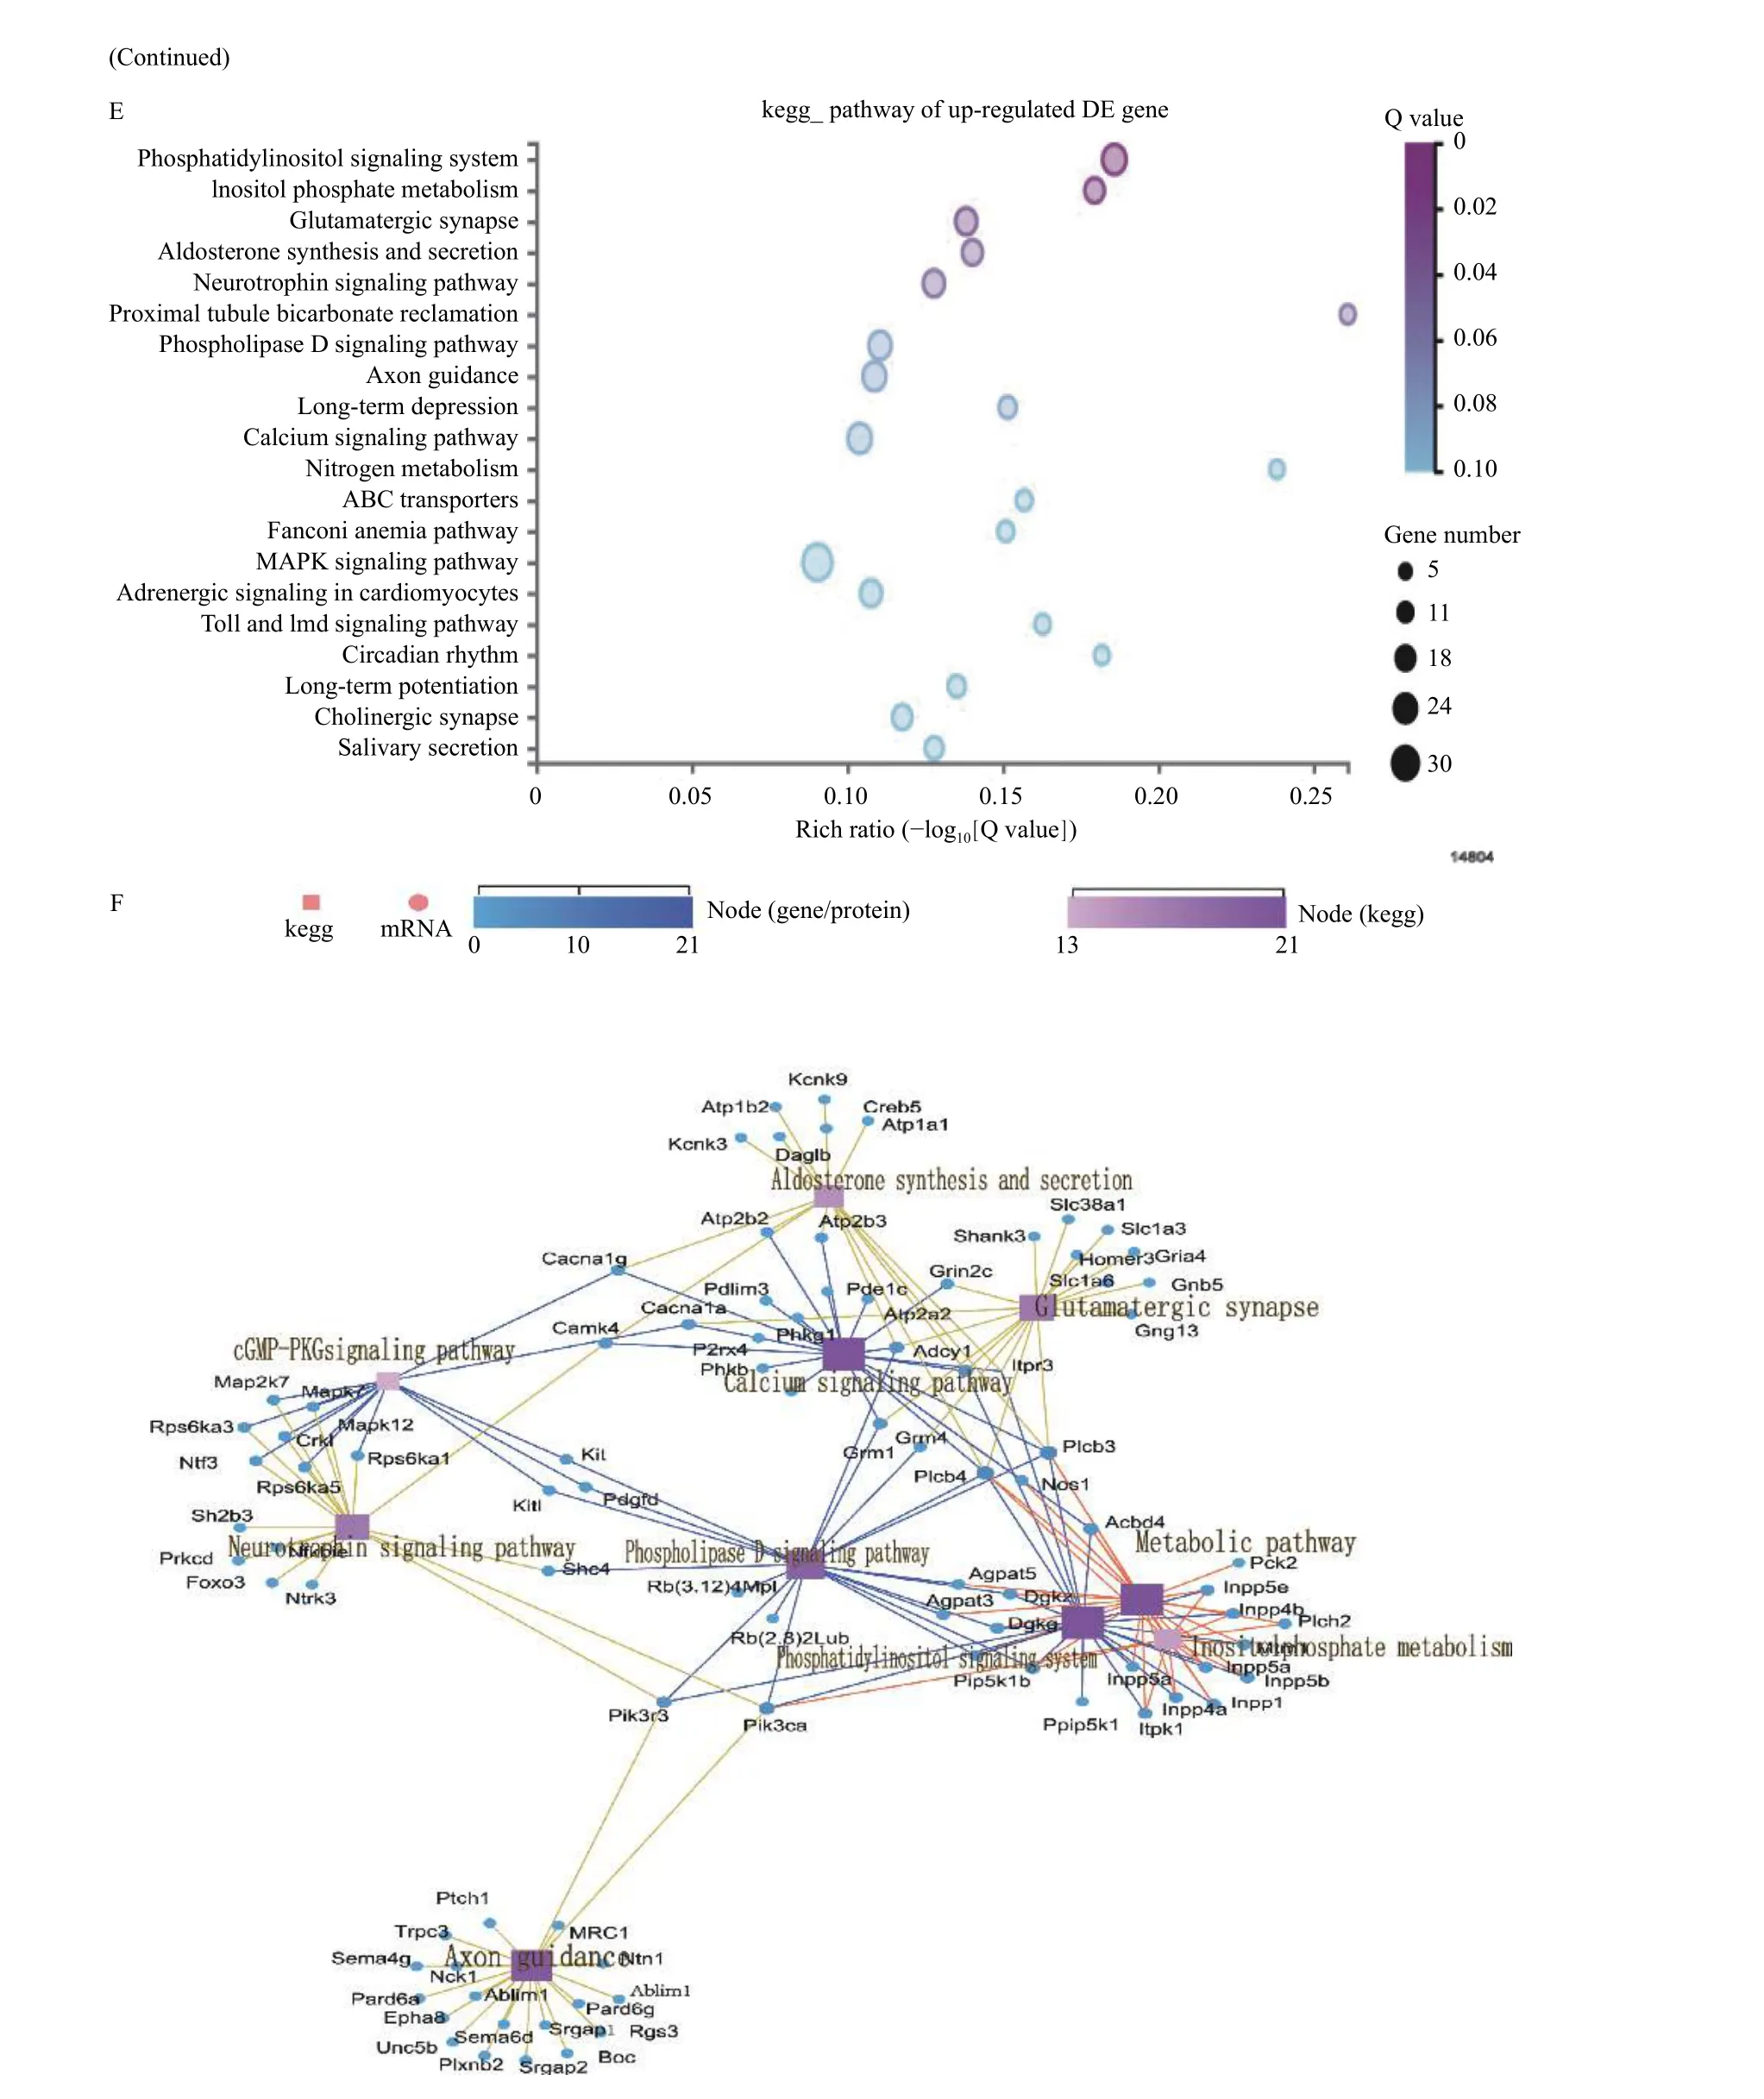
Fig. 6 RNA-seq analysis on HIBD. A: The cluster heat map of all DEGs in brain tissues of transgenic mice and WT mice in sham group.The mapping data for this analysis was the centralized and standardized gene expression (FPKM), and the color gradient from blue to red indicates the change of gene expression from low to high, then make KEGG pathway term level 2 annotations based on all differentially expressed genes. Horizontal: clustering between samples, reflecting the repeatability of samples. Longitudinal: Gene clustering, reflecting the similarity of different gene functions. Different square color blocks corresponded to specific gene enrichment pathways. B: Volcano map analysis of all DEGs in WT+HIBD and mfat-1+HIBD groups. The horizontal axis was log2(fold change) (mfat-1-HIBD/WT-HIBD), the vertical axis was −log10(Q-value), and each point represented a gene. Blue dots represented downregulated genes; red dots represented upregulated genes. C: KEGG analysis of downregulated DEGs between WT+HIBD and mfat-1+HIBD groups. D: The Cytoscape was used to visualize the network interaction analysis of the enrichment pathways of the downregulated DEGs. E: KEGG analysis of upregulated DEGs between WT+HIBD and mfat-1+HIBD groups. F: The Cytoscape was used to visualize the network interaction analysis of the enrichment pathways of the upregulated DEGs. P-value was calculated, and P-value was then FDR corrected. DEGs: differentially expressed genes. HIBD: hypoxic-ischemic brain damage; WT: wild-type.
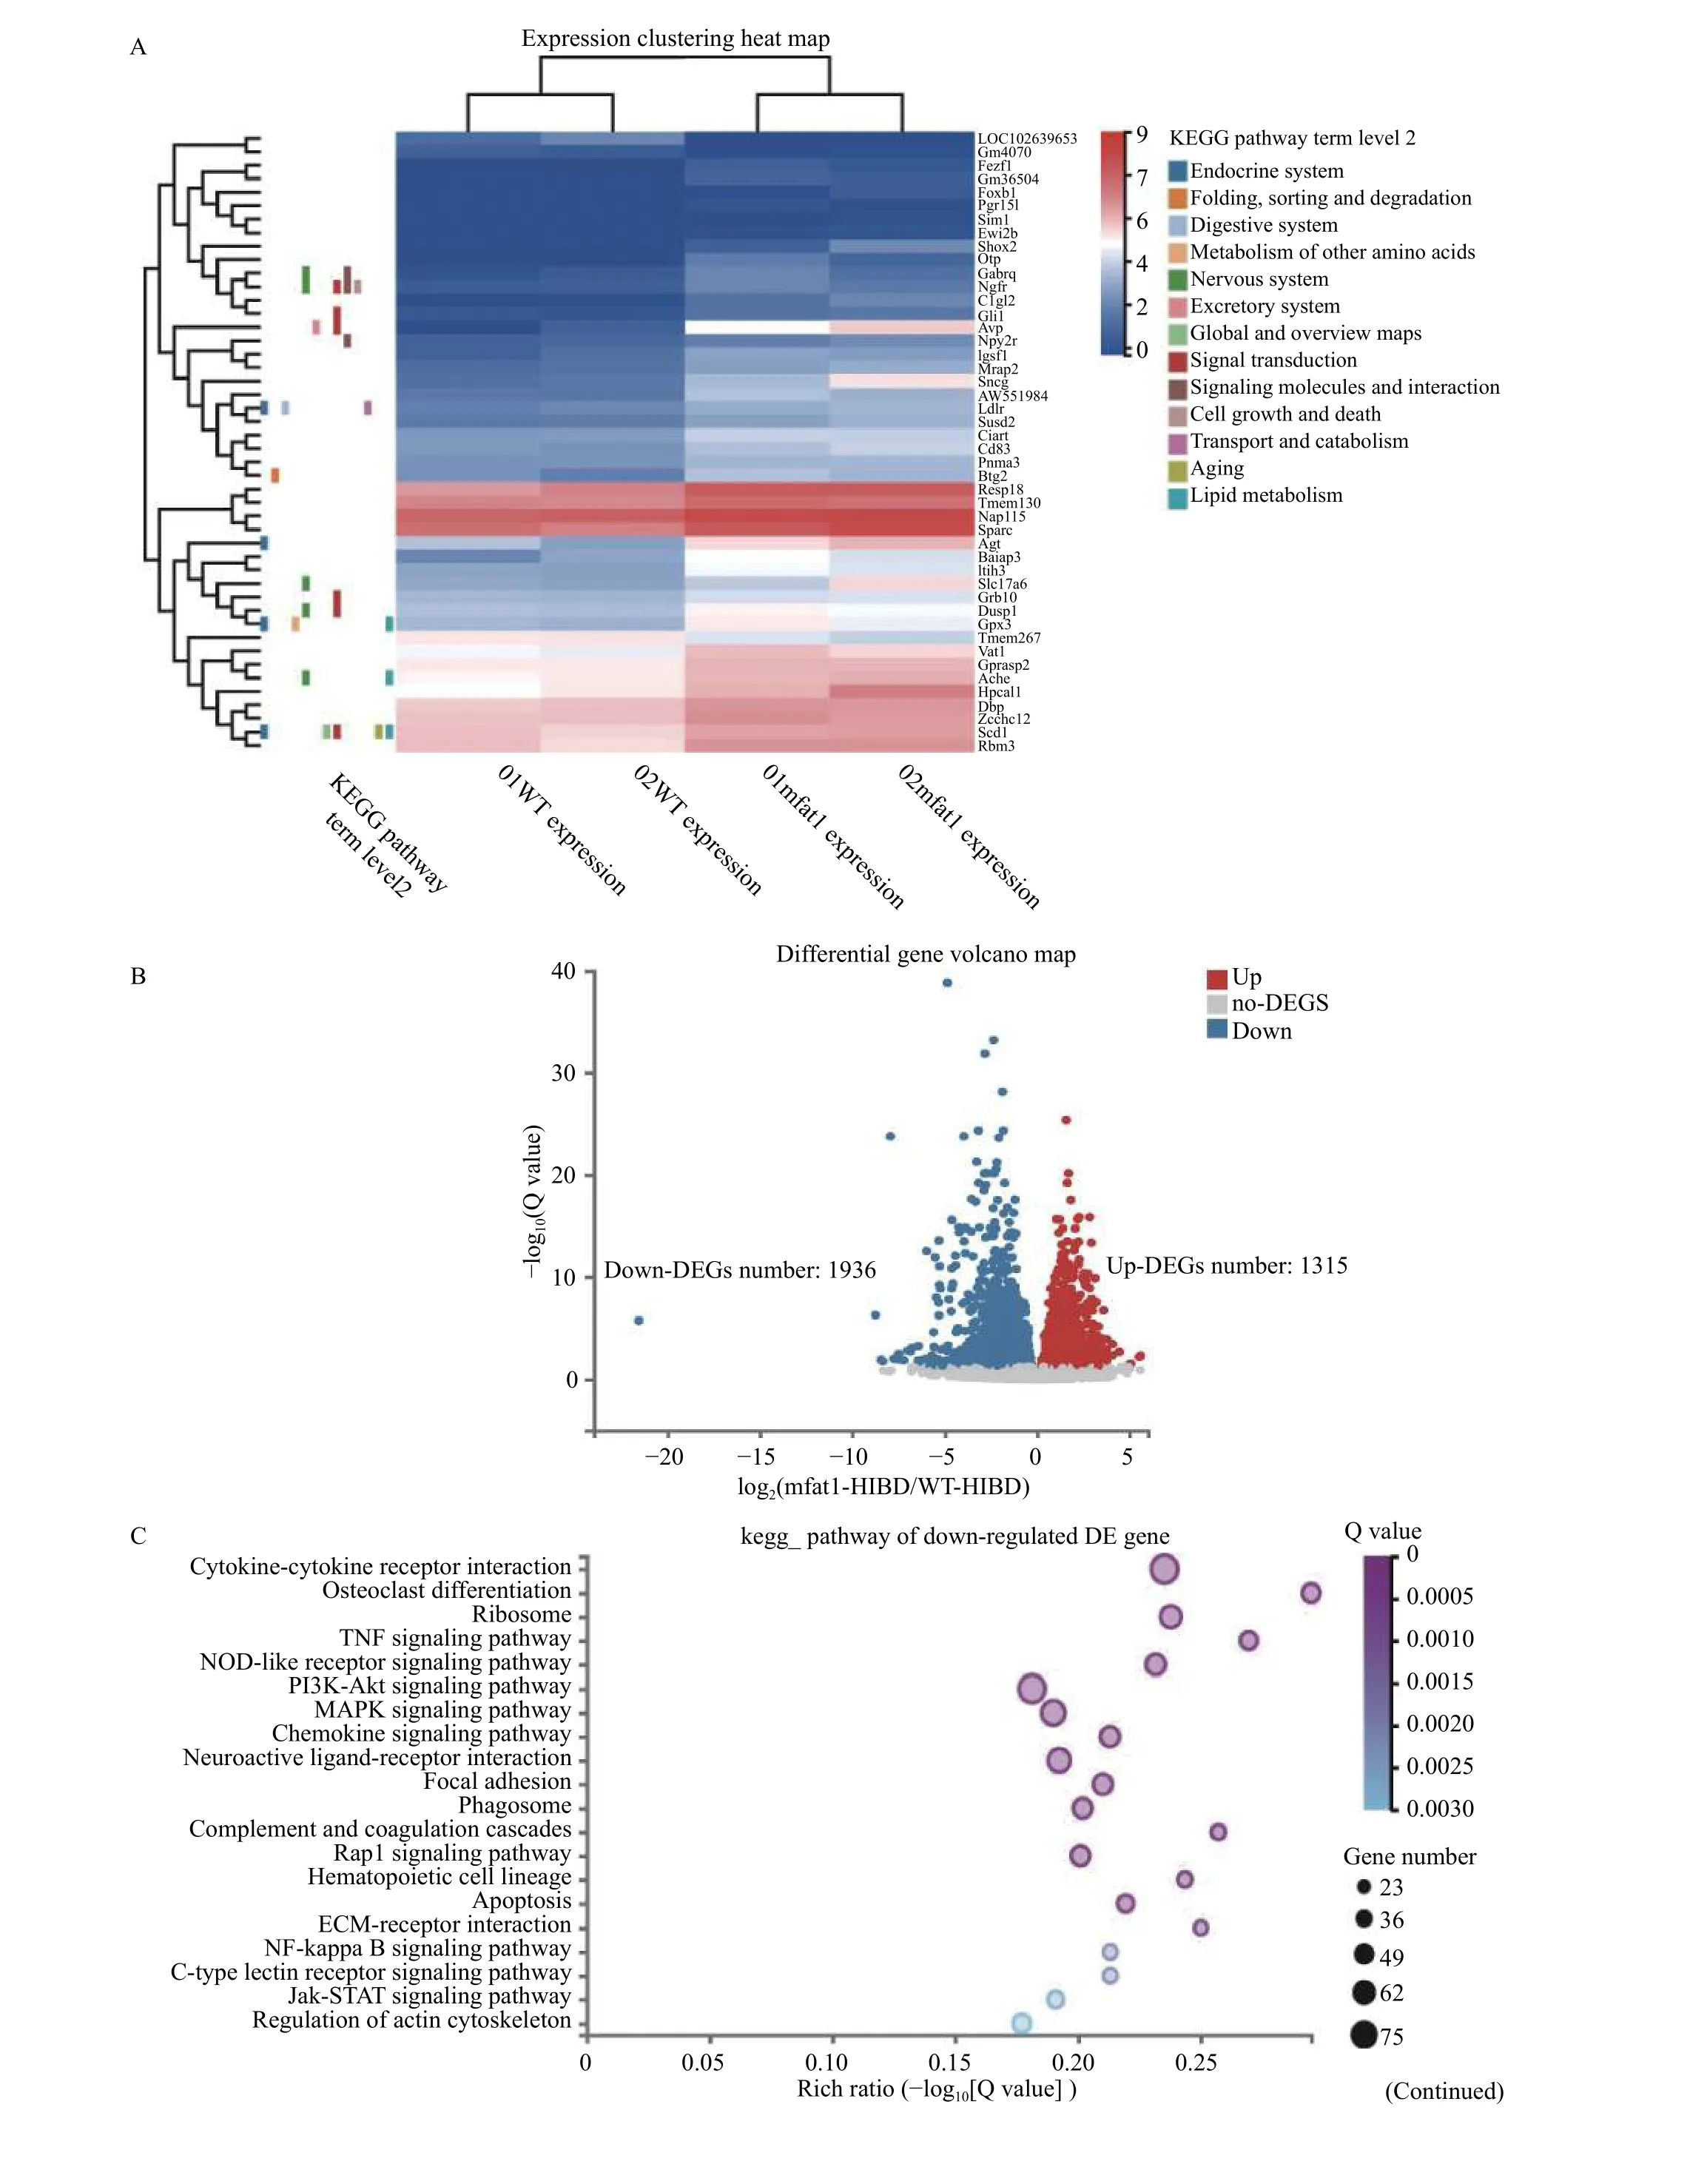
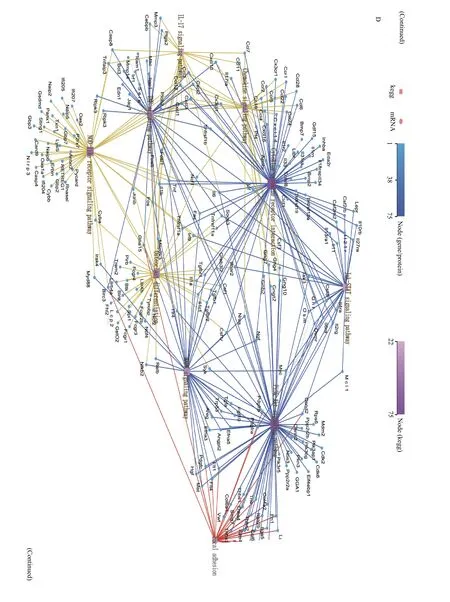
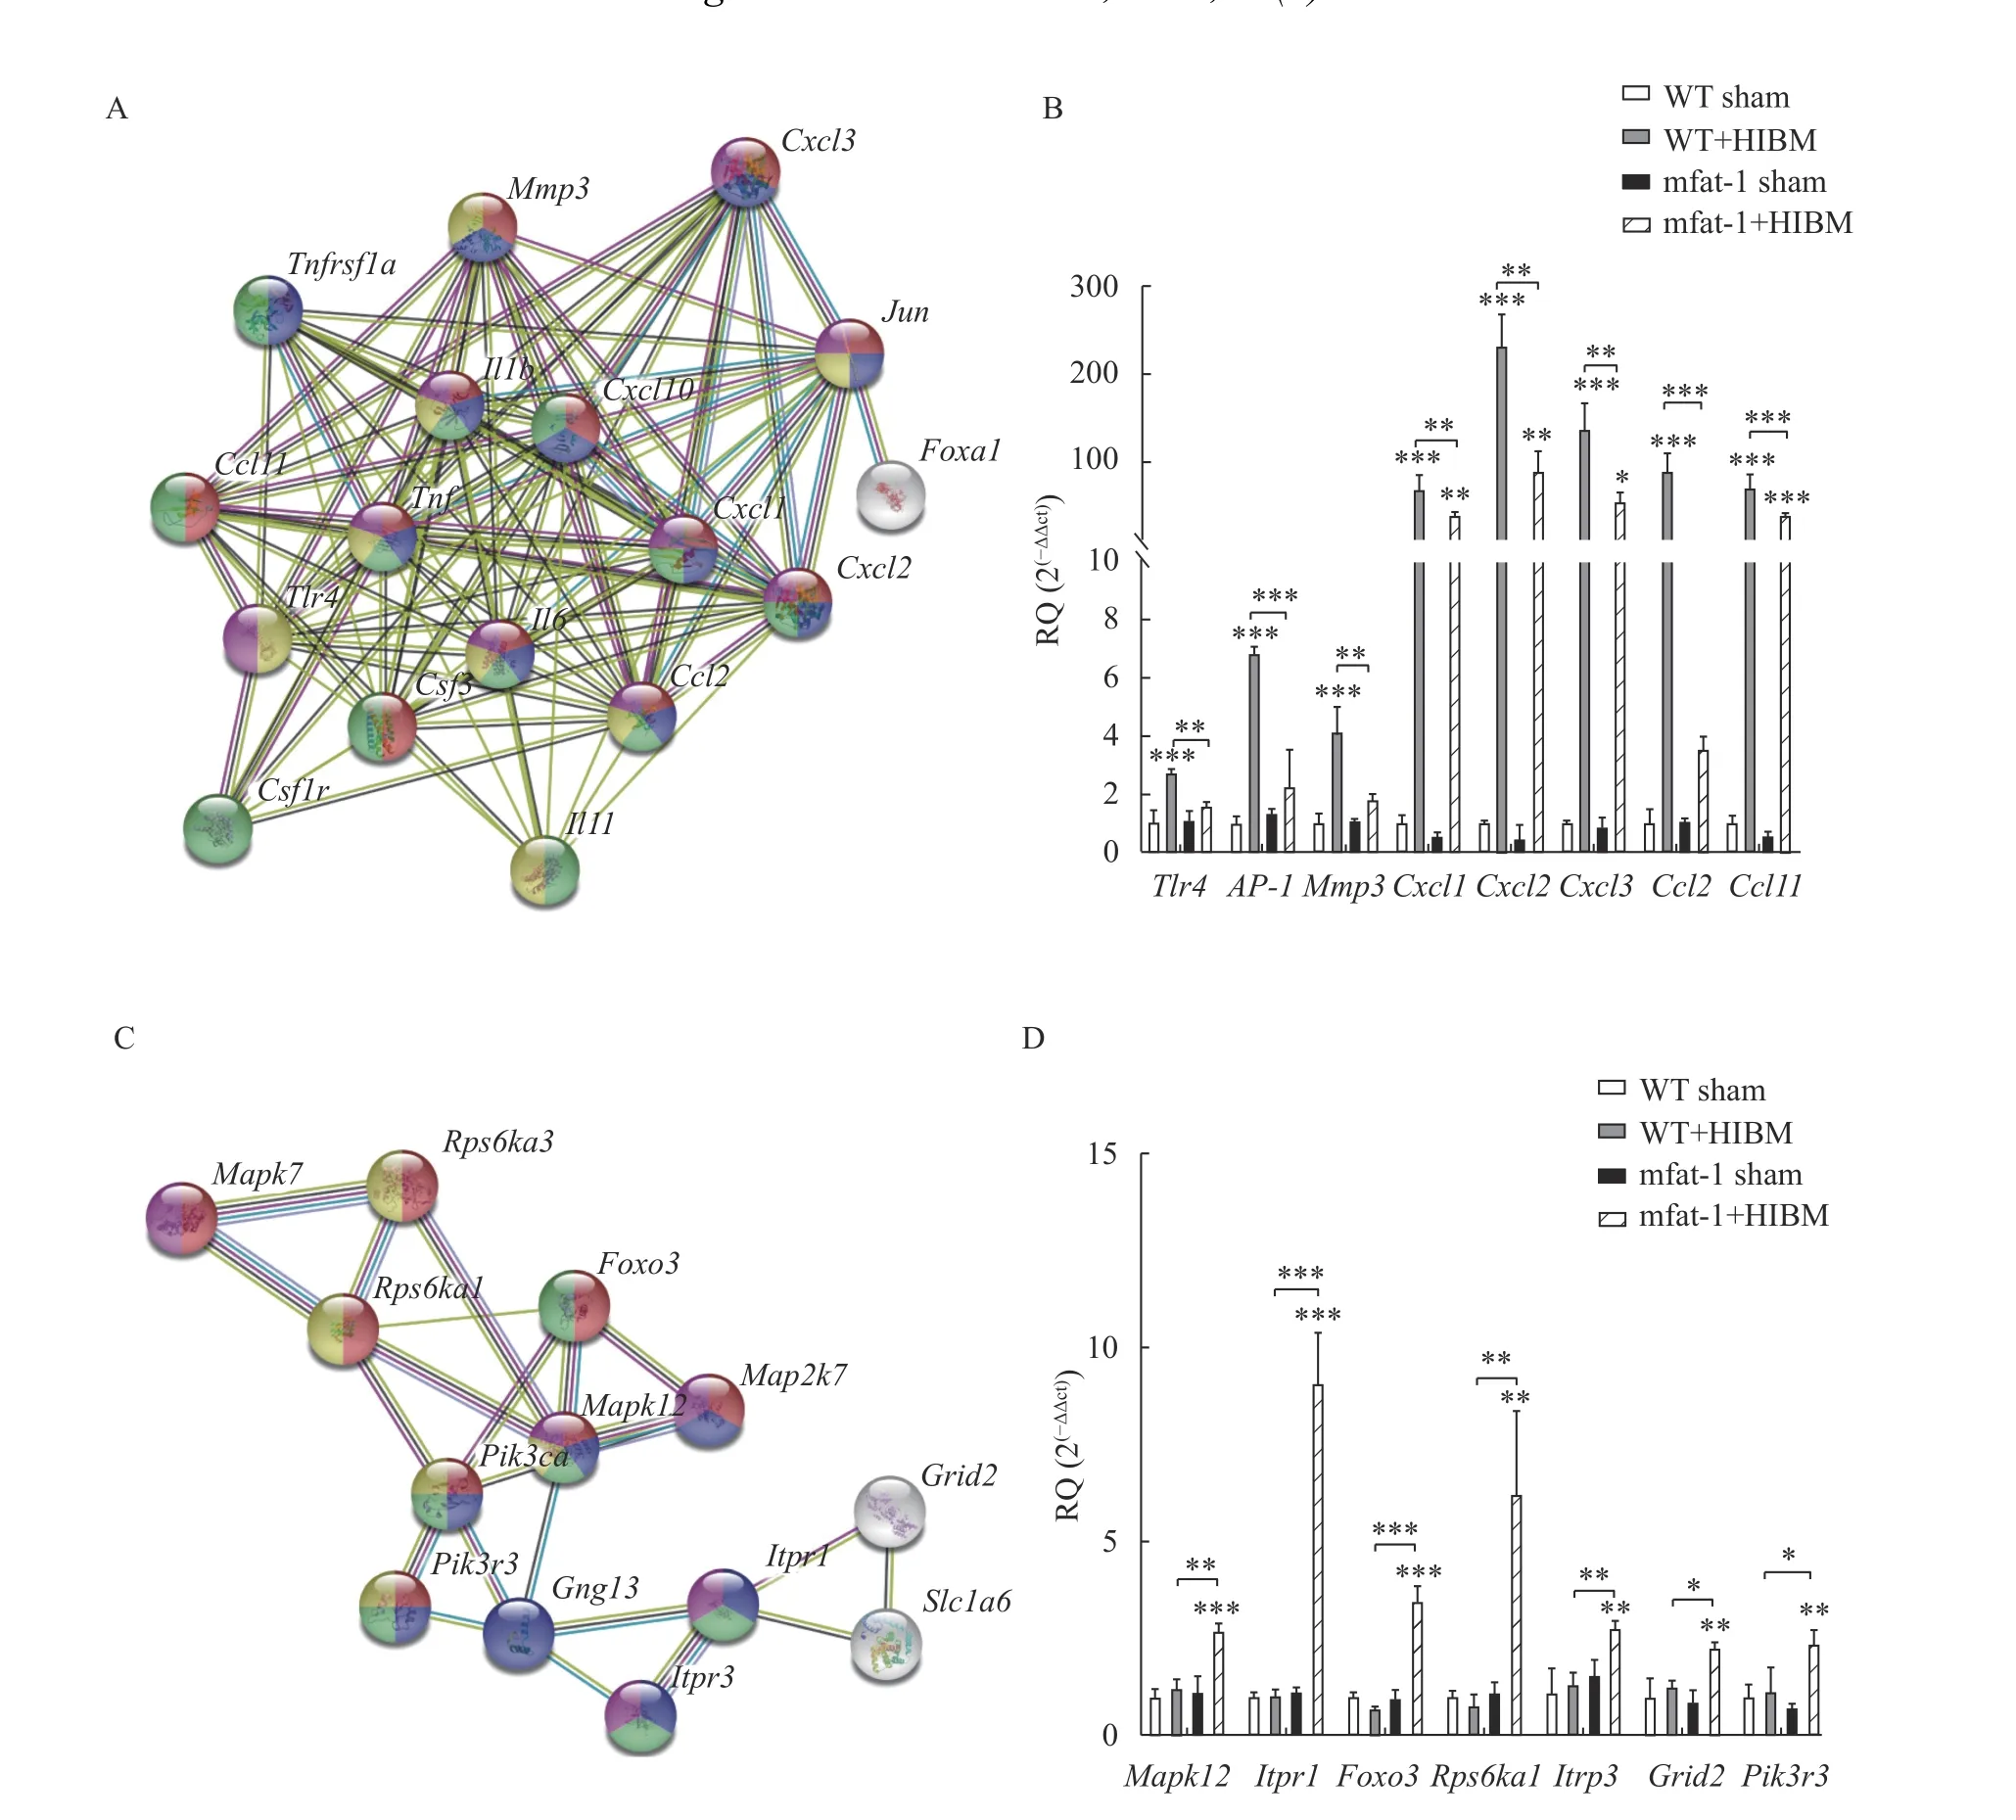
Fig. 7 Verification of differentially expressed genes on HIBD. A: Protein-protein interaction network among all downregulated genes.Edges represented protein-protein associations. B: Transcriptional level of downregulated genes by qRT-PCR, representation of the fold changes of the mRNA levels of downregulated genes. C: Protein-protein interaction network among upregulated genes. Edges represented protein-protein associations. D: Transcriptional level of upregulated genes by qRT-PCR, representation of the fold changes of the mRNA levels of upregulated genes. The data are expressed as the mean±SD; n=3 per group. Student's t-test was performed. *P<0.05, **P<0.01,***P<0.001. HIBD: hypoxic-ischemic brain damage; RQ: relative quantification; qRT-PCR: real-time reverse transcription-PCR.
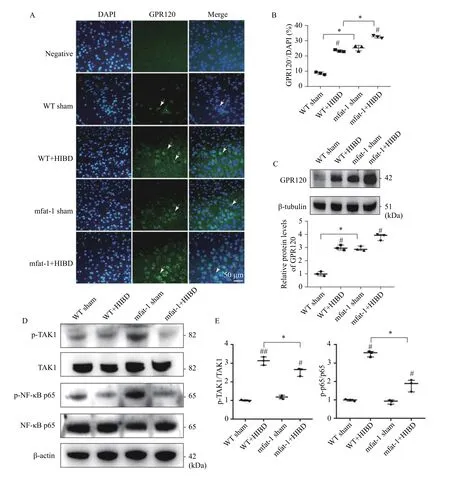
Fig. 8 Alleviating neuroinflammation protects against HIBD in mfat-1 mice that is related to GPR120. The expression of GPR120 and related downstream genes were measured in mfat-1 and WT mice after HIBD in 24 hours. A: The expression level of GPR120 in the cerebral cortex (green) detected by immunofluorescence analysis. Nuclei were fluorescently labeled with DAPI (blue). Scale bar, 50 μm. B:Quantitative analysis of GPR120 protein in immunofluorescence experiment. The results were expressed as the number of GPR120+neurons/DAPI (%). C: GPR120 protein levels in brain tissues was detected by Western blotting. D and E: p-NF-κB p65 and p-TAK1 protein levels in brain tissues detected by Western blotting. The data are expressed as the mean±SD; n=3 per group. Two-way ANOVA and post hoc Tukey tests were performed. *P<0.05; #P<0.05, ##P<0.01, vs. sham group. HIBD: hypoxic-ischemic brain damage; WT: wild-type.
Discussion
One of the significant risk factors that patients might develop during major cardiothoracic surgery is ischemic stroke[37]. To prevent subsequent occurrence of central nervous system diseases, relevant prevention and treatment measures must be taken seriously. Different methods have been tried, either pharmacological or non-pharmacological[38–40].However, high proportion of endogenous n-3/n-6 PUFAs may be protective in an adult HIBD model,although its underlying mechanism requires further investigation.
Well-controlled mfat-1 transgenic mice on a normal diet were used in the current study, and the ratio of n-3/n-6 PUFAs (DHA+EPA+DPA+ALA/LA+AA) was statistically higher in the brain tissues of littermates in mfat-1 mice. Consistent with our pervious report[14],the n-3 PUFAs in the brains of mfat-1 mice not only contain a higher proportion of DHA, but also EPA and DPA that are almost absent in the brain of WT mice.In this study, mfat-1 transgenic mice imparted protective effects on HIBD-induced brain damage by significantly decreasing infarct range, markedly improving neurobehavioral defects, and resulting in relatively lower levels of neuronal necrosis, apoptosis,and inflammation. Studies have revealed its pathological mechanism in the neonatal perinatal period[41–42]. However, no studies on mfat-1 transgenic mice during the perioperative period have been conducted to date, and its protective mechanism remains unclear. Whole-transcriptome deep sequencing of the ischemic hemispheric brain tissue of mfat-1 transgenic mice was performed on normal conditions and on adult HIBD for the first time. First,the transcription level of the mfat-1 transgene was stable and high in brain tissues. In addition, many DEGs such as SCD1, GPX3, DUSP1, Susd2, and Ngfr are involved in the synthesis, metabolism, and transport of fatty acids in the brain[43–45]. RNA-seq was applied for analysis of DEGs of WT and mfat-1 mice 24 hours after acute ischemia and hypoxia. To our knowledge, this is the first study that has conducted gene expression profiling and identified key pathways of HIBD in mfat-1 mice. The results of this study provide multi-faceted research directions and targets for the subsequent study of mfat-1 transgenic mice in ischemic and hypoxic diseases.
Among them, the anti-inflammatory signaling pathway is the most significant. However, the inflammatory-related targets and pathways after HIBD in adults during the perioperative period remain unclear. GPR120 is an important receptor for n-3 PUFAs and is mainly expressed in the olfactory bulb,cerebral cortex, and hippocampus on physiological condition and its expression is activated in the HIBD model. Serving as an anti-inflammatory factor,GPR120 couples with β-arrestin 2 to induce receptor endocytosis, which in turn inactivates phosphorylation of NF-κB, thereby providing a mechanism to inhibit inflammation signaling pathways[46-47]. As expected,we found that GPR120 expression in the penumbra of the affected side of WT and mfat-1 mice significantly increased after acute hypoxia-ischemic injury. It was worth noting that in sham group, GPR120 in WT and mfat-1 mice differed as well. Although the expression level of GPR120 in the penumbra of WT mice was significantly increased after acute ischemia and hypoxia, downstream TAK1 that is activated by the receptor after endocytosis was not downregulated, and thus neuronal necrosis and apoptosis caused by inflammation was not inhibited. On the contrary, the expression of GPR120 in mfat-1 mice was upregulated under physiological conditions.Approximately 24 hours after acute ischemic hypoxia,GPR120 was overactivated further, and phosphorylation of TAK1 and NF-κB were inhibited significantly. Of note, endogenous n-3 PUFAs might also exert anti-inflammatory effects through other mechanisms. For example, recent studies have shown that metabolites of n-3 PUFAs such as resolvins,protectins, and maresin may play a role in improving inflammation[48]. More research on the molecular mechanisms by which endogenous n-3/n-6 PUFAs impart a protective effect on the brain, and the interaction mechanisms between highly expressed GPR120 and mfat-1 transgenic mice in specific nerve cells are also warranted.
Conclusions
mfat-1 mice showed better outcomes after acute hypoxia-ischemic stroke that occurs during the perioperative period. Among the multiple complicated pathological protection mechanisms, these outcomes mainly occur through a reduction in inflammatory responses, which may be associated with the activation of GPR120 and regulation of TAK1/ NF-κB signaling. This signaling pathway inhibits the production of inflammatory cytokines in the brain,thereby protecting brain damage caused by acute ischemia and hypoxia. These insights may be used as a basis for broadening the scope of treatment of hypoxia-ischemia-related encephalopathy during the perioperative period.
CLINICAL TRIAL REGISTRATION
TheJournalrequires investigators to register their clinical trials in a public trials registry for publication of reports of clinical trials in theJournal. Information on requirements and acceptable registries is available at https: //clinicaltrials.gov/.
Acknowledgments
The work was supported by funds from the National Natural Science Foundation of China (Grant No. 31701283 and No. 81970164), the National Key R&D Program of China (Grant No. 2017YFC1103701 and No. 2017YFC1103702) and Jiangsu Key Laboratory of Xenotransplantation (Grant No.BM2012116).
杂志排行
THE JOURNAL OF BIOMEDICAL RESEARCH的其它文章
- Paclitaxel-induced stress granules increase LINE-1 mRNA stability to promote drug resistance in breast cancer cells
- Construction of miRNA-mRNA network reveals crucial miRNAs and genes in acute myocardial infarction
- Isometric exercise promotes arteriogenesis in rats after myocardial infarction
- Ovalicin attenuates atopic dermatitis symptoms by inhibiting IL-31 signaling and intracellular calcium influx
- Target specificity of selective bioactive compounds in blocking α-dystroglycan receptor to suppress Lassa virus infection: an in silico approach
- Application of a continuous respiratory sound monitoring system in thoracic surgery
