Association between admission hemoglobin level and prognosis in patients with type 2 diabetes mellitus
2021-11-23HaiYingSongCuiMeiWeiWenXiongZhouHaoFeiHuQiJunWan
Hai-Ying Song,Cui-Mei Wei,Wen-Xiong Zhou,Hao-Fei Hu,Qi-Jun Wan
Hai-Ying Song,Cui-Mei Wei,Wen-Xiong Zhou,Hao-Fei Hu,Qi-Jun Wan,Department of Nephrology,The First Affiliated Hospital of Shenzhen University,Shenzhen Second People’s Hospital,Shenzhen 518035,Guangdong Province,China
Hai-Ying Song,Cui-Mei Wei,Wen-Xiong Zhou,Hao-Fei Hu,Qi-Jun Wan,Department of Nephrology,Shenzhen University Health Science Center,Shenzhen 518035,Guangdong Province,China
Abstract BACKGROUND Anaemia is common in patients with chronic kidney disease(CKD)and is a major risk factor that contributes to mortality in such patients.Type 2 diabetes mellitus(T2DM)is one of the leading causes of CKD.The association between admission hemoglobin levels and renal damage in patients with T2DM remains unclear.AIM To evaluate the relationship between admission hemoglobin levels and prognosis in patients with T2DM.METHODS We performed a retrospective analysis of 265 consecutive patients presenting with T2DM between 2011 and 2015.The composite endpoint was end-stage renal disease or a 50% reduction in the estimated glomerular filtration rate.RESULTSIn multivariable-adjusted Cox proportional hazards models(adjusting for demographic factors,traditional risk factors,lipids),the adjusted hazard ratios(HRs)for the highest and middle tertiles compared to the lowest tertile of hemoglobin were 0.82(95%CI:0.11-6.26,P = 0.8457)and 0.28(95%CI:0.09-0.85,P = 0.0246),respectively.However,after further adjustment for glycaemia control,hemoglobin was positively related to the risk of the composite endpoint(HR:1.05,95%CI:0.14-8.09,P = 0.9602)when the highest tertile was compared to the lowest tertile of hemoglobin.We found a U-shaped relationship between hemoglobin levels and the composite endpoint.The curve tended to reach the lowest level at an optimal hemoglobin level.CONCLUSION Among patients with T2DM,a U-shaped relationship was observed between hemoglobin levels and renal damage.A lower admission hemoglobin level(hemoglobin < 13.3 g/dL)is an independent predictor of renal damage.
Key Words:Type 2 diabetes mellitus;Hemoglobin;Renal damage;Prognosis
INTRODUCTION
Anaemia is a common complication of chronic kidney disease(CKD).Low hemoglobin level is one of the major risk factors for cardiovascular disease(CVD)and mortality and poor prognosis in CKD patients[1-4].However,some studies have shown that higher hemoglobin levels slightly increase the risk of death[5],and elevations in hemoglobin levels have been implicated in a higher risk of mortality and cardiovascular events[6,7].Information on the association of hemoglobin and renal damage is uncertain,and the optimal hemoglobin target in CKD patients remains controversial.Type 2 diabetes mellitus(T2DM)is one of the leading causes of CKD.The admission hemoglobin levels would influence the prognosis in patients with T2DM.In the present study,we aimed to evaluate the relationship between admission hemoglobin levels and the prevalence of renal damage and the decline in the estimated glomerular filtration rate(eGFR)in patients with T2DM.Our hypothesis was that there may be an optimal hemoglobin level about the relationship between hemoglobin and renal progression in patients with T2DM.This study may help us to find the optimal hemoglobin level.And the optimal hemoglobin level may be used as an intervention target for patients with T2DM.
MATERIALS AND METHODS
This was a retrospective cohort study.The details of this study were described previously[8].We used the database from the Shenzhen Second People’s Hospital and reviewed the records.A total of 265 patients diagnosed with T2DM were enrolled between January 2011 and December 2015 and followed until June 2016 at the Department of Nephrology and Endocrinology of Shenzhen Second People’s Hospital.The patients were followed every 3 mo for at least 3 mo until study endpoint or deadline.The deadline for the study was June 30,2016.Patients with moderate to severe valvular disease,atrial fibrillation,other severe arrhythmias,congenital heart disease,or primary myocardial disease were excluded.The patients who had missing data for the admission hemoglobin levels and the composite endpoint were also excluded.
By using the database from the Shenzhen Second People’s Hospital,general clinical data,including age,gender,duration of T2DM,history of hypertension,use of angiotensin-converting enzyme inhibitors(ACEI)and/or angiotensin receptor blockers(ARB),body mass index(BMI;kg/m2),systolic blood pressure(SBP),and diastolic blood pressure(DBP),were recorded.Laboratory evaluations included fasting glycaemia,glycosylated hemoglobin(HbA1c),serum creatinine(Scr),24-h urinary protein,hemoglobin,serum albumin(ALB),serum uric acid,blood urea nitrogen,total cholesterol(TC),and triglycerides(TG).All these laboratory tests were performed and checked at the Central Laboratory of Shenzhen Second People’s Hospital.The blood and urine samples were collected when patients were on admission.And the blood samples were fasting venous blood.Urine samples were collected in one or more containers over a period of 24 h.Reagent based method and automated analyzer were used to measure these laboratory variables.The eGFR was calculated using the CKD epidemiology collaboration equation[9].The stages of CKD were classified as follows[10]:Stage 1,kidney damage with normal or increased eGFR(> 90 mL/min/1.73 m2);stage 2,mild reduction in eGFR(60-89 mL/min/1.73 m2);stage 3,moderate reduction in eGFR(30-59 mL/min/1.73 m2);stage 4,severe reduction in eGFR(15-29 mL/min/1.73 m2);stage 5,kidney failure(eGFR < 15 mL/min/1.73 m2or dialysis).Our focus was to understand the effect of hemoglobin on the composite endpoint.
Follow-up and endpoint
The patients were followed every 3 mo for at least 3 mo until June 2016.The composite endpoint was end-stage renal disease or a 50% reduction in the eGFR.
Statistical analysis
The Shapiro–Wilk test was used to test the normality of the data.Continuous variables are expressed as the mean ± SD(normal distribution)or median(quartiles)(skewed distribution),and categorical variables are expressed as frequencies or percentages.One-way ANOVA(normal distribution),Kruskal-Wallis H(skewed distribution)test,and chi-square test(categorical variables)were used to determine any significant differences between the means and proportions of the groups.The effects of hemoglobin levels on the composite endpoint were evaluated using Cox proportional hazards regression without adjustment and with adjustment for confounding variables.Hazard ratios(HRs)were reported per g/dL increment of hemoglobin levels(g/dL).Incremental models were fitted adjusting for(model 1)demographic factors(age,gender,and BMI);(model 2)demographic and traditional renal function risk factors(baseline eGFR,history of hypertension,SBP,DBP,24-h urinary protein,ACEI and/or ARB use,and ALB);(model 3)demographic factors,traditional risk factors,and lipids(TC and TG);and(model 4)demographic factors,traditional risk factors,lipids,and glycaemia control(duration of diabetes,fasting glycaemia,and HbA1c).Kaplan–Meier plots were generated using tertiles of hemoglobin data to illustrate findings.A smoothing spline curve was used to describe the adjusted relationship between hemoglobin levels and the composite endpoint.Two-tailed probability values of < 0.05 were considered to indicate statistical significance.All statistical analyses were performed using Empowerstats(www.empowerstats.com)and R software(http://www.R-project.org).
Declarations
The proposal was approved by the Clinical Research Ethical Committee of the Shenzhen Second People’s Hospital,and all subjects provided informed consent before enrollment.We adhered to the principles of the Declaration of Helsinki.The procedures followed were in accordance with institutional guidelines.
RESULTS
Association of hemoglobin levels with demographic and clinical factors
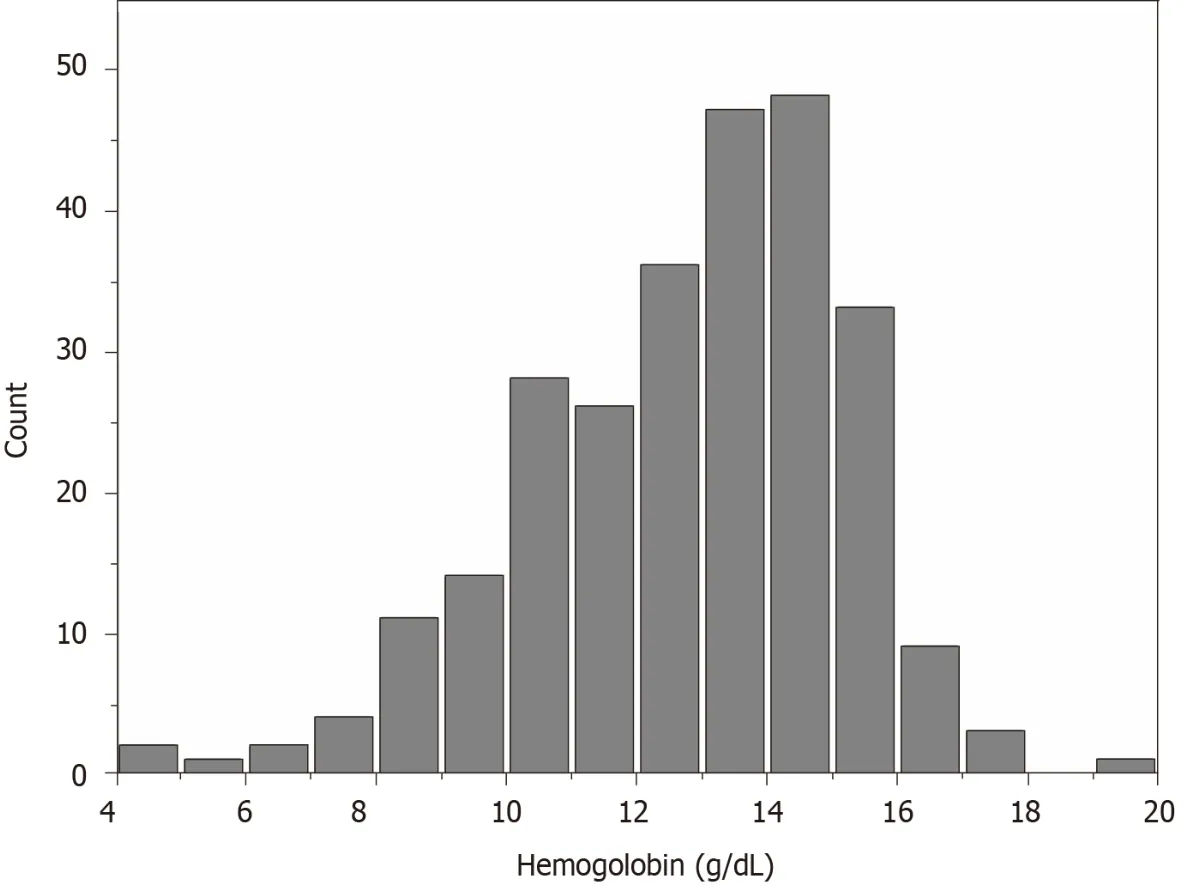
The average hemoglobin for the whole sample was 12.77 ± 2.42 g/dL.The distribution of hemoglobin levels in the full cohort is shown in Figure 1.We categorized the admission hemoglobin levels into tertiles to analyze.The cut-points for the tertile 1(T1),tertile 2(T2),and tertile 3(T3)were < 11.97,11.97-< 13.90,and 13.90-< 19.40,respectively.The baseline characteristics of study participants by hemoglobin tertiles are presented in Table 1.There were significant associations of higher hemoglobin with decreasing age,duration of diabetes,SBP,BUN,potassium,phosphate,HbA1c,24-h urinary protein,and less history of hypertension.Male sex,ACEI/ARB use,and higher BMI,eGFR,DBP,ALB,and fasting blood glucose were also associated withhigher hemoglobin.
Association between hemoglobin levels and the composite endpoint
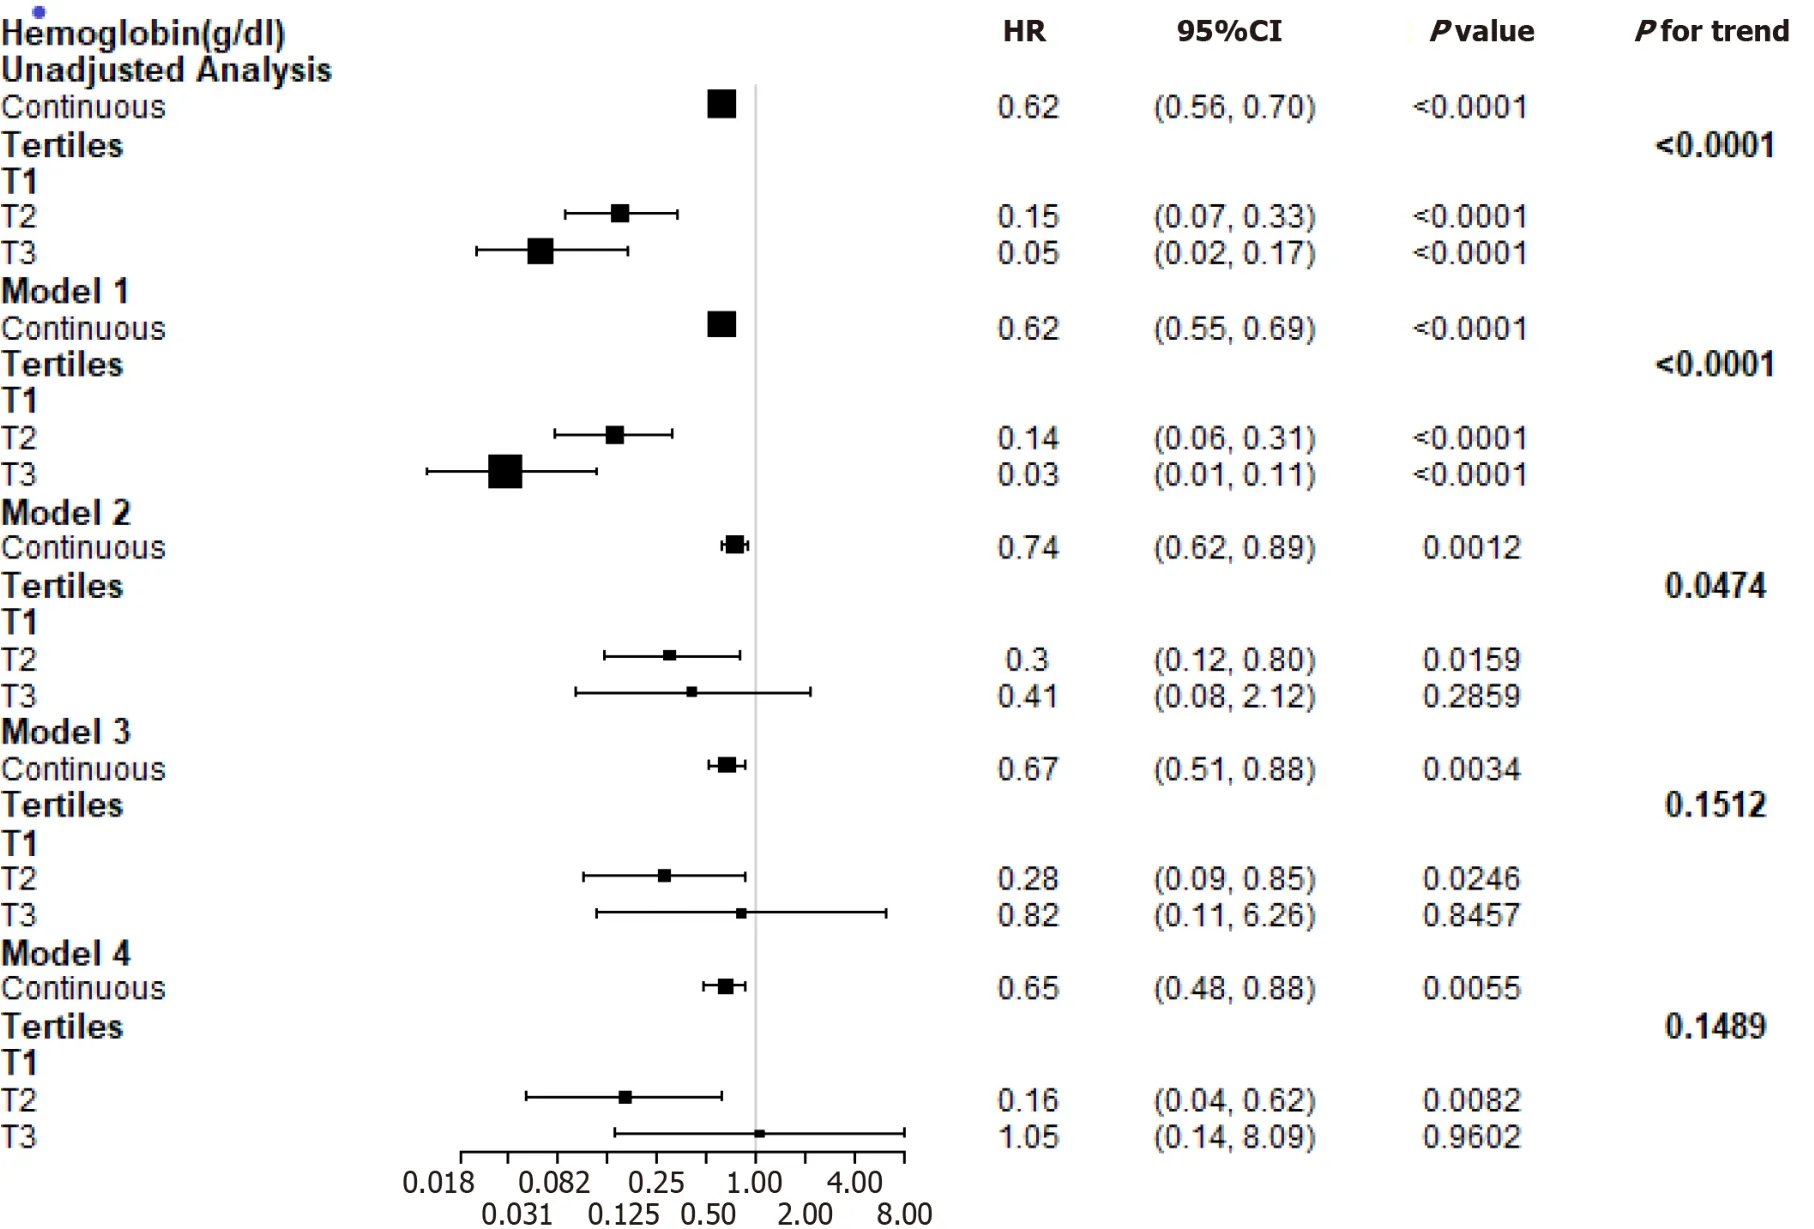
During the follow-up period of 15.19 ± 9.33 mo,a total of 52 participants experienced the composite endpoint.Study entry hemoglobin levels independently and inversely correlated with the risk of the composite endpoint(HR:0.74,P= 0.0012)in the model adjusted for demographic factors and known risk factors.The composite endpoint remained significant(HR:0.65,P= 0.0055)after further adjustment for lipids and glycaemia control(Figure 2).

Figure 1 Distribution of hemoglobin levels in the study sample.

Figure 2 Estimated hazard ratio for the composite endpoint associated with hemoglobin in different models.Model 1:Demographic factors(age,gender,and body mass index);model 2:Demographic factors and traditional renal function risk factors(baseline estimated glomerular filtration rate,history of hypertension,systolic blood pressure,diastolic blood pressure,24-h urinary protein,angiotensin-converting enzyme inhibitors and/or angiotensin receptor blockers use,and albumin);model 3:Demographic factors,traditional risk factors,and lipids(total cholesterol and triglycerides);model 4:Demographic factors,traditional risk factors,lipids,and glycaemia control(duration of diabetes,fasting glycaemia,and glycosylated hemoglobin).HR:Hazard ratio;CI:Confidence interval.
Figure 2 presents multivariable-adjusted HRs for the composite endpoint according to a 1 g/dL increase in the hemoglobin levels.The adjusted HR for the highest and middle tertiles compared to the lowest tertile of hemoglobin was 0.82(P= 0.8457)and 0.28(P= 0.0246),respectively,in the adjusted model(demographic factors,traditional risk factors,TC,and triglycerides).However,after further adjustment for the duration of diabetes,fasting glycaemia,and HbA1c,hemoglobin was positively related to the risk of the composite endpoint(HR:1.05,P= 0.9602)when the highest tertile was compared to the lowest tertile of hemoglobin.
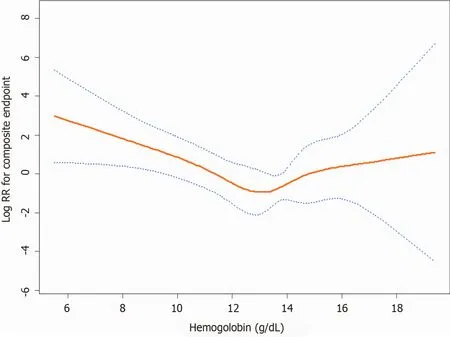
Figure 3 shows a U-shaped exposure-response relationship between admission hemoglobin levels and the composite endpoint after adjusting for age,gender,BMI,baseline eGFR,history of hypertension,SBP,DBP,24-h urinary protein,ACEI and/or ARB use,ALB,TC,TG,duration of diabetes,fasting glycaemia,and HbA1c.The curve tended to reach the lowest level at an optimal hemoglobin level(approximately 13.3 g/dL).A higher admission hemoglobin level(hemoglobin < 13.3 g/dL)was associated with a lower risk of the composite endpoint(HR:0.58,P= 0.0007).However,when hemoglobin was > 13.3 g/dL,the adjusted HR was 1.63(P= 0.1585).Details are shown in Table 2.

Table 2 Threshold effect analysis of hemoglobin levels on the composite endpoint using piecewise linear regression
Kaplan–Meier curves show that patients within the upper tertiles of hemoglobin had a lower cumulative incidence of the composite endpoint(Figure 4).
Stratified analysis of the composite endpoint incidence
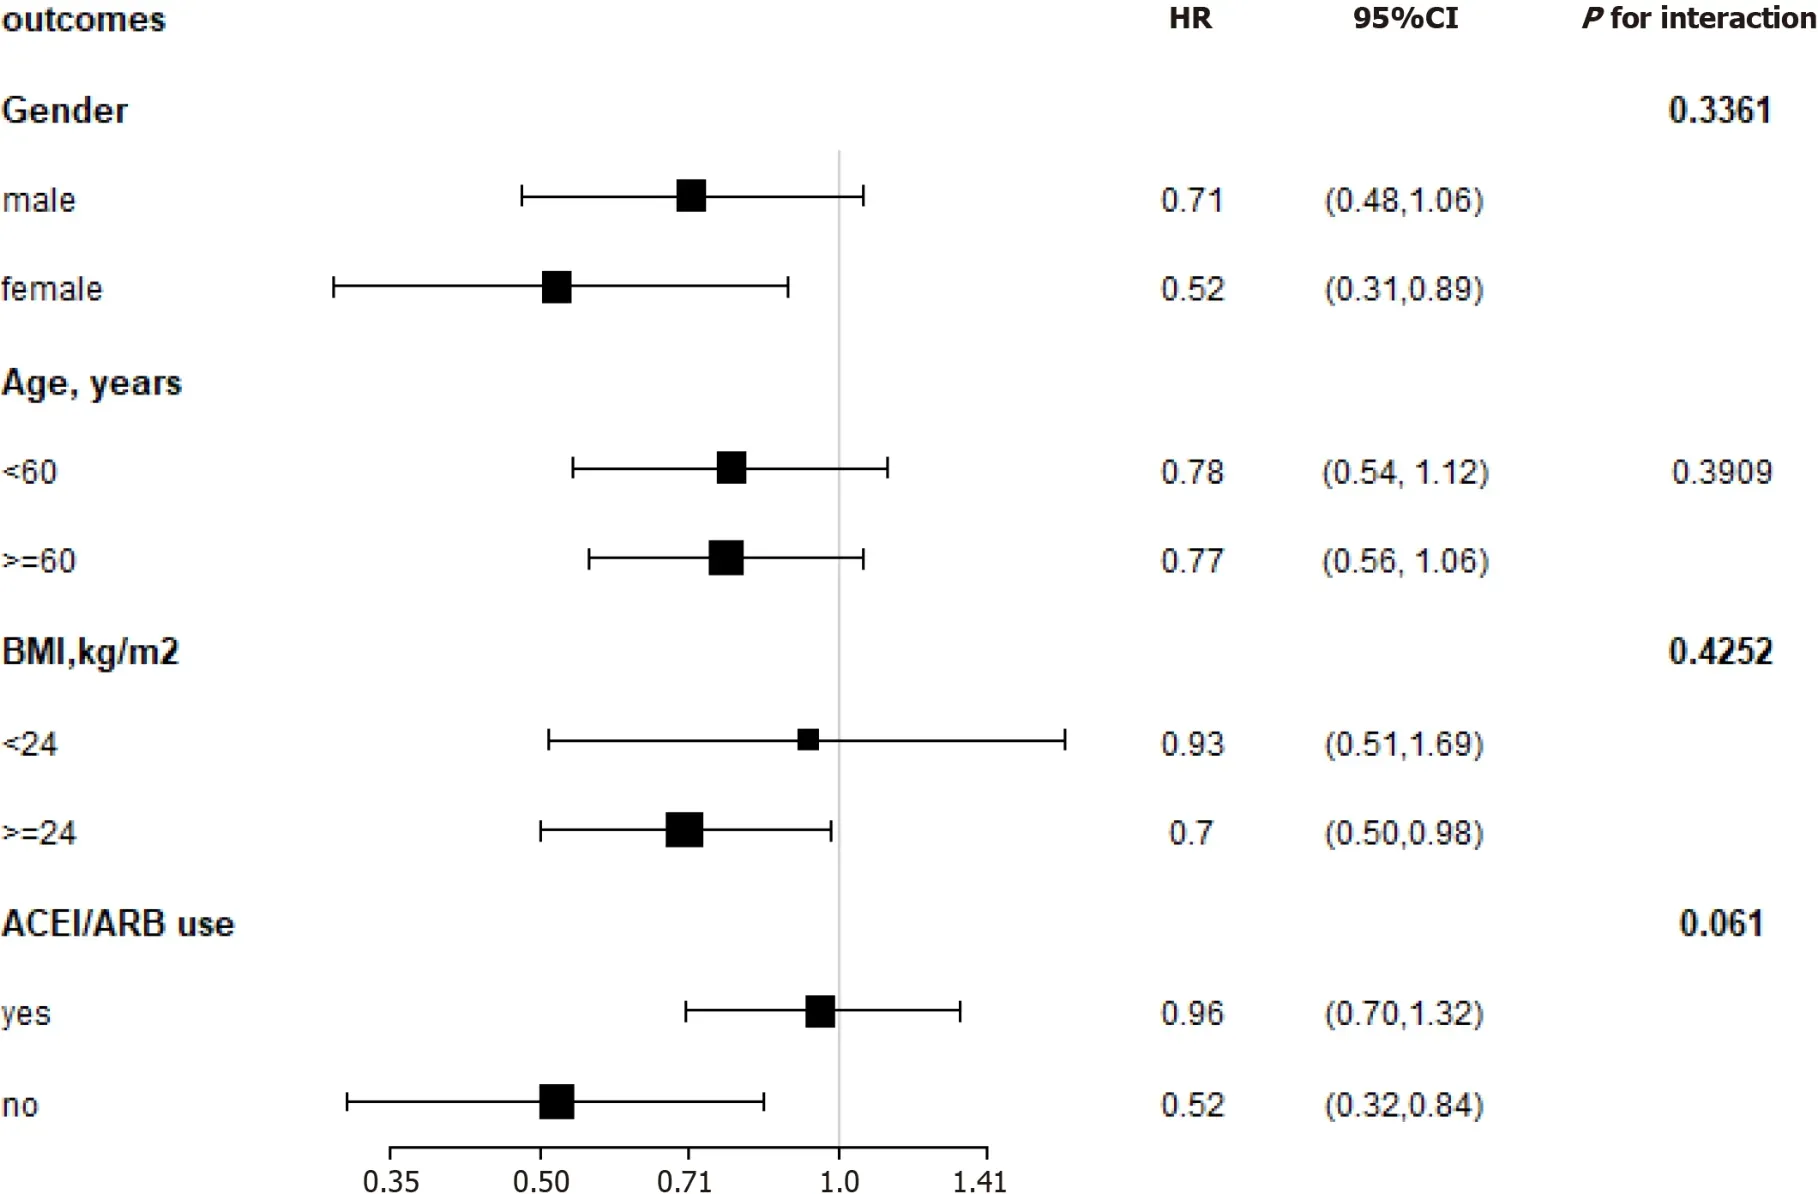
We performed stratified analyses by age(< 60vs≥ 60 years),gender,BMI(< 24vs≥ 24 kg/m2),and ACEI/ARB use(yesvsno).In our cohort,the impact of hemoglobin on the composite endpoint was not affected by age,gender,BMI,or ACEI/ARB use during the follow-up period(Pfor all interactions > 0.05)(Figure 5).

Figure 3 A U-shaped relationship was observed between hemoglobin levels and the composite endpoint.The curve tended to reach the lowest level at an optimal hemoglobin level(approximately 13.3 g/dL).The red line denotes fitted curves,and the blue lines represent 95%CI for the association between hemoglobin levels and the composite endpoint.Adjusted for(model 4):Age,gender,body mass index,baseline estimated glomerular filtration rate,history of hypertension,systolic blood pressure,diastolic blood pressure,24 h urinary protein,angiotensin-converting enzyme inhibitors and/or angiotensin receptor blockers use,albumin,total cholesterol,triglycerides,duration of diabetes,fasting glycaemia,and glycosylated hemoglobin.
DISCUSSION
In this retrospective observational study involving patients with T2DM,we observed the relationship between the admission hemoglobin levels and the composite endpoint.In the Cox regression model,high levels of hemoglobin were associated with a decreased risk of the composite endpoint after adjusting for age,gender,BMI,traditional risk factors,TC,and TG.
By stratifying the patients into subgroups,the results showed that the impacts of hemoglobin on the composite endpoint were not affected by age,gender,BMI,or ACEI/ARB use.Many studies also showed that low hemoglobin was associated with adverse clinical outcomes and poor life quality[11-13].Shachamet al[14]analyzed 1248 patients diagnosed with ST-segment elevation myocardial infarction and demonstrated that a lower admission level of hemoglobin and anaemia were independent predictors of acute kidney injury.Dangaset al[15]showed that lower baseline hematocrit level was the most important independent predictor of contrast-induced nephropathy in CKD patients.An observational study included 788 patients with stages 3-5 CKD who underwent cardiac surgery and showed that preoperative anaemia was related to poor postoperative outcomes[16].
Although higher hemoglobin targets were suggested to reduce the requirement for transfusions and benefit patients’ life quality[17-19],disadvantages were also been observed[7,20,21].Several randomized controlled trials also showed that higher hemoglobin target levels were related to a higher risk of adverse outcomes[22-24].In this study,after adjusting for the duration of diabetes,fasting glycaemia,and HbA1c,hemoglobin was positively related to the risk of the composite endpoint when the highest tertile was compared to the lowest tertile of hemoglobin.However,it is not statistically significant.We further performed a smooth spline curve and found a Ushaped exposure-response relationship between admission hemoglobin levels and the composite endpoint.The curve tended to reach the lowest level at an optimal hemoglobin level(approximately 13.3 g/dL).For the optimal hemoglobin level,lower and higher hemoglobin concentrations were related to higher rates of poor prognosis[25,26].
Furthermore,two large randomized controlled trials[24,27]showed no benefits of a higher hemoglobin target on cardiovascular events or death or found an increased rate of adverse events.Holstet al[28]found that patients assigned to blood transfusion at a higher hemoglobin threshold and at a lower threshold were similar on mortality at 90 d and risks of ischaemic events.Higher hemoglobin level patients had no benefit.
There are several explanations for the relationship between admission hemoglobin levels and the deterioration of renal function.Lower hemoglobin levels might decrease oxygen delivery and cause renal medullary hypoxia.The outer medullary region has high metabolic activity and low prevailing oxygen tension,so it is susceptible to ischaemic injury[29].Angiotensin II is supposed to be a possible reason for tissue hypoxia during early CKD.The activated renin-angiotensin system induces tubular sodium reabsorption and vasoconstriction,so it results in higher oxygen consumption and relative tubular hypoxia[30-32].However,an excessive hemoglobin level can result in increased blood viscosity and elevated blood pressure.Therefore,there is a U-shaped exposure-response relationship between hemoglobin levels and the composite endpoint.In our study,approximately 13.3 g/dL is an optimal hemoglobin level.
We acknowledge that there are several limitations to our study.First,this was a single-center,retrospective,nonrandomized trial.It was based on observational data,and many known or unknown confounding factors may exist,even though we attempted to adjust for confounding factors.Second,we used Scr to estimate GFR.As tubular secretion of creatinine and the variability in creatinine generation between individuals and for the same individual,the use of creatinine to estimate GFR has some limitations[33].The eGFR can be validated by serum cystatin C or 51Cr-EDTA GFR,but these tools were not available in our study.Third,there were indeed fewer outcomes among patients with a higher Hb.Thus,the CIs around the estimates for the composite outcome in Figure 3 are very wide above an Hb >13 g/dL.The reason may be that this is a small-sized study.Fourth,this was only a single-center study,and whether these observations can be extended to whole Chinese and non-Chinese T2DM patients remains to be determined.

Figure 4 Kaplan-Meier curves according to hemoglobin tertiles.

Figure 5 Subgroup analysis of hemoglobin and the composite endpoint.Adjusted for the baseline estimated glomerular filtration rate,systolic blood pressure,diastolic blood pressure,24-h urinary protein,albumin,total cholesterol,triglycerides,duration of diabetes,fasting glycaemia,and glycosylated hemoglobin.BMI:Body mass index;ACEI:Angiotensin-converting enzyme inhibitors;ARB:Angiotensin receptor blockers;HR:Hazard ratios.
CONCLUSION
In brief,the results of this study demonstrated that among patients with T2DM,a Ushaped exposure-response relationship exists between admission hemoglobin levels and the composite endpoint.In our study,approximately 13.3 g/dL is an optimal hemoglobin level.A lower admission hemoglobin level(hemoglobin < 13.3 g/dL)is an independent predictor of the composite endpoint.These findings have important clinical and public health implications.As hemoglobin is a common and easily available measurement in clinical activity,it is a convenient and feasible way to identify those patients who are at high risk of developing the composite endpoint and have a poor prognosis.
ARTICLE HIGHLIGHTS
Research background
Information on the association of hemoglobin with renal damage is uncertain,and the optimal hemoglobin target remains controversial.
Research motivation
The admission hemoglobin levels would influence the prognosis in patients with type 2 diabetes mellitus(T2DM).
Research objectives
To evaluate the relationships between admission hemoglobin levels and prognosis in patients with T2DM
Research methods
A total of 265 patients with T2DM were included to perform a retrospective analysis.The general information and biochemical indices of these patients were statistically analyzed.
Research results
We found a U-shaped relationship between hemoglobin levels and the composite endpoint.The curve tended to reach the lowest level at an optimal hemoglobin level.
Research conclusions
There is a U-shaped relationship between hemoglobin levels and renal damage in these patients.
Research perspectives
We used a retrospective study to evaluate the relationships between admission hemoglobin levels and prognosis in patients with T2DM.
杂志排行
World Journal of Diabetes的其它文章
- Letter to editor ‘Gastroenteropathy in gastric cancer patients concurrent with diabetes mellitus’
- Comprehensive genetic screening reveals wide spectrum of genetic variants in monogenic forms of diabetes among Pakistani population
- Adherence to Mediterranean diet and advanced glycation endproducts in patients with diabetes
- Factors influencing the effectiveness of using flash glucose monitoring on glycemic control for type 1 diabetes in Saudi Arabia
- p66Shc-mediated oxidative stress is involved in gestational diabetes mellitus
- Profilin-1 is involved in macroangiopathy induced by advanced glycation end products via vascular remodeling and inflammation
