Prediction of malaria cases in the southeastern Iran using climatic variables: An 18-year SARIMA time series analysis
2021-11-19HamidRezaTohidinikHosseinKeshavarzMehdiMohebaliMandanaSanjarGholamrezaHassanpour
Hamid Reza Tohidinik, Hossein Keshavarz, Mehdi Mohebali, Mandana Sanjar, Gholamreza Hassanpour
1HIV/STI Surveillance Research Center, and WHO Collaborating Center for HIV Surveillance, Institute for Futures Studies in Health, Kerman University of Medical Sciences, Kerman, Iran
2Center for Research of Endemic Parasites of Iran (CREPI), Tehran University of Medical Sciences, Tehran, Iran
3Department of Medical Parasitology & Mycology, School of Public Health, Tehran University of Medical Sciences, Tehran, Iran
ABSTRACT
KEYWORDS: Malaria; Time series; SARIMA; Forecasting;Climate; Iran
Significance
The SARIMA model was applied to predict the number of malaria cases and to check the effect of climate on the disease incidence. The occurrence of malaria in a given month was mostly related to the number of cases occurring in the prior 1 and 12 months. The number of rainy days with an 8-month lag and temperature with a 3-month lag can improve the predictive power of the model.
1. Introduction
Malaria is a serious vector-borne disease in the world, particularly in the tropical and subtropical regions[1]. It is caused by protozoan parasites of the genus Plasmodium, which are transmitted across humans by infected female Anopheles mosquitoes[2]. The disease is the fifth cause of disability-adjusted life years in children younger than 10 years in 2019[3]and remained an important cause of mortality and morbidity in many parts of the world where can have negative effects on the health and socioeconomic status of the population[4,5].According to the World malaria report 2018, there were 219 million cases of malaria globally in 2017 and 435000 malaria deaths. The majority of these cases (92%) were in the African Region, followed by the South-East Region with 5% of the cases and the Eastern Mediterranean Region with 2%[1].
Iran is one of the malaria-endemic countries in the world. In spite of successful implementation of malaria control measures that led to a significant reduction in the incidence of the disease over the last decade[6,7], it has remained a major public health concern in Iran. It can be explained by drug resistance[8,9]and the extremely genetic polymorphic nature of Plasmodium spp.[10-12]. More than 90% of malaria cases occur in the southern and southeastern regions that share borders with Pakistan and Afghanistan[13]. Sistan and Baluchistan province is an endemic area of malaria in Iran with an appropriate climate for breeding various malaria vectors[7]. The province is susceptible to malaria epidemics due to several factors including climate diversity[14].
Temperature, precipitation, and humidity are important meteorological factors associated with the population dynamics of malaria vectors which could affect the disease spread[15,16].
Early detection, prevention, and containment of malaria epidemics is one of the four principal components of the WHO’s global malaria control strategy[17]. Therefore, developing predictive models is an essential part of malaria surveillance that enables policymakers and public health staff to predict future incidence of the disease and act proactively[18]. Seasonal Integrated Moving Average (SARIMA)model[19]is widely used to predict different infectious diseases including malaria[20-23]. Some statistical models have been adopted for malaria in some regions of Iran[14-16,18-26], but to the best of our knowledge, no study had applied SARIMA time series to predict malaria incidence in Sistan and Baluchistan province. Therefore, the objective of this study was to provide a SARIMA time series model for the prediction of malaria incidence in the southeast of Iran, and to check if the inclusion of climatic variables enhances the predictive power of the model.
2. Subjects and methods
2.1. Ethical approval
The study protocol was approved by ethical committee of Tehran University of Medical Sciences with registration number IR.TUMS.SPH.REC-13970270.
2.2. Study area
Sistan and Baluchistan province, in the southeast of Iran (28.5°N, 60.5° E, Figure 1), is the second largest province of Iran with an area of 180726 km² and a population of 2.8 million. The climate is relatively hot and dry in most areas but has high humidity in the southern coastal regions. Mean temperature ranges from 17 ℃ in winter to 32 ℃ in summer, and mean annual precipitation of 58 mm range from 0.8 mm per month in summer to 12.3 mm in winter months.

Figure 1. Geographical location of the study area in the southeast of Iran.
2.3. Data collection
We used the monthly number of confirmed cases of malaria from April 2001 to March 2019 that was provided by the Centers for Surveillance of Communicable Diseases in Zahedan, Iranshahr and Zabol Universities of Medical Sciences. We retrieved the monthly meteorological data for the same period from Meteorological Bureau of Sistan and Baluchistan province. We gathered monthly average temperature (℃), average minimum temperature (℃), average maximum temperature (℃), average wind speed, average number of rainy days, accumulated rainfall (millimeters), average relative humidity (%), and average sunny hours. We considered data from April 2001 to March 2018 as training data to fit the model, and kept the number of new malaria cases during April 2018-March 2019 as the validation data.
2.4. Statistical analysis
We described number of malaria cases in different months/seasons as median (Q1, Q3). Spearman correlation coefficient was used to assess the correlation between number of malaria cases and meteorological variables. To find the best model fitted to our data and to predict the number of malaria cases, we applied SARIMA(p, d, q) (P, D, Q)s model using Box-Jenkins approach in which p is non-seasonal autoregressive (AR) order, d is the number of nonseasonal differencing passes, q is non-seasonal moving average(MA) order, and P, D, Q are corresponding seasonal orders. In this model, s is the seasonal period of the data (12 months in this study).To fit the model, we first used disease trend plot and Box-Cox test to check the stationarity in the variance. Because of non-stationarity in the variance (θ=0), we used natural log transformed (Ln) of the number of malaria cases in the model. Second, Dicky-Fuller test was used to evaluate stationarity in the means of series. As the test showed stationarity in means (P=0.07), we did not apply any nonseasonal differencing pass on data (d=0) but to adjust seasonality of malaria cases and meteorological variables, first order seasonally differencing was applied to the model (D=1).
Third, we plotted autocorrelation function (ACF) and partial autocorrelation function (PACF) plots on stationary data to identify possible values of MA (q, Q) and AR (p, P) components,respectively. Fourth, we applied likelihood ratio test to estimate parameters of SARIMA model. We checked the goodness-of-fit of each model, by plotting ACF and PACF plots for residuals to check their normality, and using Ljung-box (Q) test for residuals to check whether they are white noise with mean of 0 and constant variance.
In the next step, we incorporated meteorological variables into the final SARIMA model to check their ability to improve the predictive power. To do so, we first removed autocorrelation within each individual series via pre-whitening procedure in which SARIMA model was applied on each series of meteorological variables to remove their seasonal trend. Then, the cross-correlation between residuals of models was computed and climatic variables significantly correlated with the number of malaria cases were checked as potential covariates in multiple SARIMA model.Variance inflation factor >5 was considered as collinearity between climatic variables. To find the best fitted model, we compared R,the Akaike Information Criterion (AIC) and Bayesian Information Criterion (BIC) in different SARIMA models, where the highest Rand lowest AIC and BIC showed better fitness in the models.
We finally predicted 12-month number of malaria cases during April 2018-March 2019 for selected SARIMA models and compared observed and out-of-sample predicted values. The root mean square error (RMSE) was computed for both training and validation data as an index for validity of predictions in the models. Smaller values of this index show better predictive power of the model. The root mean square error equals to:
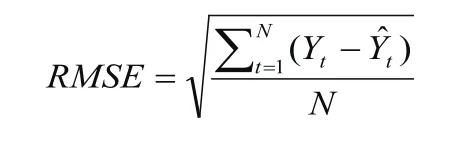
with Yas the observed values, Ŷt as the predicted values at time t, and N as the number of observations. We used STATA 12 (Stata Corp, College Station, TX, USA) for all statistical analyses and considered a two-sided P<0.05 as statistically significant.
3. Results
3.1. Malaria cases
From April 2001 to March 2019, a total of 85378 malaria cases including 60589 indigenous and 24789 imported cases were reported from Sistan and Baluchistan province. During this period,Plasmodium vivax and Plasmodium falciparum were the most common types of Plasmodium in the area (Appendix Figure 1). In addition to seasonal pattern, the disease showed a rising trend since 2001 until 2009 with a peak in 2003, but it showed a downward trend from 2009 onward (Appendix Figure 2).

Figure 2. Boxplot of the number of malaria cases in different months from 2001 to 2018 in Sistan and Baluchistan province, Iran.
The monthly distribution showed that the highest number of malaria cases occurred in October with 684 (139, 887) [median (Q1, Q3)]cases followed by September with median 648 (117, 912) [median(Q1, Q3)]cases, and the lowest number happened in February with median 25 (8, 35) [median (Q1, Q3)]cases per month. Transmission of malaria is possible in all seasons of the year, but most cases have occurred in summer and then in autumn, respectively (Figure 2).
3.2. The impact of climate on malaria
Spearman correlation coefficients show that number of malaria cases was directly associated with average temperature, maximum and minimum temperature, wind speed and sunny hours (P<0.01). It was also inversely associated with accumulated rainfall, rainy days and relative humidity (P<0.01) (Appendix Table 1).
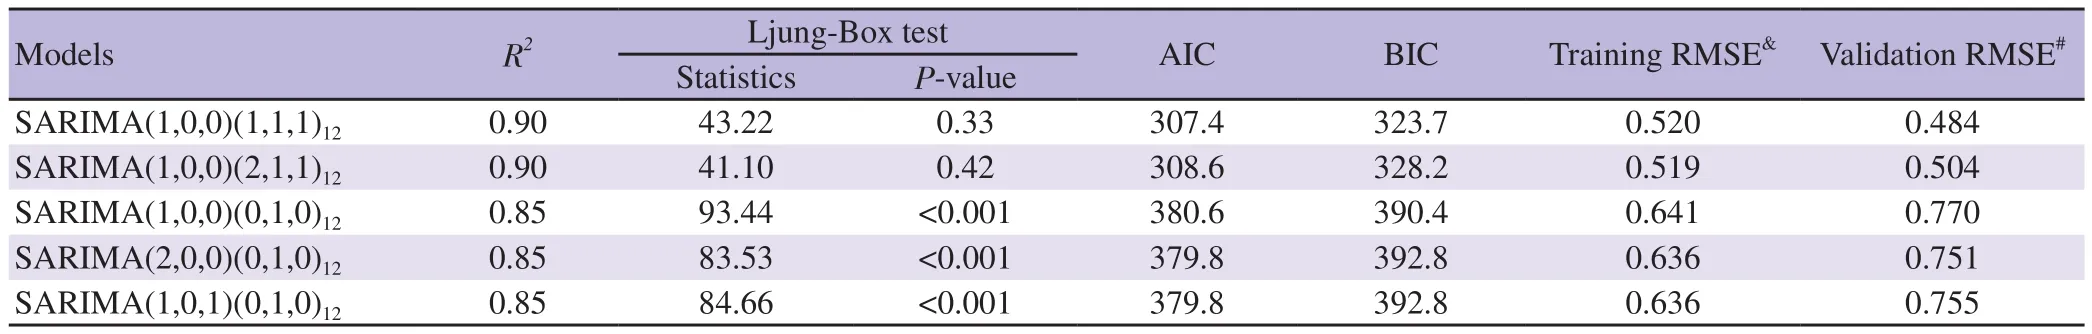
Table 1. Comparison of five candidate univariable SARIMA models, with different values of p, P, q, and Q, for the number of malaria cases in the southeast of Iran (April 2001-March 2018).
Figure 3A and 3B present the ACF and PACF plots using data from 2001 to 2018. ACF suggested q≤2 and Q≤1 while PACF revealed that p≤1 and P≤2.
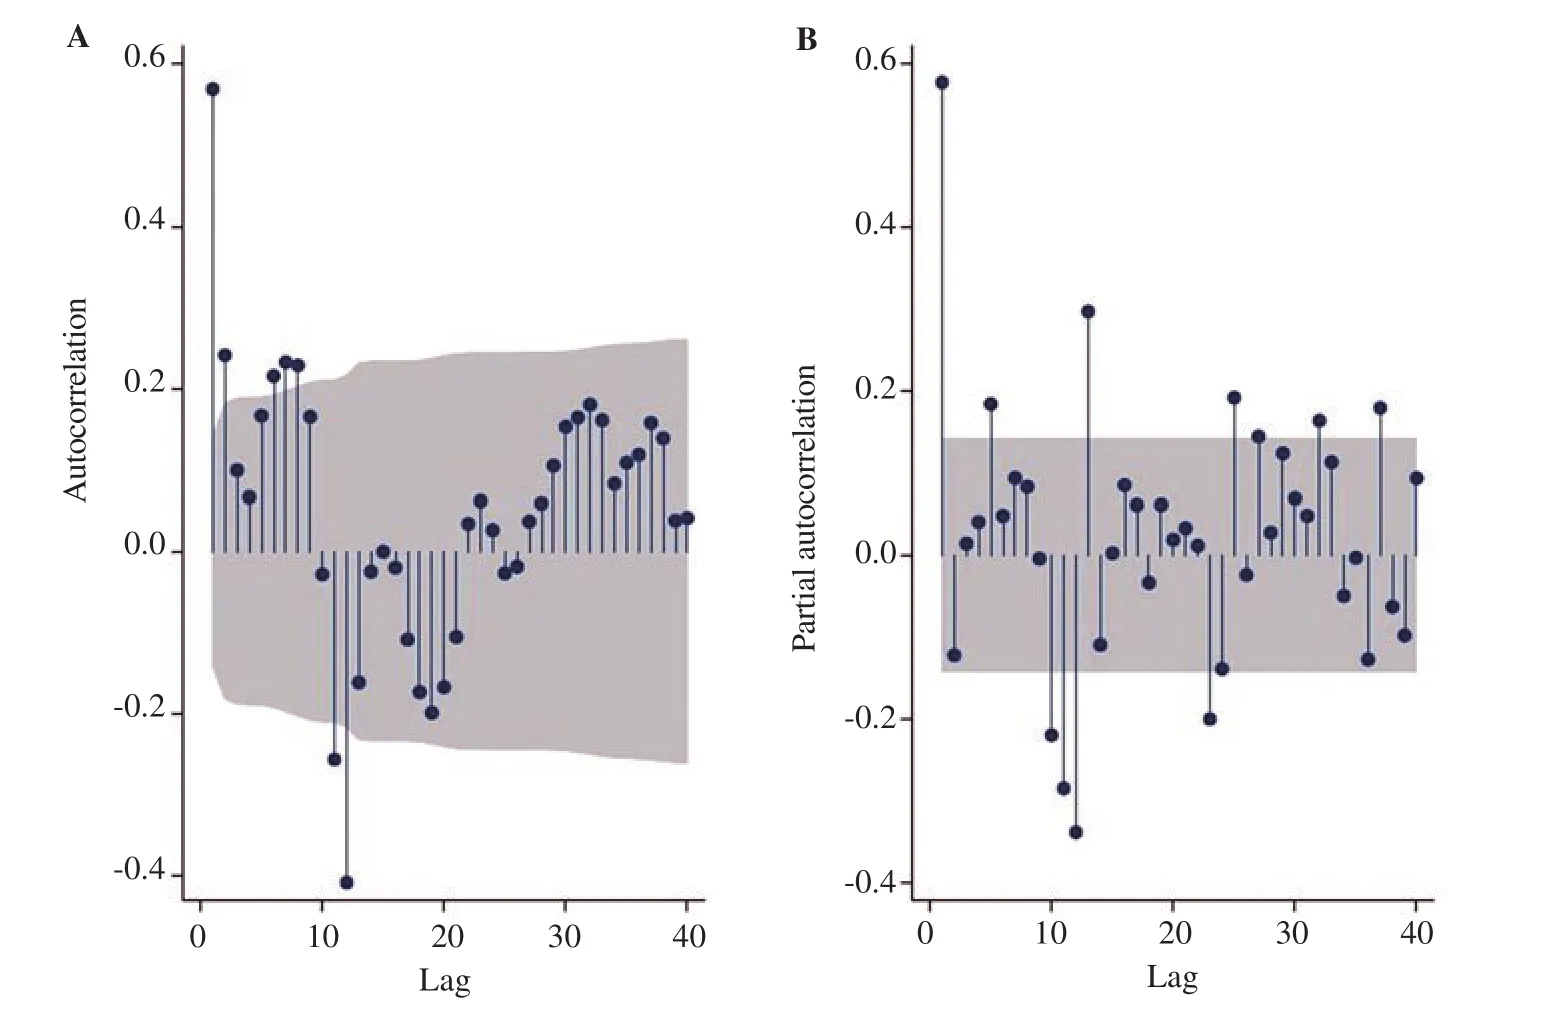
Figure 3. Autocorrelation (A) and partial autocorrelation (B) functions based on the seasonally differenced, in-transformed number of malaria cases from 2001 to 2018 in Sistan and Baluchistan province, Iran; Autocorrelation suggests q≤2, Q≤1, and partial autocorrelation suggests p≤1 and P≤2.
Various SARIMA models were assessed and the best-fitted univariate model was SARIMA (1,0,0)(1,1,1)(AIC=307.4,BIC=323.7, training RMSE=0.520, validation RMSE=0.484). Some selected SARIMA models are depicted in Table 1.
Coefficients and statistics of the parameters of SARIMA (1,0,0)(1,1,1)have been presented in Table 2 where first-order nonseasonal and seasonal AR coefficients, and the first-order seasonal MA coefficient are significant (P<0.001).
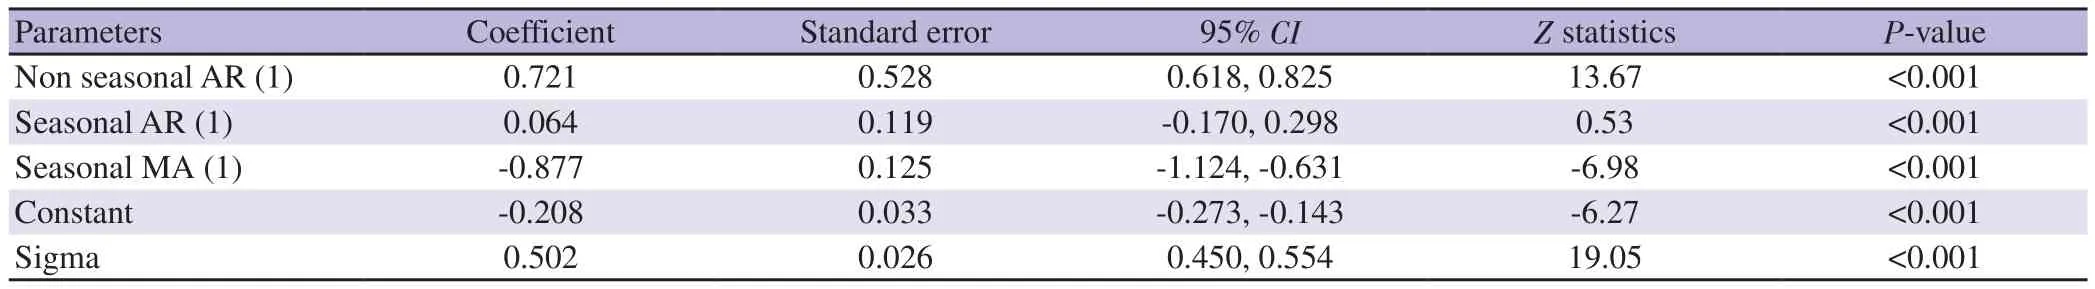
Table 2. Coefficients and parameters of the SARIMA (1,0,0)(1,1,1)12 model to predict the number of malaria cases in the southeast of Iran (April 2001-March 2018).
The components of the best fitted SARIMA models for meteorological variables in pre-whitening phase are shown in Appendix Table 2.
After cross-correlation analysis, we found average temperature with a 3-month lag and inverse number of rainy days with an 8-month lag as the best predictors that can relatively improve the predictive performance of the univariate model. Table 3 revealed a non-significant reverse relation between mean temperature with a 3-month lag and the number of malaria cases, and a significant direct association between inverse number of rainy days with an 8-month lag and the occurrence of the disease. For identifying the best model for prediction, we compared the univariate model with multivariable models and SARIMA (1,0,0)(1,1,1)including mean temperature with a 3-month lag, which had lower RMSE (0.414), was selected as the final multiple model. The distribution of residuals of the model was normal (Appendix Figure 3) and Ljung-Box test confirmed that residuals are white noise with zero mean and constant variance(P=0.54).
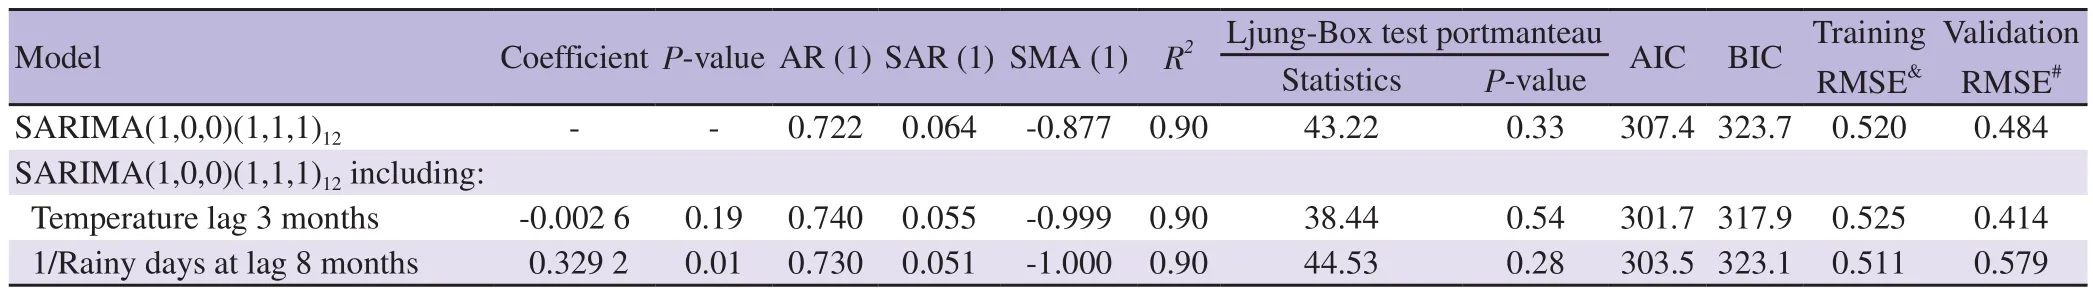
Table 3. Characteristics of different multivariable SARIMA models including meteorological variables to predict the incidence of malaria in the southeast of Iran (April 2001 to March 2018).
The comparison between the predicted and observed monthly number of malaria cases of both univariate and multiple models are presented in Table 4. Figure 4 shows the observed numbers and predicted values for malaria cases from 2010 to 2018 and out-of-sample predictions in 2019 applying SARIMA (1,0,0)(1,1,1)+temperature with the 3-month-lag model. Finally, as illustrated in Appendix Figure 4, we predicted the number of malaria cases for the next Iranian year (April 2019-March 2020) in Sistan and Baluchistan province. We predicted that totally, about 174 cases of malaria would occur in this province during April 2019 to March 2020. Among them, about eight cases would occur in first three months of 2020.

Table 4. Predicted numbers of malaria cases during April 2018-March 2019 in the southeast of Iran, calculated from two different SARIMA (p,d,q)(P,D,Q)12 models.

Figure 4. (A) observed and predicted number of malaria cases from 2010 to 2019, (B) out-of-sample predictions for April 2018-March 2019 in the southeast of Iran, applying SARIMA(1,0,0)(1,1,1)12+temperature with 3-month lag.
4. Discussion
The results of this study showed that malaria in Sistan and Baluchistan province had a significant decreasing trend during 2001 to 2019, which could be due to improving preventive interventions such as the distribution of insecticide-treated mosquito nets and indoor and outdoor spraying[27], early detection tools, especially the use of rapid diagnostic tests, effective vector control, and proper implementation of modern malaria control programs[7].
Our study showed that the number of autochthonous malaria cases in Sistan and Baluchistan province starts to increase from May and reaches its peak in September and October, and then declines and reaches its lowest level in February. The main malaria vectors in Sistan and Baluchistan province are primarily Anopheles (An.)culicifacies and An. stephensi[28]. An. culicifacies has two main activity peaks in Sistan and Baluchistan province; the main peak occurs in June and the second in October[29,30]. It takes two weeks for Anopheles mosquitoes to complete their life cycle[31]. Incubation period of Plasmodium parasite may last 8-22 days in the mosquito’s body[32]and 12-14 days in the human host[33]. It seems that during the first peak, Anopheles mosquitoes have ample time to generate a large population of infectious vectors, leading to an increase in the number of malaria cases in the following months.
This study also indicated that the occurrence of the disease was possible in all seasons of the year, but the least transmission occurred in winter. It confirms that the main vectors of malaria in this area are active almost all year long, and are able to transmit the disease[29,31-33].In this study, SARIMA (1,0,0)(1,1,1)model as univariate and SARIMA (1,0,0)(1,1,1)including mean temperature with a 3-month lag as multivariable model were selected for the prediction of the number of malaria cases in Sistan and Baluchistan province while the latter had predictions closer to the observed number of malaria cases. It seems that the model could provide an acceptable prediction in Sistan and Baluchistan province.
Ostovar et al. in Hormozgan province, southern Iran[23], Breit et al. in Sri Lanka[34]and Abeku et al. in Ethiopia[35]used ARIMA model for predicting malaria cases. Ebhuoma et al. in Kwazula-Natal, South Africa, suggested the SARIMA (0,1,1)(0,1,1)as the best model for predicting malaria[36]. Wangdi et al. in Bhutan[31]and Kumar et al. in New Delhi[16]selected ARIMA (2,1,1)(0,1,1)and ARIMA (0,1,1) (0,1,0)to forecast malaria, respectively.
In our study, mean temperature with a 3-month lag showed a reverse relationship with the number of malaria cases. The optimum temperature for Anopheles mosquitoes is 20 ℃ to 30 ℃. At these temperatures, the Anopheles can live long enough to acquire and transmit the parasite[37]. Increasing the temperature to above 30 ℃has negative effects on the mosquitoes' growth and reduces the propagation rate of Plasmodium in the vector's body[38], leading to reduced ability of mosquitoes to transmit the disease, which decreases the number of malaria cases consequently.
In the study of Ostovar et al. in Hormozgan province, the temperature with a 2-month lag had a negative relationship with malaria cases[23], while Mohammadkhani et al. in Sistan and Baluchistan province[26]and Haghdoost et al. in Kahnooj in the southeast of Iran[39]reported that the temperature with a 1-month lag was directly related to malaria cases. This delay is reported as one month in China[38,40]and Bhutan[31], and two months in Tibet[41].
Applying a relatively long period of time and including a variety of climatic variables in the prediction model of the disease were among the strengths of the present study. On the other hand, we were unable to include some factors such as socio-economic factors, population movement, immunity status, sanitation condition, implementation of malaria control programs and ecological factors in the model which could be considered in future studies about this disease.
Malaria showed a decreasing trend in the southeast of Iran as one of the traditional endemic areas of the disease in the region. SARIMA time series model including climatic variables was able to forecast the number of malaria cases with relatively good accuracy in this region.
Conflict of interest statement
The authors declare that they have no conflict of interest.
Acknowledgement
This study was financially supported by the Tehran University of Medical Sciences (project No: 97-03-160-40156).
Authors’ contributions
H.R.T., H.K. and Gh.H. developed the theoretical formalism,H.R.T., and M.S. performed the analytic calculations. All authors contributed to the final version of the manuscript. Gh.H. supervised the project.
杂志排行
Asian Pacific Journal of Tropical Medicine的其它文章
- Favipiravir and its potentials in COVID-19 pandemic: An update
- Efficacy and safety of ivermectin for COVID-19: A systematic review and meta-analysis
- Prevalence of non-tuberculosis mycobacteria among samples deposited from the National Tuberculous Reference Laboratory of Iran (2011-2018)
- Detection of dengue virus serotype 3 in Cajamarca, Peru: Molecular diagnosis and clinical characteristics
- Clinical, biochemical and imaging characteristics of adrenal histoplasmosis in immunocompetent patients in a non-endemic area: A case series
- Recovery of child immunization programs post COVID-19